Free Statistics

of Irreproducible Research!

Author's title

Author*The author of this computation has been verified*
R Software Modulerwasp_multipleregression.wasp
Title produced by softwareMultiple Regression
Date of computationFri, 21 Nov 2008 05:07:32 -0700
Cite this page as followsStatistical Computations at FreeStatistics.org, Office for Research Development and Education, URL https://freestatistics.org/blog/index.php?v=date/2008/Nov/21/t1227269333mezf0ezroikfit6.htm/, Retrieved Mon, 20 May 2024 04:52:10 +0000
Statistical Computations at FreeStatistics.org, Office for Research Development and Education, URL https://freestatistics.org/blog/index.php?pk=25115, Retrieved Mon, 20 May 2024 04:52:10 +0000
QR Codes:

Original text written by user:
IsPrivate?No (this computation is public)
User-defined keywords
Estimated Impact182
Family? (F = Feedback message, R = changed R code, M = changed R Module, P = changed Parameters, D = changed Data)
-     [Multiple Regression] [the Seatbelt Law-Q1] [2008-11-21 10:46:55] [e5d91604aae608e98a8ea24759233f66]
-   PD  [Multiple Regression] [the Seatbelt Law-Q3] [2008-11-21 12:04:38] [e5d91604aae608e98a8ea24759233f66]
F   P       [Multiple Regression] [the Seatbelt Law-...] [2008-11-21 12:07:32] [55ca0ca4a201c9689dcf5fae352c92eb] [Current]
Feedback Forum
2008-11-30 12:30:56 [Koen Van den Heuvel] [reply
  2008-11-30 12:42:14 [Koen Van den Heuvel] [reply
In de je uitleg staat: 'Als we een alpha fout van 5% nemen, kunnen we stellen dat er een significant verschil is en dat we het effect van onze gebeurtenis dus niet aan het toeval kunnen toeschrijven. Mijn besluit is dat het niet toevallig is dat de invoering van de wet een verlaagd indexcijfer tot gevolg heeft. Want de variabele is negatief.'
Om te beoordelen of variabelen een significant effect hebben kan onder andere afgelezen worden van de p-waarden in de tabel 'Multiple Linear Regression - Ordinary Least Squares', kijk ik daar echter naar de p-waarde van de dummy-variabele dan lees ik 0,17 af. Aangezien dit hoger is dan de alpha is er geen reden om aan te nemen dat er een afwijking is van de null-hypothese en zorgt de invoering van de wet niet voor een significante verandering.
De t-test in de kolom ervoor bewijst dit ook. Indien de absolute waarde groter is als 2 dan is er een significant verschil merkbaar. |-1.3913|=1.3913 < 2 dus er is geen significant verschil.

Post a new message
Dataseries X:
99.29	0
98.69	0
107.92	0
101.03	0
97.55	0
103.02	0
94.08	0
94.12	0
115.08	0
116.48	0
103.42	0
112.51	0
95.55	0
97.53	0
119.26	0
100.94	0
97.73	0
115.25	0
92.8	0
99.2	0
118.69	0
110.12	0
110.26	0
112.9	0
102.17	1
99.38	1
116.1	1
103.77	1
101.81	1
113.74	1
89.67	1
99.5	1
122.89	1
108.61	1
114.37	1
110.5	1
104.08	1
103.64	1
121.61	1
101.14	1
115.97	1
120.12	1
95.97	1
105.01	1
124.68	1
123.89	1
123.61	1
114.76	1
108.75	1
106.09	1
123.17	1
106.16	1
115.18	1
120.6	1
109.48	1
114.44	1
121.44	1
129.48	1
124.32	1
112.59	1


Summary of computational transaction
Raw Inputview raw input (R code)
Raw Outputview raw output of R engine
Computing time3 seconds
R Server'George Udny Yule' @ 72.249.76.132

\begin{tabular}{lllllllll}
\hline
Summary of computational transaction \tabularnewline
Raw Input & view raw input (R code)  \tabularnewline
Raw Output & view raw output of R engine  \tabularnewline
Computing time & 3 seconds \tabularnewline
R Server & 'George Udny Yule' @ 72.249.76.132 \tabularnewline
\hline
\end{tabular}
%Source: https://freestatistics.org/blog/index.php?pk=25115&T=0

[TABLE]
[ROW][C]Summary of computational transaction[/C][/ROW]
[ROW][C]Raw Input[/C][C]view raw input (R code) [/C][/ROW]
[ROW][C]Raw Output[/C][C]view raw output of R engine [/C][/ROW]
[ROW][C]Computing time[/C][C]3 seconds[/C][/ROW]
[ROW][C]R Server[/C][C]'George Udny Yule' @ 72.249.76.132[/C][/ROW]
[/TABLE]
Source: https://freestatistics.org/blog/index.php?pk=25115&T=0

Globally Unique Identifier (entire table): ba.freestatistics.org/blog/index.php?pk=25115&T=0

As an alternative you can also use a QR Code:  

The GUIDs for individual cells are displayed in the table below:

Summary of computational transaction
Raw Inputview raw input (R code)
Raw Outputview raw output of R engine
Computing time3 seconds
R Server'George Udny Yule' @ 72.249.76.132


Multiple Linear Regression - Estimated Regression Equation
omzet[t] = + 102.207166666667 -3.04361111111111dummievariabele[t] -6.93452777777782M1[t] -8.1773888888889M2[t] + 8.02775000000002M3[t] -7.3171111111111M4[t] -4.61797222222222M5[t] + 3.93916666666666M6[t] -14.5476944444444M7[t] -8.83455555555555M8[t] + 8.92658333333334M9[t] + 5.74572222222222M10[t] + 2.88486111111111M11[t] + 0.340861111111111t + e[t]

\begin{tabular}{lllllllll}
\hline
Multiple Linear Regression - Estimated Regression Equation \tabularnewline
omzet[t] =  +  102.207166666667 -3.04361111111111dummievariabele[t] -6.93452777777782M1[t] -8.1773888888889M2[t] +  8.02775000000002M3[t] -7.3171111111111M4[t] -4.61797222222222M5[t] +  3.93916666666666M6[t] -14.5476944444444M7[t] -8.83455555555555M8[t] +  8.92658333333334M9[t] +  5.74572222222222M10[t] +  2.88486111111111M11[t] +  0.340861111111111t  + e[t] \tabularnewline
\hline
\end{tabular}
%Source: https://freestatistics.org/blog/index.php?pk=25115&T=1

[TABLE]
[ROW][C]Multiple Linear Regression - Estimated Regression Equation[/C][/ROW]
[ROW][C]omzet[t] =  +  102.207166666667 -3.04361111111111dummievariabele[t] -6.93452777777782M1[t] -8.1773888888889M2[t] +  8.02775000000002M3[t] -7.3171111111111M4[t] -4.61797222222222M5[t] +  3.93916666666666M6[t] -14.5476944444444M7[t] -8.83455555555555M8[t] +  8.92658333333334M9[t] +  5.74572222222222M10[t] +  2.88486111111111M11[t] +  0.340861111111111t  + e[t][/C][/ROW]
[/TABLE]
Source: https://freestatistics.org/blog/index.php?pk=25115&T=1

Globally Unique Identifier (entire table): ba.freestatistics.org/blog/index.php?pk=25115&T=1

As an alternative you can also use a QR Code:  

The GUIDs for individual cells are displayed in the table below:

Multiple Linear Regression - Estimated Regression Equation
omzet[t] = + 102.207166666667 -3.04361111111111dummievariabele[t] -6.93452777777782M1[t] -8.1773888888889M2[t] + 8.02775000000002M3[t] -7.3171111111111M4[t] -4.61797222222222M5[t] + 3.93916666666666M6[t] -14.5476944444444M7[t] -8.83455555555555M8[t] + 8.92658333333334M9[t] + 5.74572222222222M10[t] + 2.88486111111111M11[t] + 0.340861111111111t + e[t]


Multiple Linear Regression - Ordinary Least Squares
VariableParameterS.D.T-STATH0: parameter = 02-tail p-value1-tail p-value
(Intercept)102.2071666666672.27337544.958300
dummievariabele-3.043611111111112.187556-1.39130.1708180.085409
M1-6.934527777777822.71542-2.55380.0140350.007018
M2-8.17738888888892.699956-3.02870.0040190.002009
M38.027750000000022.6858882.98890.0044830.002241
M4-7.31711111111112.673238-2.73720.008780.00439
M5-4.617972222222222.662026-1.73480.089480.04474
M63.939166666666662.6522711.48520.1443110.072155
M7-14.54769444444442.643988-5.50222e-061e-06
M8-8.834555555555552.637192-3.350.0016210.000811
M98.926583333333342.6318953.39170.0014360.000718
M105.745722222222222.6281042.18630.0339220.016961
M112.884861111111112.6258271.09860.2776390.138819
t0.3408611111111110.0631495.39772e-061e-06

\begin{tabular}{lllllllll}
\hline
Multiple Linear Regression - Ordinary Least Squares \tabularnewline
Variable & Parameter & S.D. & T-STATH0: parameter = 0 & 2-tail p-value & 1-tail p-value \tabularnewline
(Intercept) & 102.207166666667 & 2.273375 & 44.9583 & 0 & 0 \tabularnewline
dummievariabele & -3.04361111111111 & 2.187556 & -1.3913 & 0.170818 & 0.085409 \tabularnewline
M1 & -6.93452777777782 & 2.71542 & -2.5538 & 0.014035 & 0.007018 \tabularnewline
M2 & -8.1773888888889 & 2.699956 & -3.0287 & 0.004019 & 0.002009 \tabularnewline
M3 & 8.02775000000002 & 2.685888 & 2.9889 & 0.004483 & 0.002241 \tabularnewline
M4 & -7.3171111111111 & 2.673238 & -2.7372 & 0.00878 & 0.00439 \tabularnewline
M5 & -4.61797222222222 & 2.662026 & -1.7348 & 0.08948 & 0.04474 \tabularnewline
M6 & 3.93916666666666 & 2.652271 & 1.4852 & 0.144311 & 0.072155 \tabularnewline
M7 & -14.5476944444444 & 2.643988 & -5.5022 & 2e-06 & 1e-06 \tabularnewline
M8 & -8.83455555555555 & 2.637192 & -3.35 & 0.001621 & 0.000811 \tabularnewline
M9 & 8.92658333333334 & 2.631895 & 3.3917 & 0.001436 & 0.000718 \tabularnewline
M10 & 5.74572222222222 & 2.628104 & 2.1863 & 0.033922 & 0.016961 \tabularnewline
M11 & 2.88486111111111 & 2.625827 & 1.0986 & 0.277639 & 0.138819 \tabularnewline
t & 0.340861111111111 & 0.063149 & 5.3977 & 2e-06 & 1e-06 \tabularnewline
\hline
\end{tabular}
%Source: https://freestatistics.org/blog/index.php?pk=25115&T=2

[TABLE]
[ROW][C]Multiple Linear Regression - Ordinary Least Squares[/C][/ROW]
[ROW][C]Variable[/C][C]Parameter[/C][C]S.D.[/C][C]T-STATH0: parameter = 0[/C][C]2-tail p-value[/C][C]1-tail p-value[/C][/ROW]
[ROW][C](Intercept)[/C][C]102.207166666667[/C][C]2.273375[/C][C]44.9583[/C][C]0[/C][C]0[/C][/ROW]
[ROW][C]dummievariabele[/C][C]-3.04361111111111[/C][C]2.187556[/C][C]-1.3913[/C][C]0.170818[/C][C]0.085409[/C][/ROW]
[ROW][C]M1[/C][C]-6.93452777777782[/C][C]2.71542[/C][C]-2.5538[/C][C]0.014035[/C][C]0.007018[/C][/ROW]
[ROW][C]M2[/C][C]-8.1773888888889[/C][C]2.699956[/C][C]-3.0287[/C][C]0.004019[/C][C]0.002009[/C][/ROW]
[ROW][C]M3[/C][C]8.02775000000002[/C][C]2.685888[/C][C]2.9889[/C][C]0.004483[/C][C]0.002241[/C][/ROW]
[ROW][C]M4[/C][C]-7.3171111111111[/C][C]2.673238[/C][C]-2.7372[/C][C]0.00878[/C][C]0.00439[/C][/ROW]
[ROW][C]M5[/C][C]-4.61797222222222[/C][C]2.662026[/C][C]-1.7348[/C][C]0.08948[/C][C]0.04474[/C][/ROW]
[ROW][C]M6[/C][C]3.93916666666666[/C][C]2.652271[/C][C]1.4852[/C][C]0.144311[/C][C]0.072155[/C][/ROW]
[ROW][C]M7[/C][C]-14.5476944444444[/C][C]2.643988[/C][C]-5.5022[/C][C]2e-06[/C][C]1e-06[/C][/ROW]
[ROW][C]M8[/C][C]-8.83455555555555[/C][C]2.637192[/C][C]-3.35[/C][C]0.001621[/C][C]0.000811[/C][/ROW]
[ROW][C]M9[/C][C]8.92658333333334[/C][C]2.631895[/C][C]3.3917[/C][C]0.001436[/C][C]0.000718[/C][/ROW]
[ROW][C]M10[/C][C]5.74572222222222[/C][C]2.628104[/C][C]2.1863[/C][C]0.033922[/C][C]0.016961[/C][/ROW]
[ROW][C]M11[/C][C]2.88486111111111[/C][C]2.625827[/C][C]1.0986[/C][C]0.277639[/C][C]0.138819[/C][/ROW]
[ROW][C]t[/C][C]0.340861111111111[/C][C]0.063149[/C][C]5.3977[/C][C]2e-06[/C][C]1e-06[/C][/ROW]
[/TABLE]
Source: https://freestatistics.org/blog/index.php?pk=25115&T=2

Globally Unique Identifier (entire table): ba.freestatistics.org/blog/index.php?pk=25115&T=2

As an alternative you can also use a QR Code:  

The GUIDs for individual cells are displayed in the table below:

Multiple Linear Regression - Ordinary Least Squares
VariableParameterS.D.T-STATH0: parameter = 02-tail p-value1-tail p-value
(Intercept)102.2071666666672.27337544.958300
dummievariabele-3.043611111111112.187556-1.39130.1708180.085409
M1-6.934527777777822.71542-2.55380.0140350.007018
M2-8.17738888888892.699956-3.02870.0040190.002009
M38.027750000000022.6858882.98890.0044830.002241
M4-7.31711111111112.673238-2.73720.008780.00439
M5-4.617972222222222.662026-1.73480.089480.04474
M63.939166666666662.6522711.48520.1443110.072155
M7-14.54769444444442.643988-5.50222e-061e-06
M8-8.834555555555552.637192-3.350.0016210.000811
M98.926583333333342.6318953.39170.0014360.000718
M105.745722222222222.6281042.18630.0339220.016961
M112.884861111111112.6258271.09860.2776390.138819
t0.3408611111111110.0631495.39772e-061e-06


Multiple Linear Regression - Regression Statistics
Multiple R0.927865011933247
R-squared0.860933480369885
Adjusted R-squared0.821632072648331
F-TEST (value)21.9059196675472
F-TEST (DF numerator)13
F-TEST (DF denominator)46
p-value1.99840144432528e-15
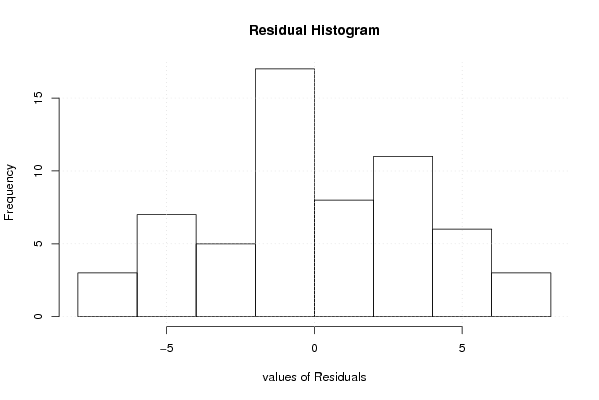
Multiple Linear Regression - Residual Statistics
Residual Standard Deviation4.15059599061323
Sum Squared Residuals792.462565555554

\begin{tabular}{lllllllll}
\hline
Multiple Linear Regression - Regression Statistics \tabularnewline
Multiple R & 0.927865011933247 \tabularnewline
R-squared & 0.860933480369885 \tabularnewline
Adjusted R-squared & 0.821632072648331 \tabularnewline
F-TEST (value) & 21.9059196675472 \tabularnewline
F-TEST (DF numerator) & 13 \tabularnewline
F-TEST (DF denominator) & 46 \tabularnewline
p-value & 1.99840144432528e-15 \tabularnewline
Multiple Linear Regression - Residual Statistics \tabularnewline
Residual Standard Deviation & 4.15059599061323 \tabularnewline
Sum Squared Residuals & 792.462565555554 \tabularnewline
\hline
\end{tabular}
%Source: https://freestatistics.org/blog/index.php?pk=25115&T=3

[TABLE]
[ROW][C]Multiple Linear Regression - Regression Statistics[/C][/ROW]
[ROW][C]Multiple R[/C][C]0.927865011933247[/C][/ROW]
[ROW][C]R-squared[/C][C]0.860933480369885[/C][/ROW]
[ROW][C]Adjusted R-squared[/C][C]0.821632072648331[/C][/ROW]
[ROW][C]F-TEST (value)[/C][C]21.9059196675472[/C][/ROW]
[ROW][C]F-TEST (DF numerator)[/C][C]13[/C][/ROW]
[ROW][C]F-TEST (DF denominator)[/C][C]46[/C][/ROW]
[ROW][C]p-value[/C][C]1.99840144432528e-15[/C][/ROW]
[ROW][C]Multiple Linear Regression - Residual Statistics[/C][/ROW]
[ROW][C]Residual Standard Deviation[/C][C]4.15059599061323[/C][/ROW]
[ROW][C]Sum Squared Residuals[/C][C]792.462565555554[/C][/ROW]
[/TABLE]
Source: https://freestatistics.org/blog/index.php?pk=25115&T=3

Globally Unique Identifier (entire table): ba.freestatistics.org/blog/index.php?pk=25115&T=3

As an alternative you can also use a QR Code:  

The GUIDs for individual cells are displayed in the table below:

Multiple Linear Regression - Regression Statistics
Multiple R0.927865011933247
R-squared0.860933480369885
Adjusted R-squared0.821632072648331
F-TEST (value)21.9059196675472
F-TEST (DF numerator)13
F-TEST (DF denominator)46
p-value1.99840144432528e-15
Multiple Linear Regression - Residual Statistics
Residual Standard Deviation4.15059599061323
Sum Squared Residuals792.462565555554


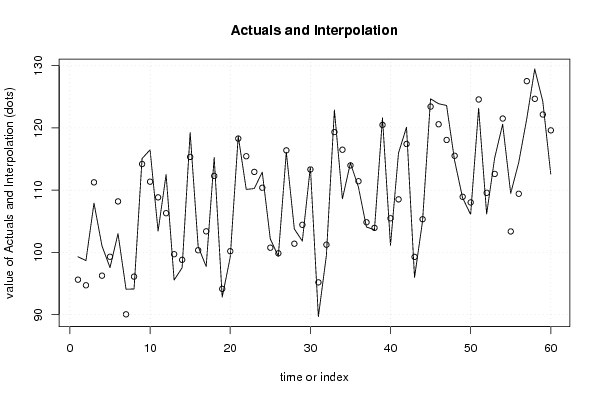
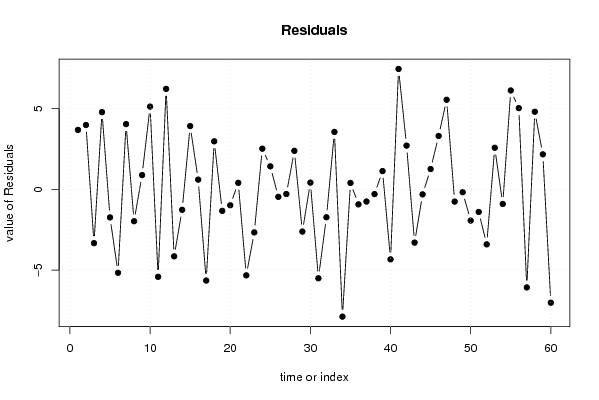
Multiple Linear Regression - Actuals, Interpolation, and Residuals
Time or IndexActualsInterpolationForecastResidualsPrediction Error
199.2995.61350000000023.67649999999981
298.6994.71153.97850000000001
3107.92111.2575-3.33749999999999
4101.0396.25354.77650000000004
597.5599.2935-1.74350000000002
6103.02108.1915-5.1715
794.0890.04554.0345
894.1296.0995-1.97949999999998
9115.08114.20150.878500000000005
10116.48111.36155.1185
11103.42108.8415-5.4215
12112.51106.29756.21250000000002
1395.5599.7038333333333-4.15383333333329
1497.5398.8018333333333-1.27183333333334
15119.26115.3478333333333.91216666666667
16100.94100.3438333333330.596166666666658
1797.73103.383833333333-5.65383333333332
18115.25112.2818333333332.96816666666667
1992.894.1358333333333-1.33583333333333
2099.2100.189833333333-0.98983333333333
21118.69118.2918333333330.39816666666667
22110.12115.451833333333-5.33183333333332
23110.26112.931833333333-2.67183333333332
24112.9110.3878333333332.51216666666667
25102.17100.7505555555561.41944444444450
2699.3899.8485555555555-0.468555555555560
27116.1116.394555555556-0.294555555555559
28103.77101.3905555555562.37944444444443
29101.81104.430555555556-2.62055555555555
30113.74113.3285555555560.411444444444442
3189.6795.1825555555556-5.51255555555555
3299.5101.236555555556-1.73655555555556
33122.89119.3385555555563.55144444444445
34108.61116.498555555556-7.88855555555555
35114.37113.9785555555560.391444444444453
36110.5111.434555555556-0.934555555555555
37104.08104.840888888889-0.760888888888846
38103.64103.938888888889-0.298888888888893
39121.61120.4848888888891.12511111111111
40101.14105.480888888889-4.3408888888889
41115.97108.5208888888897.44911111111111
42120.12117.4188888888892.70111111111111
4395.9799.2728888888889-3.30288888888889
44105.01105.326888888889-0.316888888888894
45124.68123.4288888888891.25111111111112
46123.89120.5888888888893.30111111111111
47123.61118.0688888888895.5411111111111
48114.76115.524888888889-0.764888888888888
49108.75108.931222222222-0.181222222222181
50106.09108.029222222222-1.93922222222223
51123.17124.575222222222-1.40522222222223
52106.16109.571222222222-3.41122222222224
53115.18112.6112222222222.56877777777778
54120.6121.509222222222-0.909222222222235
55109.48103.3632222222226.11677777777777
56114.44109.4172222222225.02277777777776
57121.44127.519222222222-6.07922222222223
58129.48124.6792222222224.80077777777776
59124.32122.1592222222222.16077777777776
60112.59119.615222222222-7.02522222222223

\begin{tabular}{lllllllll}
\hline
Multiple Linear Regression - Actuals, Interpolation, and Residuals \tabularnewline
Time or Index & Actuals & InterpolationForecast & ResidualsPrediction Error \tabularnewline
1 & 99.29 & 95.6135000000002 & 3.67649999999981 \tabularnewline
2 & 98.69 & 94.7115 & 3.97850000000001 \tabularnewline
3 & 107.92 & 111.2575 & -3.33749999999999 \tabularnewline
4 & 101.03 & 96.2535 & 4.77650000000004 \tabularnewline
5 & 97.55 & 99.2935 & -1.74350000000002 \tabularnewline
6 & 103.02 & 108.1915 & -5.1715 \tabularnewline
7 & 94.08 & 90.0455 & 4.0345 \tabularnewline
8 & 94.12 & 96.0995 & -1.97949999999998 \tabularnewline
9 & 115.08 & 114.2015 & 0.878500000000005 \tabularnewline
10 & 116.48 & 111.3615 & 5.1185 \tabularnewline
11 & 103.42 & 108.8415 & -5.4215 \tabularnewline
12 & 112.51 & 106.2975 & 6.21250000000002 \tabularnewline
13 & 95.55 & 99.7038333333333 & -4.15383333333329 \tabularnewline
14 & 97.53 & 98.8018333333333 & -1.27183333333334 \tabularnewline
15 & 119.26 & 115.347833333333 & 3.91216666666667 \tabularnewline
16 & 100.94 & 100.343833333333 & 0.596166666666658 \tabularnewline
17 & 97.73 & 103.383833333333 & -5.65383333333332 \tabularnewline
18 & 115.25 & 112.281833333333 & 2.96816666666667 \tabularnewline
19 & 92.8 & 94.1358333333333 & -1.33583333333333 \tabularnewline
20 & 99.2 & 100.189833333333 & -0.98983333333333 \tabularnewline
21 & 118.69 & 118.291833333333 & 0.39816666666667 \tabularnewline
22 & 110.12 & 115.451833333333 & -5.33183333333332 \tabularnewline
23 & 110.26 & 112.931833333333 & -2.67183333333332 \tabularnewline
24 & 112.9 & 110.387833333333 & 2.51216666666667 \tabularnewline
25 & 102.17 & 100.750555555556 & 1.41944444444450 \tabularnewline
26 & 99.38 & 99.8485555555555 & -0.468555555555560 \tabularnewline
27 & 116.1 & 116.394555555556 & -0.294555555555559 \tabularnewline
28 & 103.77 & 101.390555555556 & 2.37944444444443 \tabularnewline
29 & 101.81 & 104.430555555556 & -2.62055555555555 \tabularnewline
30 & 113.74 & 113.328555555556 & 0.411444444444442 \tabularnewline
31 & 89.67 & 95.1825555555556 & -5.51255555555555 \tabularnewline
32 & 99.5 & 101.236555555556 & -1.73655555555556 \tabularnewline
33 & 122.89 & 119.338555555556 & 3.55144444444445 \tabularnewline
34 & 108.61 & 116.498555555556 & -7.88855555555555 \tabularnewline
35 & 114.37 & 113.978555555556 & 0.391444444444453 \tabularnewline
36 & 110.5 & 111.434555555556 & -0.934555555555555 \tabularnewline
37 & 104.08 & 104.840888888889 & -0.760888888888846 \tabularnewline
38 & 103.64 & 103.938888888889 & -0.298888888888893 \tabularnewline
39 & 121.61 & 120.484888888889 & 1.12511111111111 \tabularnewline
40 & 101.14 & 105.480888888889 & -4.3408888888889 \tabularnewline
41 & 115.97 & 108.520888888889 & 7.44911111111111 \tabularnewline
42 & 120.12 & 117.418888888889 & 2.70111111111111 \tabularnewline
43 & 95.97 & 99.2728888888889 & -3.30288888888889 \tabularnewline
44 & 105.01 & 105.326888888889 & -0.316888888888894 \tabularnewline
45 & 124.68 & 123.428888888889 & 1.25111111111112 \tabularnewline
46 & 123.89 & 120.588888888889 & 3.30111111111111 \tabularnewline
47 & 123.61 & 118.068888888889 & 5.5411111111111 \tabularnewline
48 & 114.76 & 115.524888888889 & -0.764888888888888 \tabularnewline
49 & 108.75 & 108.931222222222 & -0.181222222222181 \tabularnewline
50 & 106.09 & 108.029222222222 & -1.93922222222223 \tabularnewline
51 & 123.17 & 124.575222222222 & -1.40522222222223 \tabularnewline
52 & 106.16 & 109.571222222222 & -3.41122222222224 \tabularnewline
53 & 115.18 & 112.611222222222 & 2.56877777777778 \tabularnewline
54 & 120.6 & 121.509222222222 & -0.909222222222235 \tabularnewline
55 & 109.48 & 103.363222222222 & 6.11677777777777 \tabularnewline
56 & 114.44 & 109.417222222222 & 5.02277777777776 \tabularnewline
57 & 121.44 & 127.519222222222 & -6.07922222222223 \tabularnewline
58 & 129.48 & 124.679222222222 & 4.80077777777776 \tabularnewline
59 & 124.32 & 122.159222222222 & 2.16077777777776 \tabularnewline
60 & 112.59 & 119.615222222222 & -7.02522222222223 \tabularnewline
\hline
\end{tabular}
%Source: https://freestatistics.org/blog/index.php?pk=25115&T=4

[TABLE]
[ROW][C]Multiple Linear Regression - Actuals, Interpolation, and Residuals[/C][/ROW]
[ROW][C]Time or Index[/C][C]Actuals[/C][C]InterpolationForecast[/C][C]ResidualsPrediction Error[/C][/ROW]
[ROW][C]1[/C][C]99.29[/C][C]95.6135000000002[/C][C]3.67649999999981[/C][/ROW]
[ROW][C]2[/C][C]98.69[/C][C]94.7115[/C][C]3.97850000000001[/C][/ROW]
[ROW][C]3[/C][C]107.92[/C][C]111.2575[/C][C]-3.33749999999999[/C][/ROW]
[ROW][C]4[/C][C]101.03[/C][C]96.2535[/C][C]4.77650000000004[/C][/ROW]
[ROW][C]5[/C][C]97.55[/C][C]99.2935[/C][C]-1.74350000000002[/C][/ROW]
[ROW][C]6[/C][C]103.02[/C][C]108.1915[/C][C]-5.1715[/C][/ROW]
[ROW][C]7[/C][C]94.08[/C][C]90.0455[/C][C]4.0345[/C][/ROW]
[ROW][C]8[/C][C]94.12[/C][C]96.0995[/C][C]-1.97949999999998[/C][/ROW]
[ROW][C]9[/C][C]115.08[/C][C]114.2015[/C][C]0.878500000000005[/C][/ROW]
[ROW][C]10[/C][C]116.48[/C][C]111.3615[/C][C]5.1185[/C][/ROW]
[ROW][C]11[/C][C]103.42[/C][C]108.8415[/C][C]-5.4215[/C][/ROW]
[ROW][C]12[/C][C]112.51[/C][C]106.2975[/C][C]6.21250000000002[/C][/ROW]
[ROW][C]13[/C][C]95.55[/C][C]99.7038333333333[/C][C]-4.15383333333329[/C][/ROW]
[ROW][C]14[/C][C]97.53[/C][C]98.8018333333333[/C][C]-1.27183333333334[/C][/ROW]
[ROW][C]15[/C][C]119.26[/C][C]115.347833333333[/C][C]3.91216666666667[/C][/ROW]
[ROW][C]16[/C][C]100.94[/C][C]100.343833333333[/C][C]0.596166666666658[/C][/ROW]
[ROW][C]17[/C][C]97.73[/C][C]103.383833333333[/C][C]-5.65383333333332[/C][/ROW]
[ROW][C]18[/C][C]115.25[/C][C]112.281833333333[/C][C]2.96816666666667[/C][/ROW]
[ROW][C]19[/C][C]92.8[/C][C]94.1358333333333[/C][C]-1.33583333333333[/C][/ROW]
[ROW][C]20[/C][C]99.2[/C][C]100.189833333333[/C][C]-0.98983333333333[/C][/ROW]
[ROW][C]21[/C][C]118.69[/C][C]118.291833333333[/C][C]0.39816666666667[/C][/ROW]
[ROW][C]22[/C][C]110.12[/C][C]115.451833333333[/C][C]-5.33183333333332[/C][/ROW]
[ROW][C]23[/C][C]110.26[/C][C]112.931833333333[/C][C]-2.67183333333332[/C][/ROW]
[ROW][C]24[/C][C]112.9[/C][C]110.387833333333[/C][C]2.51216666666667[/C][/ROW]
[ROW][C]25[/C][C]102.17[/C][C]100.750555555556[/C][C]1.41944444444450[/C][/ROW]
[ROW][C]26[/C][C]99.38[/C][C]99.8485555555555[/C][C]-0.468555555555560[/C][/ROW]
[ROW][C]27[/C][C]116.1[/C][C]116.394555555556[/C][C]-0.294555555555559[/C][/ROW]
[ROW][C]28[/C][C]103.77[/C][C]101.390555555556[/C][C]2.37944444444443[/C][/ROW]
[ROW][C]29[/C][C]101.81[/C][C]104.430555555556[/C][C]-2.62055555555555[/C][/ROW]
[ROW][C]30[/C][C]113.74[/C][C]113.328555555556[/C][C]0.411444444444442[/C][/ROW]
[ROW][C]31[/C][C]89.67[/C][C]95.1825555555556[/C][C]-5.51255555555555[/C][/ROW]
[ROW][C]32[/C][C]99.5[/C][C]101.236555555556[/C][C]-1.73655555555556[/C][/ROW]
[ROW][C]33[/C][C]122.89[/C][C]119.338555555556[/C][C]3.55144444444445[/C][/ROW]
[ROW][C]34[/C][C]108.61[/C][C]116.498555555556[/C][C]-7.88855555555555[/C][/ROW]
[ROW][C]35[/C][C]114.37[/C][C]113.978555555556[/C][C]0.391444444444453[/C][/ROW]
[ROW][C]36[/C][C]110.5[/C][C]111.434555555556[/C][C]-0.934555555555555[/C][/ROW]
[ROW][C]37[/C][C]104.08[/C][C]104.840888888889[/C][C]-0.760888888888846[/C][/ROW]
[ROW][C]38[/C][C]103.64[/C][C]103.938888888889[/C][C]-0.298888888888893[/C][/ROW]
[ROW][C]39[/C][C]121.61[/C][C]120.484888888889[/C][C]1.12511111111111[/C][/ROW]
[ROW][C]40[/C][C]101.14[/C][C]105.480888888889[/C][C]-4.3408888888889[/C][/ROW]
[ROW][C]41[/C][C]115.97[/C][C]108.520888888889[/C][C]7.44911111111111[/C][/ROW]
[ROW][C]42[/C][C]120.12[/C][C]117.418888888889[/C][C]2.70111111111111[/C][/ROW]
[ROW][C]43[/C][C]95.97[/C][C]99.2728888888889[/C][C]-3.30288888888889[/C][/ROW]
[ROW][C]44[/C][C]105.01[/C][C]105.326888888889[/C][C]-0.316888888888894[/C][/ROW]
[ROW][C]45[/C][C]124.68[/C][C]123.428888888889[/C][C]1.25111111111112[/C][/ROW]
[ROW][C]46[/C][C]123.89[/C][C]120.588888888889[/C][C]3.30111111111111[/C][/ROW]
[ROW][C]47[/C][C]123.61[/C][C]118.068888888889[/C][C]5.5411111111111[/C][/ROW]
[ROW][C]48[/C][C]114.76[/C][C]115.524888888889[/C][C]-0.764888888888888[/C][/ROW]
[ROW][C]49[/C][C]108.75[/C][C]108.931222222222[/C][C]-0.181222222222181[/C][/ROW]
[ROW][C]50[/C][C]106.09[/C][C]108.029222222222[/C][C]-1.93922222222223[/C][/ROW]
[ROW][C]51[/C][C]123.17[/C][C]124.575222222222[/C][C]-1.40522222222223[/C][/ROW]
[ROW][C]52[/C][C]106.16[/C][C]109.571222222222[/C][C]-3.41122222222224[/C][/ROW]
[ROW][C]53[/C][C]115.18[/C][C]112.611222222222[/C][C]2.56877777777778[/C][/ROW]
[ROW][C]54[/C][C]120.6[/C][C]121.509222222222[/C][C]-0.909222222222235[/C][/ROW]
[ROW][C]55[/C][C]109.48[/C][C]103.363222222222[/C][C]6.11677777777777[/C][/ROW]
[ROW][C]56[/C][C]114.44[/C][C]109.417222222222[/C][C]5.02277777777776[/C][/ROW]
[ROW][C]57[/C][C]121.44[/C][C]127.519222222222[/C][C]-6.07922222222223[/C][/ROW]
[ROW][C]58[/C][C]129.48[/C][C]124.679222222222[/C][C]4.80077777777776[/C][/ROW]
[ROW][C]59[/C][C]124.32[/C][C]122.159222222222[/C][C]2.16077777777776[/C][/ROW]
[ROW][C]60[/C][C]112.59[/C][C]119.615222222222[/C][C]-7.02522222222223[/C][/ROW]
[/TABLE]
Source: https://freestatistics.org/blog/index.php?pk=25115&T=4

Globally Unique Identifier (entire table): ba.freestatistics.org/blog/index.php?pk=25115&T=4

As an alternative you can also use a QR Code:  

The GUIDs for individual cells are displayed in the table below:

Multiple Linear Regression - Actuals, Interpolation, and Residuals
Time or IndexActualsInterpolationForecastResidualsPrediction Error
199.2995.61350000000023.67649999999981
298.6994.71153.97850000000001
3107.92111.2575-3.33749999999999
4101.0396.25354.77650000000004
597.5599.2935-1.74350000000002
6103.02108.1915-5.1715
794.0890.04554.0345
894.1296.0995-1.97949999999998
9115.08114.20150.878500000000005
10116.48111.36155.1185
11103.42108.8415-5.4215
12112.51106.29756.21250000000002
1395.5599.7038333333333-4.15383333333329
1497.5398.8018333333333-1.27183333333334
15119.26115.3478333333333.91216666666667
16100.94100.3438333333330.596166666666658
1797.73103.383833333333-5.65383333333332
18115.25112.2818333333332.96816666666667
1992.894.1358333333333-1.33583333333333
2099.2100.189833333333-0.98983333333333
21118.69118.2918333333330.39816666666667
22110.12115.451833333333-5.33183333333332
23110.26112.931833333333-2.67183333333332
24112.9110.3878333333332.51216666666667
25102.17100.7505555555561.41944444444450
2699.3899.8485555555555-0.468555555555560
27116.1116.394555555556-0.294555555555559
28103.77101.3905555555562.37944444444443
29101.81104.430555555556-2.62055555555555
30113.74113.3285555555560.411444444444442
3189.6795.1825555555556-5.51255555555555
3299.5101.236555555556-1.73655555555556
33122.89119.3385555555563.55144444444445
34108.61116.498555555556-7.88855555555555
35114.37113.9785555555560.391444444444453
36110.5111.434555555556-0.934555555555555
37104.08104.840888888889-0.760888888888846
38103.64103.938888888889-0.298888888888893
39121.61120.4848888888891.12511111111111
40101.14105.480888888889-4.3408888888889
41115.97108.5208888888897.44911111111111
42120.12117.4188888888892.70111111111111
4395.9799.2728888888889-3.30288888888889
44105.01105.326888888889-0.316888888888894
45124.68123.4288888888891.25111111111112
46123.89120.5888888888893.30111111111111
47123.61118.0688888888895.5411111111111
48114.76115.524888888889-0.764888888888888
49108.75108.931222222222-0.181222222222181
50106.09108.029222222222-1.93922222222223
51123.17124.575222222222-1.40522222222223
52106.16109.571222222222-3.41122222222224
53115.18112.6112222222222.56877777777778
54120.6121.509222222222-0.909222222222235
55109.48103.3632222222226.11677777777777
56114.44109.4172222222225.02277777777776
57121.44127.519222222222-6.07922222222223
58129.48124.6792222222224.80077777777776
59124.32122.1592222222222.16077777777776
60112.59119.615222222222-7.02522222222223


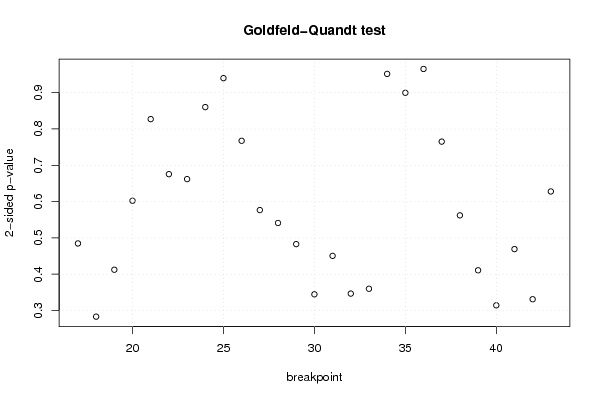
Goldfeld-Quandt test for Heteroskedasticity
p-valuesAlternative Hypothesis
breakpoint indexgreater2-sidedless
170.7576275771554880.4847448456890230.242372422844512
180.8584606243141380.2830787513717230.141539375685861
190.7938527874784580.4122944250430840.206147212521542
200.6988033134616760.6023933730766480.301196686538324
210.5864338352279430.8271323295441140.413566164772057
220.662216617480480.675566765039040.33778338251952
230.6690037227455230.6619925545089550.330996277254477
240.5698444332649450.860311133470110.430155566735055
250.4700144816900580.9400289633801160.529985518309942
260.3837635189472940.7675270378945880.616236481052706
270.288350187229680.576700374459360.71164981277032
280.2705645366014020.5411290732028040.729435463398598
290.2414400524630290.4828801049260570.758559947536971
300.1723148198047120.3446296396094240.827685180195288
310.2252771340500880.4505542681001760.774722865949912
320.1733035256866020.3466070513732040.826696474313398
330.1799730123245580.3599460246491160.820026987675442
340.5241092573857550.951781485228490.475890742614245
350.5501475960392590.8997048079214830.449852403960741
360.4827008596721840.9654017193443670.517299140327816
370.3826028294662750.765205658932550.617397170533725
380.2810463408849920.5620926817699840.718953659115008
390.2054016761453150.410803352290630.794598323854685
400.1571460768443210.3142921536886410.84285392315568
410.2346010446961820.4692020893923630.765398955303818
420.1655182051327210.3310364102654430.834481794867279
430.3139634979408480.6279269958816960.686036502059152

\begin{tabular}{lllllllll}
\hline
Goldfeld-Quandt test for Heteroskedasticity \tabularnewline
p-values & Alternative Hypothesis \tabularnewline
breakpoint index & greater & 2-sided & less \tabularnewline
17 & 0.757627577155488 & 0.484744845689023 & 0.242372422844512 \tabularnewline
18 & 0.858460624314138 & 0.283078751371723 & 0.141539375685861 \tabularnewline
19 & 0.793852787478458 & 0.412294425043084 & 0.206147212521542 \tabularnewline
20 & 0.698803313461676 & 0.602393373076648 & 0.301196686538324 \tabularnewline
21 & 0.586433835227943 & 0.827132329544114 & 0.413566164772057 \tabularnewline
22 & 0.66221661748048 & 0.67556676503904 & 0.33778338251952 \tabularnewline
23 & 0.669003722745523 & 0.661992554508955 & 0.330996277254477 \tabularnewline
24 & 0.569844433264945 & 0.86031113347011 & 0.430155566735055 \tabularnewline
25 & 0.470014481690058 & 0.940028963380116 & 0.529985518309942 \tabularnewline
26 & 0.383763518947294 & 0.767527037894588 & 0.616236481052706 \tabularnewline
27 & 0.28835018722968 & 0.57670037445936 & 0.71164981277032 \tabularnewline
28 & 0.270564536601402 & 0.541129073202804 & 0.729435463398598 \tabularnewline
29 & 0.241440052463029 & 0.482880104926057 & 0.758559947536971 \tabularnewline
30 & 0.172314819804712 & 0.344629639609424 & 0.827685180195288 \tabularnewline
31 & 0.225277134050088 & 0.450554268100176 & 0.774722865949912 \tabularnewline
32 & 0.173303525686602 & 0.346607051373204 & 0.826696474313398 \tabularnewline
33 & 0.179973012324558 & 0.359946024649116 & 0.820026987675442 \tabularnewline
34 & 0.524109257385755 & 0.95178148522849 & 0.475890742614245 \tabularnewline
35 & 0.550147596039259 & 0.899704807921483 & 0.449852403960741 \tabularnewline
36 & 0.482700859672184 & 0.965401719344367 & 0.517299140327816 \tabularnewline
37 & 0.382602829466275 & 0.76520565893255 & 0.617397170533725 \tabularnewline
38 & 0.281046340884992 & 0.562092681769984 & 0.718953659115008 \tabularnewline
39 & 0.205401676145315 & 0.41080335229063 & 0.794598323854685 \tabularnewline
40 & 0.157146076844321 & 0.314292153688641 & 0.84285392315568 \tabularnewline
41 & 0.234601044696182 & 0.469202089392363 & 0.765398955303818 \tabularnewline
42 & 0.165518205132721 & 0.331036410265443 & 0.834481794867279 \tabularnewline
43 & 0.313963497940848 & 0.627926995881696 & 0.686036502059152 \tabularnewline
\hline
\end{tabular}
%Source: https://freestatistics.org/blog/index.php?pk=25115&T=5

[TABLE]
[ROW][C]Goldfeld-Quandt test for Heteroskedasticity[/C][/ROW]
[ROW][C]p-values[/C][C]Alternative Hypothesis[/C][/ROW]
[ROW][C]breakpoint index[/C][C]greater[/C][C]2-sided[/C][C]less[/C][/ROW]
[ROW][C]17[/C][C]0.757627577155488[/C][C]0.484744845689023[/C][C]0.242372422844512[/C][/ROW]
[ROW][C]18[/C][C]0.858460624314138[/C][C]0.283078751371723[/C][C]0.141539375685861[/C][/ROW]
[ROW][C]19[/C][C]0.793852787478458[/C][C]0.412294425043084[/C][C]0.206147212521542[/C][/ROW]
[ROW][C]20[/C][C]0.698803313461676[/C][C]0.602393373076648[/C][C]0.301196686538324[/C][/ROW]
[ROW][C]21[/C][C]0.586433835227943[/C][C]0.827132329544114[/C][C]0.413566164772057[/C][/ROW]
[ROW][C]22[/C][C]0.66221661748048[/C][C]0.67556676503904[/C][C]0.33778338251952[/C][/ROW]
[ROW][C]23[/C][C]0.669003722745523[/C][C]0.661992554508955[/C][C]0.330996277254477[/C][/ROW]
[ROW][C]24[/C][C]0.569844433264945[/C][C]0.86031113347011[/C][C]0.430155566735055[/C][/ROW]
[ROW][C]25[/C][C]0.470014481690058[/C][C]0.940028963380116[/C][C]0.529985518309942[/C][/ROW]
[ROW][C]26[/C][C]0.383763518947294[/C][C]0.767527037894588[/C][C]0.616236481052706[/C][/ROW]
[ROW][C]27[/C][C]0.28835018722968[/C][C]0.57670037445936[/C][C]0.71164981277032[/C][/ROW]
[ROW][C]28[/C][C]0.270564536601402[/C][C]0.541129073202804[/C][C]0.729435463398598[/C][/ROW]
[ROW][C]29[/C][C]0.241440052463029[/C][C]0.482880104926057[/C][C]0.758559947536971[/C][/ROW]
[ROW][C]30[/C][C]0.172314819804712[/C][C]0.344629639609424[/C][C]0.827685180195288[/C][/ROW]
[ROW][C]31[/C][C]0.225277134050088[/C][C]0.450554268100176[/C][C]0.774722865949912[/C][/ROW]
[ROW][C]32[/C][C]0.173303525686602[/C][C]0.346607051373204[/C][C]0.826696474313398[/C][/ROW]
[ROW][C]33[/C][C]0.179973012324558[/C][C]0.359946024649116[/C][C]0.820026987675442[/C][/ROW]
[ROW][C]34[/C][C]0.524109257385755[/C][C]0.95178148522849[/C][C]0.475890742614245[/C][/ROW]
[ROW][C]35[/C][C]0.550147596039259[/C][C]0.899704807921483[/C][C]0.449852403960741[/C][/ROW]
[ROW][C]36[/C][C]0.482700859672184[/C][C]0.965401719344367[/C][C]0.517299140327816[/C][/ROW]
[ROW][C]37[/C][C]0.382602829466275[/C][C]0.76520565893255[/C][C]0.617397170533725[/C][/ROW]
[ROW][C]38[/C][C]0.281046340884992[/C][C]0.562092681769984[/C][C]0.718953659115008[/C][/ROW]
[ROW][C]39[/C][C]0.205401676145315[/C][C]0.41080335229063[/C][C]0.794598323854685[/C][/ROW]
[ROW][C]40[/C][C]0.157146076844321[/C][C]0.314292153688641[/C][C]0.84285392315568[/C][/ROW]
[ROW][C]41[/C][C]0.234601044696182[/C][C]0.469202089392363[/C][C]0.765398955303818[/C][/ROW]
[ROW][C]42[/C][C]0.165518205132721[/C][C]0.331036410265443[/C][C]0.834481794867279[/C][/ROW]
[ROW][C]43[/C][C]0.313963497940848[/C][C]0.627926995881696[/C][C]0.686036502059152[/C][/ROW]
[/TABLE]
Source: https://freestatistics.org/blog/index.php?pk=25115&T=5

Globally Unique Identifier (entire table): ba.freestatistics.org/blog/index.php?pk=25115&T=5

As an alternative you can also use a QR Code:  

The GUIDs for individual cells are displayed in the table below:

Goldfeld-Quandt test for Heteroskedasticity
p-valuesAlternative Hypothesis
breakpoint indexgreater2-sidedless
170.7576275771554880.4847448456890230.242372422844512
180.8584606243141380.2830787513717230.141539375685861
190.7938527874784580.4122944250430840.206147212521542
200.6988033134616760.6023933730766480.301196686538324
210.5864338352279430.8271323295441140.413566164772057
220.662216617480480.675566765039040.33778338251952
230.6690037227455230.6619925545089550.330996277254477
240.5698444332649450.860311133470110.430155566735055
250.4700144816900580.9400289633801160.529985518309942
260.3837635189472940.7675270378945880.616236481052706
270.288350187229680.576700374459360.71164981277032
280.2705645366014020.5411290732028040.729435463398598
290.2414400524630290.4828801049260570.758559947536971
300.1723148198047120.3446296396094240.827685180195288
310.2252771340500880.4505542681001760.774722865949912
320.1733035256866020.3466070513732040.826696474313398
330.1799730123245580.3599460246491160.820026987675442
340.5241092573857550.951781485228490.475890742614245
350.5501475960392590.8997048079214830.449852403960741
360.4827008596721840.9654017193443670.517299140327816
370.3826028294662750.765205658932550.617397170533725
380.2810463408849920.5620926817699840.718953659115008
390.2054016761453150.410803352290630.794598323854685
400.1571460768443210.3142921536886410.84285392315568
410.2346010446961820.4692020893923630.765398955303818
420.1655182051327210.3310364102654430.834481794867279
430.3139634979408480.6279269958816960.686036502059152


Meta Analysis of Goldfeld-Quandt test for Heteroskedasticity
Description# significant tests% significant testsOK/NOK
1% type I error level00OK
5% type I error level00OK
10% type I error level00OK

\begin{tabular}{lllllllll}
\hline
Meta Analysis of Goldfeld-Quandt test for Heteroskedasticity \tabularnewline
Description & # significant tests & % significant tests & OK/NOK \tabularnewline
1% type I error level & 0 & 0 & OK \tabularnewline
5% type I error level & 0 & 0 & OK \tabularnewline
10% type I error level & 0 & 0 & OK \tabularnewline
\hline
\end{tabular}
%Source: https://freestatistics.org/blog/index.php?pk=25115&T=6

[TABLE]
[ROW][C]Meta Analysis of Goldfeld-Quandt test for Heteroskedasticity[/C][/ROW]
[ROW][C]Description[/C][C]# significant tests[/C][C]% significant tests[/C][C]OK/NOK[/C][/ROW]
[ROW][C]1% type I error level[/C][C]0[/C][C]0[/C][C]OK[/C][/ROW]
[ROW][C]5% type I error level[/C][C]0[/C][C]0[/C][C]OK[/C][/ROW]
[ROW][C]10% type I error level[/C][C]0[/C][C]0[/C][C]OK[/C][/ROW]
[/TABLE]
Source: https://freestatistics.org/blog/index.php?pk=25115&T=6

Globally Unique Identifier (entire table): ba.freestatistics.org/blog/index.php?pk=25115&T=6

As an alternative you can also use a QR Code:  

The GUIDs for individual cells are displayed in the table below:

Meta Analysis of Goldfeld-Quandt test for Heteroskedasticity
Description# significant tests% significant testsOK/NOK
1% type I error level00OK
5% type I error level00OK
10% type I error level00OK


Parameters (Session):
par1 = 1 ; par2 = Include Monthly Dummies ; par3 = Linear Trend ;
Parameters (R input):
par1 = 1 ; par2 = Include Monthly Dummies ; par3 = Linear Trend ;
R code (references can be found in the software module):
library(lattice)
library(lmtest)
n25 <- 25 #minimum number of obs. for Goldfeld-Quandt test
par1 <- as.numeric(par1)
x <- t(y)
k <- length(x[1,])
n <- length(x[,1])
x1 <- cbind(x[,par1], x[,1:k!=par1])
mycolnames <- c(colnames(x)[par1], colnames(x)[1:k!=par1])
colnames(x1) <- mycolnames #colnames(x)[par1]
x <- x1
if (par3 == 'First Differences'){
x2 <- array(0, dim=c(n-1,k), dimnames=list(1:(n-1), paste('(1-B)',colnames(x),sep='')))
for (i in 1:n-1) {
for (j in 1:k) {
x2[i,j] <- x[i+1,j] - x[i,j]
}
}
x <- x2
}
if (par2 == 'Include Monthly Dummies'){
x2 <- array(0, dim=c(n,11), dimnames=list(1:n, paste('M', seq(1:11), sep ='')))
for (i in 1:11){
x2[seq(i,n,12),i] <- 1
}
x <- cbind(x, x2)
}
if (par2 == 'Include Quarterly Dummies'){
x2 <- array(0, dim=c(n,3), dimnames=list(1:n, paste('Q', seq(1:3), sep ='')))
for (i in 1:3){
x2[seq(i,n,4),i] <- 1
}
x <- cbind(x, x2)
}
k <- length(x[1,])
if (par3 == 'Linear Trend'){
x <- cbind(x, c(1:n))
colnames(x)[k+1] <- 't'
}
x
k <- length(x[1,])
df <- as.data.frame(x)
(mylm <- lm(df))
(mysum <- summary(mylm))
if (n > n25) {
kp3 <- k + 3
nmkm3 <- n - k - 3
gqarr <- array(NA, dim=c(nmkm3-kp3+1,3))
numgqtests <- 0
numsignificant1 <- 0
numsignificant5 <- 0
numsignificant10 <- 0
for (mypoint in kp3:nmkm3) {
j <- 0
numgqtests <- numgqtests + 1
for (myalt in c('greater', 'two.sided', 'less')) {
j <- j + 1
gqarr[mypoint-kp3+1,j] <- gqtest(mylm, point=mypoint, alternative=myalt)$p.value
}
if (gqarr[mypoint-kp3+1,2] < 0.01) numsignificant1 <- numsignificant1 + 1
if (gqarr[mypoint-kp3+1,2] < 0.05) numsignificant5 <- numsignificant5 + 1
if (gqarr[mypoint-kp3+1,2] < 0.10) numsignificant10 <- numsignificant10 + 1
}
gqarr
}
bitmap(file='test0.png')
plot(x[,1], type='l', main='Actuals and Interpolation', ylab='value of Actuals and Interpolation (dots)', xlab='time or index')
points(x[,1]-mysum$resid)
grid()
dev.off()
bitmap(file='test1.png')
plot(mysum$resid, type='b', pch=19, main='Residuals', ylab='value of Residuals', xlab='time or index')
grid()
dev.off()
bitmap(file='test2.png')
hist(mysum$resid, main='Residual Histogram', xlab='values of Residuals')
grid()
dev.off()
bitmap(file='test3.png')
densityplot(~mysum$resid,col='black',main='Residual Density Plot', xlab='values of Residuals')
dev.off()
bitmap(file='test4.png')
qqnorm(mysum$resid, main='Residual Normal Q-Q Plot')
qqline(mysum$resid)
grid()
dev.off()
(myerror <- as.ts(mysum$resid))
bitmap(file='test5.png')
dum <- cbind(lag(myerror,k=1),myerror)
dum
dum1 <- dum[2:length(myerror),]
dum1
z <- as.data.frame(dum1)
z
plot(z,main=paste('Residual Lag plot, lowess, and regression line'), ylab='values of Residuals', xlab='lagged values of Residuals')
lines(lowess(z))
abline(lm(z))
grid()
dev.off()
bitmap(file='test6.png')
acf(mysum$resid, lag.max=length(mysum$resid)/2, main='Residual Autocorrelation Function')
grid()
dev.off()
bitmap(file='test7.png')
pacf(mysum$resid, lag.max=length(mysum$resid)/2, main='Residual Partial Autocorrelation Function')
grid()
dev.off()
bitmap(file='test8.png')
opar <- par(mfrow = c(2,2), oma = c(0, 0, 1.1, 0))
plot(mylm, las = 1, sub='Residual Diagnostics')
par(opar)
dev.off()
if (n > n25) {
bitmap(file='test9.png')
plot(kp3:nmkm3,gqarr[,2], main='Goldfeld-Quandt test',ylab='2-sided p-value',xlab='breakpoint')
grid()
dev.off()
}
load(file='createtable')
a<-table.start()
a<-table.row.start(a)
a<-table.element(a, 'Multiple Linear Regression - Estimated Regression Equation', 1, TRUE)
a<-table.row.end(a)
myeq <- colnames(x)[1]
myeq <- paste(myeq, '[t] = ', sep='')
for (i in 1:k){
if (mysum$coefficients[i,1] > 0) myeq <- paste(myeq, '+', '')
myeq <- paste(myeq, mysum$coefficients[i,1], sep=' ')
if (rownames(mysum$coefficients)[i] != '(Intercept)') {
myeq <- paste(myeq, rownames(mysum$coefficients)[i], sep='')
if (rownames(mysum$coefficients)[i] != 't') myeq <- paste(myeq, '[t]', sep='')
}
}
myeq <- paste(myeq, ' + e[t]')
a<-table.row.start(a)
a<-table.element(a, myeq)
a<-table.row.end(a)
a<-table.end(a)
table.save(a,file='mytable1.tab')
a<-table.start()
a<-table.row.start(a)
a<-table.element(a,hyperlink('ols1.htm','Multiple Linear Regression - Ordinary Least Squares',''), 6, TRUE)
a<-table.row.end(a)
a<-table.row.start(a)
a<-table.element(a,'Variable',header=TRUE)
a<-table.element(a,'Parameter',header=TRUE)
a<-table.element(a,'S.D.',header=TRUE)
a<-table.element(a,'T-STAT
H0: parameter = 0',header=TRUE)
a<-table.element(a,'2-tail p-value',header=TRUE)
a<-table.element(a,'1-tail p-value',header=TRUE)
a<-table.row.end(a)
for (i in 1:k){
a<-table.row.start(a)
a<-table.element(a,rownames(mysum$coefficients)[i],header=TRUE)
a<-table.element(a,mysum$coefficients[i,1])
a<-table.element(a, round(mysum$coefficients[i,2],6))
a<-table.element(a, round(mysum$coefficients[i,3],4))
a<-table.element(a, round(mysum$coefficients[i,4],6))
a<-table.element(a, round(mysum$coefficients[i,4]/2,6))
a<-table.row.end(a)
}
a<-table.end(a)
table.save(a,file='mytable2.tab')
a<-table.start()
a<-table.row.start(a)
a<-table.element(a, 'Multiple Linear Regression - Regression Statistics', 2, TRUE)
a<-table.row.end(a)
a<-table.row.start(a)
a<-table.element(a, 'Multiple R',1,TRUE)
a<-table.element(a, sqrt(mysum$r.squared))
a<-table.row.end(a)
a<-table.row.start(a)
a<-table.element(a, 'R-squared',1,TRUE)
a<-table.element(a, mysum$r.squared)
a<-table.row.end(a)
a<-table.row.start(a)
a<-table.element(a, 'Adjusted R-squared',1,TRUE)
a<-table.element(a, mysum$adj.r.squared)
a<-table.row.end(a)
a<-table.row.start(a)
a<-table.element(a, 'F-TEST (value)',1,TRUE)
a<-table.element(a, mysum$fstatistic[1])
a<-table.row.end(a)
a<-table.row.start(a)
a<-table.element(a, 'F-TEST (DF numerator)',1,TRUE)
a<-table.element(a, mysum$fstatistic[2])
a<-table.row.end(a)
a<-table.row.start(a)
a<-table.element(a, 'F-TEST (DF denominator)',1,TRUE)
a<-table.element(a, mysum$fstatistic[3])
a<-table.row.end(a)
a<-table.row.start(a)
a<-table.element(a, 'p-value',1,TRUE)
a<-table.element(a, 1-pf(mysum$fstatistic[1],mysum$fstatistic[2],mysum$fstatistic[3]))
a<-table.row.end(a)
a<-table.row.start(a)
a<-table.element(a, 'Multiple Linear Regression - Residual Statistics', 2, TRUE)
a<-table.row.end(a)
a<-table.row.start(a)
a<-table.element(a, 'Residual Standard Deviation',1,TRUE)
a<-table.element(a, mysum$sigma)
a<-table.row.end(a)
a<-table.row.start(a)
a<-table.element(a, 'Sum Squared Residuals',1,TRUE)
a<-table.element(a, sum(myerror*myerror))
a<-table.row.end(a)
a<-table.end(a)
table.save(a,file='mytable3.tab')
a<-table.start()
a<-table.row.start(a)
a<-table.element(a, 'Multiple Linear Regression - Actuals, Interpolation, and Residuals', 4, TRUE)
a<-table.row.end(a)
a<-table.row.start(a)
a<-table.element(a, 'Time or Index', 1, TRUE)
a<-table.element(a, 'Actuals', 1, TRUE)
a<-table.element(a, 'Interpolation
Forecast', 1, TRUE)
a<-table.element(a, 'Residuals
Prediction Error', 1, TRUE)
a<-table.row.end(a)
for (i in 1:n) {
a<-table.row.start(a)
a<-table.element(a,i, 1, TRUE)
a<-table.element(a,x[i])
a<-table.element(a,x[i]-mysum$resid[i])
a<-table.element(a,mysum$resid[i])
a<-table.row.end(a)
}
a<-table.end(a)
table.save(a,file='mytable4.tab')
if (n > n25) {
a<-table.start()
a<-table.row.start(a)
a<-table.element(a,'Goldfeld-Quandt test for Heteroskedasticity',4,TRUE)
a<-table.row.end(a)
a<-table.row.start(a)
a<-table.element(a,'p-values',header=TRUE)
a<-table.element(a,'Alternative Hypothesis',3,header=TRUE)
a<-table.row.end(a)
a<-table.row.start(a)
a<-table.element(a,'breakpoint index',header=TRUE)
a<-table.element(a,'greater',header=TRUE)
a<-table.element(a,'2-sided',header=TRUE)
a<-table.element(a,'less',header=TRUE)
a<-table.row.end(a)
for (mypoint in kp3:nmkm3) {
a<-table.row.start(a)
a<-table.element(a,mypoint,header=TRUE)
a<-table.element(a,gqarr[mypoint-kp3+1,1])
a<-table.element(a,gqarr[mypoint-kp3+1,2])
a<-table.element(a,gqarr[mypoint-kp3+1,3])
a<-table.row.end(a)
}
a<-table.end(a)
table.save(a,file='mytable5.tab')
a<-table.start()
a<-table.row.start(a)
a<-table.element(a,'Meta Analysis of Goldfeld-Quandt test for Heteroskedasticity',4,TRUE)
a<-table.row.end(a)
a<-table.row.start(a)
a<-table.element(a,'Description',header=TRUE)
a<-table.element(a,'# significant tests',header=TRUE)
a<-table.element(a,'% significant tests',header=TRUE)
a<-table.element(a,'OK/NOK',header=TRUE)
a<-table.row.end(a)
a<-table.row.start(a)
a<-table.element(a,'1% type I error level',header=TRUE)
a<-table.element(a,numsignificant1)
a<-table.element(a,numsignificant1/numgqtests)
if (numsignificant1/numgqtests < 0.01) dum <- 'OK' else dum <- 'NOK'
a<-table.element(a,dum)
a<-table.row.end(a)
a<-table.row.start(a)
a<-table.element(a,'5% type I error level',header=TRUE)
a<-table.element(a,numsignificant5)
a<-table.element(a,numsignificant5/numgqtests)
if (numsignificant5/numgqtests < 0.05) dum <- 'OK' else dum <- 'NOK'
a<-table.element(a,dum)
a<-table.row.end(a)
a<-table.row.start(a)
a<-table.element(a,'10% type I error level',header=TRUE)
a<-table.element(a,numsignificant10)
a<-table.element(a,numsignificant10/numgqtests)
if (numsignificant10/numgqtests < 0.1) dum <- 'OK' else dum <- 'NOK'
a<-table.element(a,dum)
a<-table.row.end(a)
a<-table.end(a)
table.save(a,file='mytable6.tab')
}