Free Statistics

of Irreproducible Research!

Author's title

Author*Unverified author*
R Software Modulerwasp_cloud.wasp
Title produced by softwareTrivariate Scatterplots
Date of computationThu, 13 Nov 2008 14:08:55 -0700
Cite this page as followsStatistical Computations at FreeStatistics.org, Office for Research Development and Education, URL https://freestatistics.org/blog/index.php?v=date/2008/Nov/13/t12266107324pvta1bo3uk04at.htm/, Retrieved Mon, 20 May 2024 11:07:18 +0000
Statistical Computations at FreeStatistics.org, Office for Research Development and Education, URL https://freestatistics.org/blog/index.php?pk=24833, Retrieved Mon, 20 May 2024 11:07:18 +0000
QR Codes:

Original text written by user:
IsPrivate?No (this computation is public)
User-defined keywords
Estimated Impact152
Family? (F = Feedback message, R = changed R code, M = changed R Module, P = changed Parameters, D = changed Data)
F       [Trivariate Scatterplots] [Various EDA topic...] [2008-11-13 21:08:55] [6af198e0108e278de39b2b3c538c1a2b] [Current]
Feedback Forum
2008-11-16 12:01:05 [Nicolaj Wuyts] [reply
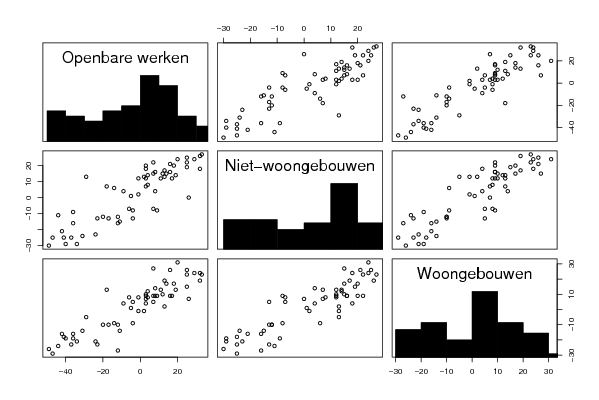
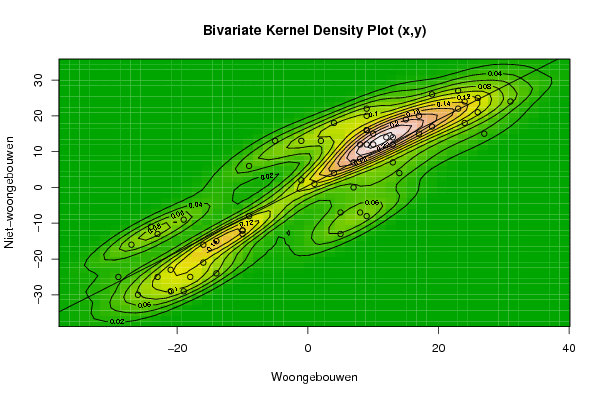
Er is wel een groot verschil tussen de gewone correlaties en de partiële correlaties. De partiële correlaties liggen alledrie lager dan de gewone correlaties. Dit wijst er dus op dat de derde variabele een grote invloed heeft op de relatie van de twee andere variabelen. Dit is het grote nadeel van de gewone correlatie en de bivariate kernel density plot, zij houden geen rekening met de invloed van de derde variabele op de onderlinge relatie van de twee andere variabelen.
2008-11-16 15:22:01 [Julie Govaerts] [reply
partiële correlatie is een goede manier om verbanden te meten want corrigeert voor de schijncorrelatie, nonsenscorrelatie
bij een partiële correlatie is het nodig om een derde variabele te hebben die een groot vertekenend effect heeft = maar is moeilijk te vinden = geluk hebben
2008-11-22 12:58:51 [Gilliam Schoorel] [reply
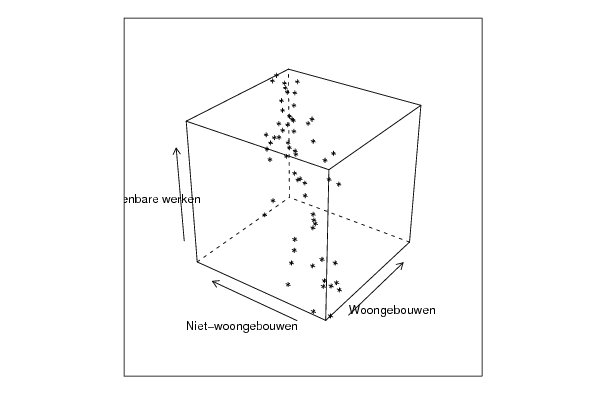
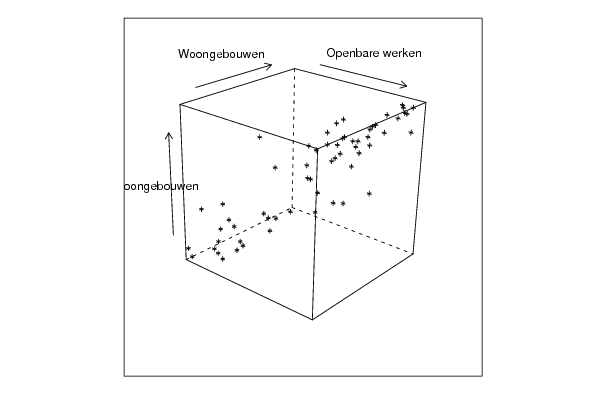
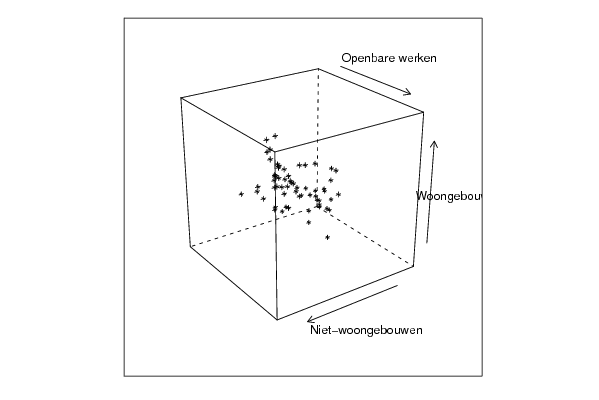
De trivariate scatterplot is een driedimensionale scatterplot met de mogelijkheid om meer dan twee variabelen te onderzoeken. Met deze trivariate scatterplots kan men de correlatie (de verbanden) gelijktijdig van 3 variabelen kan onderzoeken. Men kan de variabelen vanuit verschillende perspectieven bekijken en onderzoeken. Zo is het mogelijk om puntenwolken beter de analyseren.
Je kan concluderen dat deze 3 variabelen een lineair verband hebben met elkaar. Er kan wel een lichte vertekening ontstaan door de driedimensionale weergave van de scatterplots, daarom kan je het beste ook nog eens naar de bivariate density kijken voor een betere conclusie. Hier kan je zien dat de hoogtelijnen ellipsvormig zijn en zich stijgend oriënteren. Dit duidt eveneens op een hoog correlatief verband. Je kan evenwel zien dat er verschillende clusters van hoogtelijnen ontstaan. Dit kan duiden op verschillende waarnemingen. Dit kan bijvoorbeeld wijzen op seizoenaliteit.

Post a new message
Dataseries X:
8
-10
-24
-19
8
24
14
7
9
-26
19
15
-1
-10
-21
-14
-27
26
23
5
19
-19
24
17
1
-9
-16
-21
-14
31
27
10
12
-23
13
26
-1
4
-16
-5
9
23
9
2
10
-29
17
9
9
-10
-23
13
13
-9
9
5
8
-18
7
4
Dataseries Y:
-7
-13
-11
-9
8
24
4
7
16
-30
26
19
2
-12
-29
-24
-16
25
22
-7
17
-29
18
15
1
6
-21
-23
-15
24
15
15
14
-25
14
21
13
4
-16
13
20
27
-8
13
12
-25
20
22
16
-12
-13
7
12
-8
12
-13
12
-25
0
18
Dataseries Z:
-6
-17
-44
-36
4
29
8
3
8
-49
32
25
-1
-20
-34
-31
-12
25
25
7
13
-40
32
14
-5
-14
-42
-24
-11
20
7
12
4
-37
19
16
2
-9
-36
-29
3
33
9
13
3
-47
18
7
16
-12
-23
-18
11
-4
17
-4
-1
-41
26
3


Summary of computational transaction
Raw Inputview raw input (R code)
Raw Outputview raw output of R engine
Computing time5 seconds
R Server'Herman Ole Andreas Wold' @ 193.190.124.10:1001

\begin{tabular}{lllllllll}
\hline
Summary of computational transaction \tabularnewline
Raw Input & view raw input (R code)  \tabularnewline
Raw Output & view raw output of R engine  \tabularnewline
Computing time & 5 seconds \tabularnewline
R Server & 'Herman Ole Andreas Wold' @ 193.190.124.10:1001 \tabularnewline
\hline
\end{tabular}
%Source: https://freestatistics.org/blog/index.php?pk=24833&T=0

[TABLE]
[ROW][C]Summary of computational transaction[/C][/ROW]
[ROW][C]Raw Input[/C][C]view raw input (R code) [/C][/ROW]
[ROW][C]Raw Output[/C][C]view raw output of R engine [/C][/ROW]
[ROW][C]Computing time[/C][C]5 seconds[/C][/ROW]
[ROW][C]R Server[/C][C]'Herman Ole Andreas Wold' @ 193.190.124.10:1001[/C][/ROW]
[/TABLE]
Source: https://freestatistics.org/blog/index.php?pk=24833&T=0

Globally Unique Identifier (entire table): ba.freestatistics.org/blog/index.php?pk=24833&T=0

As an alternative you can also use a QR Code:  

The GUIDs for individual cells are displayed in the table below:

Summary of computational transaction
Raw Inputview raw input (R code)
Raw Outputview raw output of R engine
Computing time5 seconds
R Server'Herman Ole Andreas Wold' @ 193.190.124.10:1001


Parameters (Session):
par1 = 50 ; par2 = 50 ; par3 = Y ; par4 = Y ; par5 = Woongebouwen ; par6 = Niet-woongebouwen ; par7 = Openbare werken ;
Parameters (R input):
par1 = 50 ; par2 = 50 ; par3 = Y ; par4 = Y ; par5 = Woongebouwen ; par6 = Niet-woongebouwen ; par7 = Openbare werken ;
R code (references can be found in the software module):
x <- array(x,dim=c(length(x),1))
colnames(x) <- par5
y <- array(y,dim=c(length(y),1))
colnames(y) <- par6
z <- array(z,dim=c(length(z),1))
colnames(z) <- par7
d <- data.frame(cbind(z,y,x))
colnames(d) <- list(par7,par6,par5)
par1 <- as.numeric(par1)
par2 <- as.numeric(par2)
if (par1>500) par1 <- 500
if (par2>500) par2 <- 500
if (par1<10) par1 <- 10
if (par2<10) par2 <- 10
library(GenKern)
library(lattice)
panel.hist <- function(x, ...)
{
usr <- par('usr'); on.exit(par(usr))
par(usr = c(usr[1:2], 0, 1.5) )
h <- hist(x, plot = FALSE)
breaks <- h$breaks; nB <- length(breaks)
y <- h$counts; y <- y/max(y)
rect(breaks[-nB], 0, breaks[-1], y, col='black', ...)
}
bitmap(file='cloud1.png')
cloud(z~x*y, screen = list(x=-45, y=45, z=35),xlab=par5,ylab=par6,zlab=par7)
dev.off()
bitmap(file='cloud2.png')
cloud(z~x*y, screen = list(x=35, y=45, z=25),xlab=par5,ylab=par6,zlab=par7)
dev.off()
bitmap(file='cloud3.png')
cloud(z~x*y, screen = list(x=35, y=-25, z=90),xlab=par5,ylab=par6,zlab=par7)
dev.off()
bitmap(file='pairs.png')
pairs(d,diag.panel=panel.hist)
dev.off()
x <- as.vector(x)
y <- as.vector(y)
z <- as.vector(z)
bitmap(file='bidensity1.png')
op <- KernSur(x,y, xgridsize=par1, ygridsize=par2, correlation=cor(x,y), xbandwidth=dpik(x), ybandwidth=dpik(y))
image(op$xords, op$yords, op$zden, col=terrain.colors(100), axes=TRUE,main='Bivariate Kernel Density Plot (x,y)',xlab=par5,ylab=par6)
if (par3=='Y') contour(op$xords, op$yords, op$zden, add=TRUE)
if (par4=='Y') points(x,y)
(r<-lm(y ~ x))
abline(r)
box()
dev.off()
bitmap(file='bidensity2.png')
op <- KernSur(y,z, xgridsize=par1, ygridsize=par2, correlation=cor(y,z), xbandwidth=dpik(y), ybandwidth=dpik(z))
op
image(op$xords, op$yords, op$zden, col=terrain.colors(100), axes=TRUE,main='Bivariate Kernel Density Plot (y,z)',xlab=par6,ylab=par7)
if (par3=='Y') contour(op$xords, op$yords, op$zden, add=TRUE)
if (par4=='Y') points(y,z)
(r<-lm(z ~ y))
abline(r)
box()
dev.off()
bitmap(file='bidensity3.png')
op <- KernSur(x,z, xgridsize=par1, ygridsize=par2, correlation=cor(x,z), xbandwidth=dpik(x), ybandwidth=dpik(z))
op
image(op$xords, op$yords, op$zden, col=terrain.colors(100), axes=TRUE,main='Bivariate Kernel Density Plot (x,z)',xlab=par5,ylab=par7)
if (par3=='Y') contour(op$xords, op$yords, op$zden, add=TRUE)
if (par4=='Y') points(x,z)
(r<-lm(z ~ x))
abline(r)
box()
dev.off()