Free Statistics

of Irreproducible Research!

Author's title

Author*Unverified author*
R Software Modulerwasp_boxcoxlin.wasp
Title produced by softwareBox-Cox Linearity Plot
Date of computationWed, 12 Nov 2008 08:25:20 -0700
Cite this page as followsStatistical Computations at FreeStatistics.org, Office for Research Development and Education, URL https://freestatistics.org/blog/index.php?v=date/2008/Nov/12/t1226503553g96gwz4x646nuwh.htm/, Retrieved Mon, 20 May 2024 05:21:48 +0000
Statistical Computations at FreeStatistics.org, Office for Research Development and Education, URL https://freestatistics.org/blog/index.php?pk=24244, Retrieved Mon, 20 May 2024 05:21:48 +0000
QR Codes:

Original text written by user:
IsPrivate?No (this computation is public)
User-defined keywords
Estimated Impact156
Family? (F = Feedback message, R = changed R code, M = changed R Module, P = changed Parameters, D = changed Data)
F       [Box-Cox Linearity Plot] [opdracht3_Q3] [2008-11-12 15:25:20] [e8ace8b3d80d7fc51f1760fb13a6fe6b] [Current]
Feedback Forum
2008-11-19 18:04:58 [Steven Vercammen] [reply
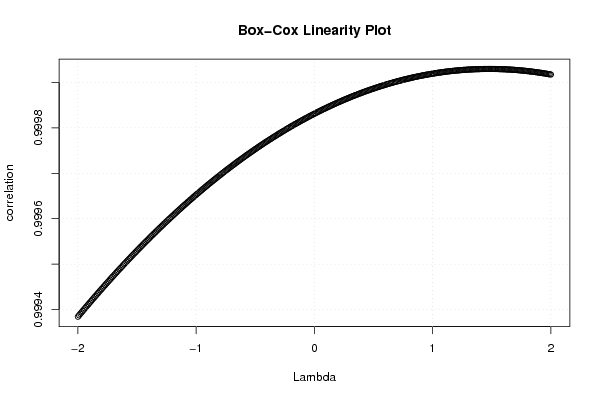
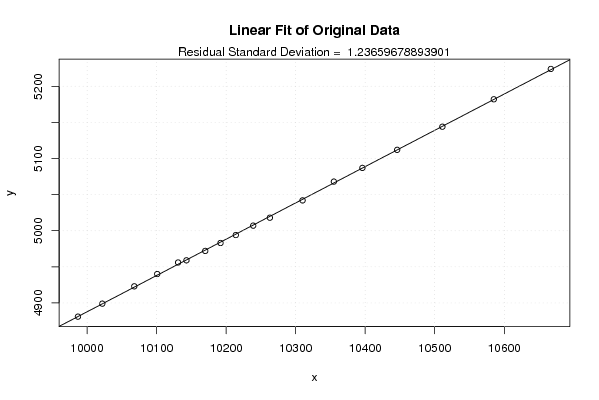
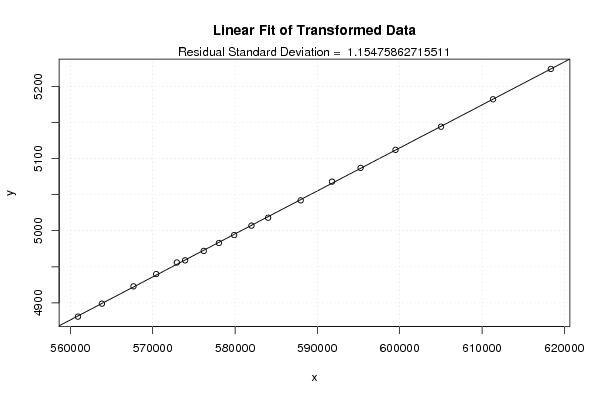
De vraag werd goed opgelost. In het e-hanboek vinden we dat het doel van de Box-cox transformatie is om de X variabele te transformeren zodat de correlatie met de Y variabele maximaal wordt. “Transformations can often significantly improve a fit. The Box-Cox linearity plot provides a convenient way to find a suitable transformation without engaging in a lot of trial and error fitting.” De formule die wordt toegepast is T(X) = (X^lambda -1) / lambda. Waarbij X de variabele is die getransformeerd wordt en lambda de transformatieparameter. Als lambda echter 0 is dan wordt ipv deze formule de natuurlijke logaritme van data gebruikt. De box-coxlinearity plot geeft aan welke waarde van lambda nodig is opdat de transformatie een optimaal effect heeft. Men moet echter ook kijken naar het verschil in correlatie voor en na transformatie. Dit kunnen we nagaan door de scatterplots voor en na transformatie te vergelijken. Het is wel zo dat deze transformatie hier niet echt nuttig is omdat er reeds een bijna perfecte correlatie is.
2008-11-21 21:19:08 [Gilliam Schoorel] [reply
De box cox transformatie zorgt voor een betere fit. Indien het maximum niet bekomen wordt na de transformatie heeft de transformatie niet veel zin. De correlatie tussen de variabelen was reeds zeer hoog en dus lineair. Er is in feite geen reden meer om de fit dan ook nog te verbeteren... De lineair fit correlatie grafieken geven dit ook heel duidelijk weer. Er is AMPER iets veranderd in de correlatie op de transformed fit grafiek. Je kan bijvoorbeeld ook kijken naar het verloop van de lijn. De lijn is reeds over zijn maximum gegaan en buigt hierna terug. De fit is dus verbeterd maar had eigenlijk weinig nut;

Post a new message
Dataseries X:
9987
10022
10068
10101
10131
10143
10170
10192
10214
10239
10263
10310
10355
10396
10446
10511
10585
10667
Dataseries Y:
4881
4899
4923
4940
4956
4959
4972
4983
4994
5007
5018
5042
5068
5087
5112
5144
5182
5224


Summary of computational transaction
Raw Inputview raw input (R code)
Raw Outputview raw output of R engine
Computing time1 seconds
R Server'George Udny Yule' @ 72.249.76.132

\begin{tabular}{lllllllll}
\hline
Summary of computational transaction \tabularnewline
Raw Input & view raw input (R code)  \tabularnewline
Raw Output & view raw output of R engine  \tabularnewline
Computing time & 1 seconds \tabularnewline
R Server & 'George Udny Yule' @ 72.249.76.132 \tabularnewline
\hline
\end{tabular}
%Source: https://freestatistics.org/blog/index.php?pk=24244&T=0

[TABLE]
[ROW][C]Summary of computational transaction[/C][/ROW]
[ROW][C]Raw Input[/C][C]view raw input (R code) [/C][/ROW]
[ROW][C]Raw Output[/C][C]view raw output of R engine [/C][/ROW]
[ROW][C]Computing time[/C][C]1 seconds[/C][/ROW]
[ROW][C]R Server[/C][C]'George Udny Yule' @ 72.249.76.132[/C][/ROW]
[/TABLE]
Source: https://freestatistics.org/blog/index.php?pk=24244&T=0

Globally Unique Identifier (entire table): ba.freestatistics.org/blog/index.php?pk=24244&T=0

As an alternative you can also use a QR Code:  

The GUIDs for individual cells are displayed in the table below:

Summary of computational transaction
Raw Inputview raw input (R code)
Raw Outputview raw output of R engine
Computing time1 seconds
R Server'George Udny Yule' @ 72.249.76.132


Box-Cox Linearity Plot
# observations x18
maximum correlation0.99992961175942
optimal lambda(x)1.48
Residual SD (orginial)1.23659678893901
Residual SD (transformed)1.15475862715511

\begin{tabular}{lllllllll}
\hline
Box-Cox Linearity Plot \tabularnewline
# observations x & 18 \tabularnewline
maximum correlation & 0.99992961175942 \tabularnewline
optimal lambda(x) & 1.48 \tabularnewline
Residual SD (orginial) & 1.23659678893901 \tabularnewline
Residual SD (transformed) & 1.15475862715511 \tabularnewline
\hline
\end{tabular}
%Source: https://freestatistics.org/blog/index.php?pk=24244&T=1

[TABLE]
[ROW][C]Box-Cox Linearity Plot[/C][/ROW]
[ROW][C]# observations x[/C][C]18[/C][/ROW]
[ROW][C]maximum correlation[/C][C]0.99992961175942[/C][/ROW]
[ROW][C]optimal lambda(x)[/C][C]1.48[/C][/ROW]
[ROW][C]Residual SD (orginial)[/C][C]1.23659678893901[/C][/ROW]
[ROW][C]Residual SD (transformed)[/C][C]1.15475862715511[/C][/ROW]
[/TABLE]
Source: https://freestatistics.org/blog/index.php?pk=24244&T=1

Globally Unique Identifier (entire table): ba.freestatistics.org/blog/index.php?pk=24244&T=1

As an alternative you can also use a QR Code:  

The GUIDs for individual cells are displayed in the table below:

Box-Cox Linearity Plot
# observations x18
maximum correlation0.99992961175942
optimal lambda(x)1.48
Residual SD (orginial)1.23659678893901
Residual SD (transformed)1.15475862715511


Parameters (Session):
Parameters (R input):
R code (references can be found in the software module):
n <- length(x)
c <- array(NA,dim=c(401))
l <- array(NA,dim=c(401))
mx <- 0
mxli <- -999
for (i in 1:401)
{
l[i] <- (i-201)/100
if (l[i] != 0)
{
x1 <- (x^l[i] - 1) / l[i]
} else {
x1 <- log(x)
}
c[i] <- cor(x1,y)
if (mx < abs(c[i]))
{
mx <- abs(c[i])
mxli <- l[i]
}
}
c
mx
mxli
if (mxli != 0)
{
x1 <- (x^mxli - 1) / mxli
} else {
x1 <- log(x)
}
r<-lm(y~x)
se <- sqrt(var(r$residuals))
r1 <- lm(y~x1)
se1 <- sqrt(var(r1$residuals))
bitmap(file='test1.png')
plot(l,c,main='Box-Cox Linearity Plot',xlab='Lambda',ylab='correlation')
grid()
dev.off()
bitmap(file='test2.png')
plot(x,y,main='Linear Fit of Original Data',xlab='x',ylab='y')
abline(r)
grid()
mtext(paste('Residual Standard Deviation = ',se))
dev.off()
bitmap(file='test3.png')
plot(x1,y,main='Linear Fit of Transformed Data',xlab='x',ylab='y')
abline(r1)
grid()
mtext(paste('Residual Standard Deviation = ',se1))
dev.off()
load(file='createtable')
a<-table.start()
a<-table.row.start(a)
a<-table.element(a,'Box-Cox Linearity Plot',2,TRUE)
a<-table.row.end(a)
a<-table.row.start(a)
a<-table.element(a,'# observations x',header=TRUE)
a<-table.element(a,n)
a<-table.row.end(a)
a<-table.row.start(a)
a<-table.element(a,'maximum correlation',header=TRUE)
a<-table.element(a,mx)
a<-table.row.end(a)
a<-table.row.start(a)
a<-table.element(a,'optimal lambda(x)',header=TRUE)
a<-table.element(a,mxli)
a<-table.row.end(a)
a<-table.row.start(a)
a<-table.element(a,'Residual SD (orginial)',header=TRUE)
a<-table.element(a,se)
a<-table.row.end(a)
a<-table.row.start(a)
a<-table.element(a,'Residual SD (transformed)',header=TRUE)
a<-table.element(a,se1)
a<-table.row.end(a)
a<-table.end(a)
table.save(a,file='mytable.tab')