Free Statistics

of Irreproducible Research!

Author's title

Author*The author of this computation has been verified*
R Software Modulerwasp_bidensity.wasp
Title produced by softwareBivariate Kernel Density Estimation
Date of computationWed, 12 Nov 2008 03:28:53 -0700
Cite this page as followsStatistical Computations at FreeStatistics.org, Office for Research Development and Education, URL https://freestatistics.org/blog/index.php?v=date/2008/Nov/12/t1226485808lkbif2xf2witqt2.htm/, Retrieved Mon, 20 May 2024 05:47:23 +0000
Statistical Computations at FreeStatistics.org, Office for Research Development and Education, URL https://freestatistics.org/blog/index.php?pk=24061, Retrieved Mon, 20 May 2024 05:47:23 +0000
QR Codes:

Original text written by user:
IsPrivate?No (this computation is public)
User-defined keywordsVarious EDA topics
Estimated Impact221
Family? (F = Feedback message, R = changed R code, M = changed R Module, P = changed Parameters, D = changed Data)
-     [Bivariate Kernel Density Estimation] [omzet vs aantal] [2007-12-03 09:28:18] [74be16979710d4c4e7c6647856088456]
F R  D    [Bivariate Kernel Density Estimation] [var eda topics Q1...] [2008-11-12 10:28:53] [3efbb18563b4564408d69b3c9a8e9a6e] [Current]
Feedback Forum
2008-11-15 08:34:20 [Tamara Witters] [reply
Een juiste oplossing maar je bent echter wel vergeten te vermelden dat het hier om correlatie gaat.
Verbetering:
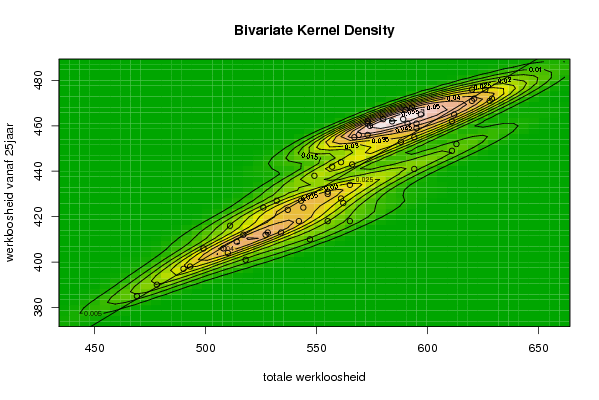
Deze methode geeft clusters weer. In het midden van elke cluster ligt de intensiteit van de punten (observaties) heel dicht. Hoe verder je gaat van het midden, hoe minder de intensiteit.
Hoe dichter de clusters bij elkaar liggen, hoe groter de correlatie. Dit kan zowel een negatieve als positieve correlatie zijn.
Je kan hierbij slechts 2 variabelen vergelijken
2008-11-16 16:01:57 [Kevin Truyts] [reply
Deze grafiek geeft adhv de hoogtelijnen weer waar de meeste punten gelegen zijn. Het roos - oranje gedeelte geeft weer waar de punten heel geconcentreerd zijn of zelfs perfect op
elkaar liggen.
We kunnen dan ook aflezen op de grafiek en in de tabel dat er een zeer sterke correlatie is tussen de 2 reeksen onderling. deze is namelijk 93%.
2008-11-22 15:41:20 [Stéphanie Van Dyck] [reply
Deze oplossing is inderdaad juist, maar er moet nog bijgevoegd worden dat deze grafiek de derde dimensie weergeeft aan de hand van hoogtelijnen.
Je kan de densiteit aflezen, deze wordt lager naarmate je weggaat van het midden van een cluster.
2008-11-23 14:44:54 [Annelies Michiels] [reply
Je legt wel uit hoe we de grafiek moeten lezen en wat de kleuren betekenen maar je vertelt niet wat we nu juist kunnen afleiden van de grafiek. Namelijk wat is nu juist het verband tussen de totale werkloosheid en de werkloosheid boven de 25jaar.

Het klopt inderdaad dat er 2 clusters zijn maar hoe moeten we die clusters interpreteren?
2008-11-24 14:31:19 [Bernard Femont] [reply
Er is vergeten te vermelden dat het hier om correlatie gaat; een uitleg hiervoor zou kunnen zijn; Er worden clusters gevormd. In het midden is er een dichte intensiteit. Hoe dichter de clusters bij elkaar liggen hoe sterker de correlatie is. Dit kan zowel een negatieve als positieve correlatie zijn. We kunnen dan ook aflezen op de grafiek en in de tabel dat er een zeer sterke correlatie is tussen de 2 reeksen onderling. deze is namelijk 93%. Je kan de densiteit aflezen, deze wordt lager naarmate je weggaat van het midden van een cluster.


Post a new message
Dataseries X:
565
547
555
562
561
555
544
537
543
594
611
613
611
594
595
591
589
584
573
567
569
621
629
628
612
595
597
593
590
580
574
573
573
620
626
620
588
566
557
561
549
532
526
511
499
555
565
542
527
510
514
517
508
493
490
469
478
528
534
518
Dataseries Y:
418
410
418
426
428
430
424
423
427
441
449
452
462
455
461
461
463
462
456
455
456
472
472
471
465
459
465
468
467
463
460
462
461
476
476
471
453
443
442
444
438
427
424
416
406
431
434
418
412
404
409
412
406
398
397
385
390
413
413
401


Summary of computational transaction
Raw Inputview raw input (R code)
Raw Outputview raw output of R engine
Computing time3 seconds
R Server'George Udny Yule' @ 72.249.76.132

\begin{tabular}{lllllllll}
\hline
Summary of computational transaction \tabularnewline
Raw Input & view raw input (R code)  \tabularnewline
Raw Output & view raw output of R engine  \tabularnewline
Computing time & 3 seconds \tabularnewline
R Server & 'George Udny Yule' @ 72.249.76.132 \tabularnewline
\hline
\end{tabular}
%Source: https://freestatistics.org/blog/index.php?pk=24061&T=0

[TABLE]
[ROW][C]Summary of computational transaction[/C][/ROW]
[ROW][C]Raw Input[/C][C]view raw input (R code) [/C][/ROW]
[ROW][C]Raw Output[/C][C]view raw output of R engine [/C][/ROW]
[ROW][C]Computing time[/C][C]3 seconds[/C][/ROW]
[ROW][C]R Server[/C][C]'George Udny Yule' @ 72.249.76.132[/C][/ROW]
[/TABLE]
Source: https://freestatistics.org/blog/index.php?pk=24061&T=0

Globally Unique Identifier (entire table): ba.freestatistics.org/blog/index.php?pk=24061&T=0

As an alternative you can also use a QR Code:  

The GUIDs for individual cells are displayed in the table below:

Summary of computational transaction
Raw Inputview raw input (R code)
Raw Outputview raw output of R engine
Computing time3 seconds
R Server'George Udny Yule' @ 72.249.76.132


Bandwidth
x axis21.8452747291580
y axis8.18036054439099
Correlation
correlation used in KDE0.93003763371815
correlation(x,y)0.93003763371815

\begin{tabular}{lllllllll}
\hline
Bandwidth \tabularnewline
x axis & 21.8452747291580 \tabularnewline
y axis & 8.18036054439099 \tabularnewline
Correlation \tabularnewline
correlation used in KDE & 0.93003763371815 \tabularnewline
correlation(x,y) & 0.93003763371815 \tabularnewline
\hline
\end{tabular}
%Source: https://freestatistics.org/blog/index.php?pk=24061&T=1

[TABLE]
[ROW][C]Bandwidth[/C][/ROW]
[ROW][C]x axis[/C][C]21.8452747291580[/C][/ROW]
[ROW][C]y axis[/C][C]8.18036054439099[/C][/ROW]
[ROW][C]Correlation[/C][/ROW]
[ROW][C]correlation used in KDE[/C][C]0.93003763371815[/C][/ROW]
[ROW][C]correlation(x,y)[/C][C]0.93003763371815[/C][/ROW]
[/TABLE]
Source: https://freestatistics.org/blog/index.php?pk=24061&T=1

Globally Unique Identifier (entire table): ba.freestatistics.org/blog/index.php?pk=24061&T=1

As an alternative you can also use a QR Code:  

The GUIDs for individual cells are displayed in the table below:

Bandwidth
x axis21.8452747291580
y axis8.18036054439099
Correlation
correlation used in KDE0.93003763371815
correlation(x,y)0.93003763371815


Parameters (Session):
par1 = 50 ; par2 = 50 ; par3 = 0 ; par4 = 0 ; par5 = 0 ; par6 = Y ; par7 = Y ;
Parameters (R input):
par1 = 50 ; par2 = 50 ; par3 = 0 ; par4 = 0 ; par5 = 0 ; par6 = Y ; par7 = Y ;
R code (references can be found in the software module):
par1 <- as(par1,'numeric')
par2 <- as(par2,'numeric')
par3 <- as(par3,'numeric')
par4 <- as(par4,'numeric')
par5 <- as(par5,'numeric')
library('GenKern')
if (par3==0) par3 <- dpik(x)
if (par4==0) par4 <- dpik(y)
if (par5==0) par5 <- cor(x,y)
if (par1 > 500) par1 <- 500
if (par2 > 500) par2 <- 500
bitmap(file='bidensity.png')
op <- KernSur(x,y, xgridsize=par1, ygridsize=par2, correlation=par5, xbandwidth=par3, ybandwidth=par4)
image(op$xords, op$yords, op$zden, col=terrain.colors(100), axes=TRUE,main=main,xlab=xlab,ylab=ylab)
if (par6=='Y') contour(op$xords, op$yords, op$zden, add=TRUE)
if (par7=='Y') points(x,y)
(r<-lm(y ~ x))
abline(r)
box()
dev.off()
load(file='createtable')
a<-table.start()
a<-table.row.start(a)
a<-table.element(a,'Bandwidth',2,TRUE)
a<-table.row.end(a)
a<-table.row.start(a)
a<-table.element(a,'x axis',header=TRUE)
a<-table.element(a,par3)
a<-table.row.end(a)
a<-table.row.start(a)
a<-table.element(a,'y axis',header=TRUE)
a<-table.element(a,par4)
a<-table.row.end(a)
a<-table.row.start(a)
a<-table.element(a,'Correlation',2,TRUE)
a<-table.row.end(a)
a<-table.row.start(a)
a<-table.element(a,'correlation used in KDE',header=TRUE)
a<-table.element(a,par5)
a<-table.row.end(a)
a<-table.row.start(a)
a<-table.element(a,'correlation(x,y)',header=TRUE)
a<-table.element(a,cor(x,y))
a<-table.row.end(a)
a<-table.end(a)
table.save(a,file='mytable.tab')