Free Statistics

of Irreproducible Research!

Author's title

Author*The author of this computation has been verified*
R Software Modulerwasp_hierarchicalclustering.wasp
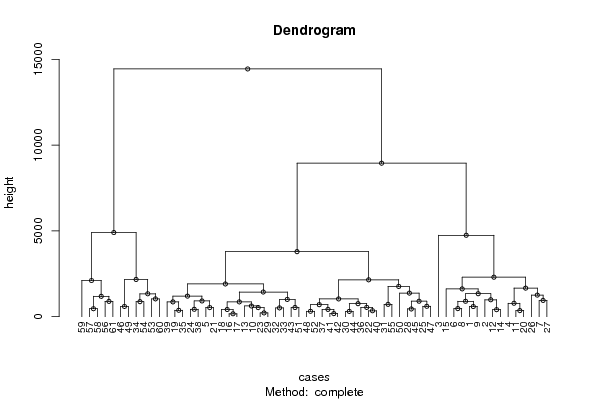
Title produced by softwareHierarchical Clustering
Date of computationTue, 11 Nov 2008 09:10:44 -0700
Cite this page as followsStatistical Computations at FreeStatistics.org, Office for Research Development and Education, URL https://freestatistics.org/blog/index.php?v=date/2008/Nov/11/t1226419919hqz8k5nhr1zkrjx.htm/, Retrieved Mon, 20 May 2024 10:33:40 +0000
Statistical Computations at FreeStatistics.org, Office for Research Development and Education, URL https://freestatistics.org/blog/index.php?pk=23643, Retrieved Mon, 20 May 2024 10:33:40 +0000
QR Codes:

Original text written by user:
IsPrivate?No (this computation is public)
User-defined keywords
Estimated Impact112
Family? (F = Feedback message, R = changed R code, M = changed R Module, P = changed Parameters, D = changed Data)
F       [Hierarchical Clustering] [Q2] [2008-11-11 16:10:44] [5e2b1e7aa808f9f0d23fd35605d4968f] [Current]
Feedback Forum
2008-11-19 21:09:30 [Nathalie Koulouris] [reply
De student heeft deze vraag correct opgelost en de juiste methode toegepast. De boomstructuurdiagram toont aan waar en hoe de clusters zich bevinden of geplaatst zijn. Dit wordt puur exploratief gebruikt.
Meestal wordt dit gebruikt voor niet tijdreeksen bijvoorbeeld bij marktsegmentatie.

Post a new message
Dataseries X:
12192.5	3277.2	10772.8	3421.3
11268.8	3833	9987.7	3531.4
9097.4	2606.3	8638.7	3219.2
12639.8	3643.8	11063.7	3552.3
13040.1	3686.4	11855.7	3787.7
11687.3	3281.6	10684.5	3392.7
11191.7	3669.3	11337.4	3550
11391.9	3191.5	10478	3681.9
11793.1	3512.7	11123.9	3519.1
13933.2	3970.7	12909.3	4283.2
12778.1	3601.2	11339.9	4046.2
11810.3	3610	10462.2	3824.9
13698.4	4172.1	12733.5	4793.1
11956.6	3956.2	10519.2	3977.7
10723.8	3142.7	10414.9	3983.4
13938.9	3884.3	12476.8	4152.9
13979.8	3892.2	12384.6	4286.1
13807.4	3613	12266.7	4348.1
12973.9	3730.5	12919.9	3949.3
12509.8	3481.3	11497.3	4166.7
12934.1	3649.5	12142	4217.9
14908.3	4215.2	13919.4	4528.2
13772.1	4066.6	12656.8	4232.2
13012.6	4196.8	12034.1	4470.9
14049.9	4536.6	13199.7	5121.2
11816.5	4441.6	10881.3	4170.8
11593.2	3548.3	11301.2	4398.6
14466.2	4735.9	13643.9	4491.4
13615.9	4130.6	12517	4251.8
14733.9	4356.2	13981.1	4901.9
13880.7	4159.6	14275.7	4745.2
13527.5	3988	13435	4666.9
13584	4167.8	13565.7	4210.4
16170.2	4902.2	16216.3	5273.6
13260.6	3909.4	12970	4095.3
14741.9	4697.6	14079.9	4610.1
15486.5	4308.9	14235	4718.1
13154.5	4420.4	12213.4	4185.5
12621.2	3544.2	12581	4314.7
15031.6	4433	14130.4	4422.6
15452.4	4479.7	14210.8	5059.2
15428	4533.2	14378.5	5043.6
13105.9	4237.5	13142.8	4436.6
14716.8	4207.4	13714.7	4922.6
14180	4394	13621.9	4454.8
16202.2	5148.4	15379.8	5058.7
14392.4	4202.2	13306.3	4768.9
15140.6	4682.5	14391.2	5171.8
15960.1	4884.3	14909.9	4989.3
14351.3	5288.9	14025.4	5202.1
13230.2	4505.2	12951.2	4838.4
15202.1	4611.5	14344.3	4876.5
17157.3	5081.1	16213.3	5845.3
16159.1	4523.1	15544.5	5686.3
13405.7	4412.8	14750.6	4753.8
17224.7	4647.4	17292.7	6620.4
17338.4	4778.6	17568.5	5597.2
17370.6	4495.3	17930.8	5643.5
18817.8	4633.5	18644.7	6357.3
16593.2	4360.5	16694.8	5909.1
17979.5	4517.9	17242.8	6165.8


Summary of computational transaction
Raw Inputview raw input (R code)
Raw Outputview raw output of R engine
Computing time2 seconds
R Server'Sir Ronald Aylmer Fisher' @ 193.190.124.24

\begin{tabular}{lllllllll}
\hline
Summary of computational transaction \tabularnewline
Raw Input & view raw input (R code)  \tabularnewline
Raw Output & view raw output of R engine  \tabularnewline
Computing time & 2 seconds \tabularnewline
R Server & 'Sir Ronald Aylmer Fisher' @ 193.190.124.24 \tabularnewline
\hline
\end{tabular}
%Source: https://freestatistics.org/blog/index.php?pk=23643&T=0

[TABLE]
[ROW][C]Summary of computational transaction[/C][/ROW]
[ROW][C]Raw Input[/C][C]view raw input (R code) [/C][/ROW]
[ROW][C]Raw Output[/C][C]view raw output of R engine [/C][/ROW]
[ROW][C]Computing time[/C][C]2 seconds[/C][/ROW]
[ROW][C]R Server[/C][C]'Sir Ronald Aylmer Fisher' @ 193.190.124.24[/C][/ROW]
[/TABLE]
Source: https://freestatistics.org/blog/index.php?pk=23643&T=0

Globally Unique Identifier (entire table): ba.freestatistics.org/blog/index.php?pk=23643&T=0

As an alternative you can also use a QR Code:  

The GUIDs for individual cells are displayed in the table below:

Summary of computational transaction
Raw Inputview raw input (R code)
Raw Outputview raw output of R engine
Computing time2 seconds
R Server'Sir Ronald Aylmer Fisher' @ 193.190.124.24


Summary of Dendrogram
LabelHeight
1167.267151586915
2178.393553695194
3220.051448529657
4306.318951421553
5313.408599116234
6343.965245337374
7354.479773753031
8371.521345281803
9409.701073955146
10416.102138903418
11424.588318256638
12428.642298426088
13447.916967751837
14463.358079674888
15470.80575612454
16510.876726813818
17528.807469690056
18530.219341405046
19534.104465437239
20541.171488532055
21589.759832474203
22594.96520066303
23603.828170922822
24621.76896834757
25699.618395984554
26717.871304622214
27756.836105111272
28780.258015018108
29860.465600706966
30861.197282856837
31874.915167316237
32891.989047017954
33896.171998000384
34898.325030264659
35915.443875942157
36947.246351272994
37984.846698730316
381005.48866229312
391033.06462527763
401036.04336781816
411185.71768984021
421197.76103626725
431257.07683933799
441334.29445026201
451338.14773100731
461373.81700018598
471436.68816727918
481618.40006178942
491663.58746689196
501761.86257977176
511905.34733316527
522106.01197290044
532146.54180019863
542169.58108859752
552299.98686517989
563789.58326204874
574745.29123869126
584904.02946259502
598947.8030471172
6014441.7250912071

\begin{tabular}{lllllllll}
\hline
Summary of Dendrogram \tabularnewline
Label & Height \tabularnewline
1 & 167.267151586915 \tabularnewline
2 & 178.393553695194 \tabularnewline
3 & 220.051448529657 \tabularnewline
4 & 306.318951421553 \tabularnewline
5 & 313.408599116234 \tabularnewline
6 & 343.965245337374 \tabularnewline
7 & 354.479773753031 \tabularnewline
8 & 371.521345281803 \tabularnewline
9 & 409.701073955146 \tabularnewline
10 & 416.102138903418 \tabularnewline
11 & 424.588318256638 \tabularnewline
12 & 428.642298426088 \tabularnewline
13 & 447.916967751837 \tabularnewline
14 & 463.358079674888 \tabularnewline
15 & 470.80575612454 \tabularnewline
16 & 510.876726813818 \tabularnewline
17 & 528.807469690056 \tabularnewline
18 & 530.219341405046 \tabularnewline
19 & 534.104465437239 \tabularnewline
20 & 541.171488532055 \tabularnewline
21 & 589.759832474203 \tabularnewline
22 & 594.96520066303 \tabularnewline
23 & 603.828170922822 \tabularnewline
24 & 621.76896834757 \tabularnewline
25 & 699.618395984554 \tabularnewline
26 & 717.871304622214 \tabularnewline
27 & 756.836105111272 \tabularnewline
28 & 780.258015018108 \tabularnewline
29 & 860.465600706966 \tabularnewline
30 & 861.197282856837 \tabularnewline
31 & 874.915167316237 \tabularnewline
32 & 891.989047017954 \tabularnewline
33 & 896.171998000384 \tabularnewline
34 & 898.325030264659 \tabularnewline
35 & 915.443875942157 \tabularnewline
36 & 947.246351272994 \tabularnewline
37 & 984.846698730316 \tabularnewline
38 & 1005.48866229312 \tabularnewline
39 & 1033.06462527763 \tabularnewline
40 & 1036.04336781816 \tabularnewline
41 & 1185.71768984021 \tabularnewline
42 & 1197.76103626725 \tabularnewline
43 & 1257.07683933799 \tabularnewline
44 & 1334.29445026201 \tabularnewline
45 & 1338.14773100731 \tabularnewline
46 & 1373.81700018598 \tabularnewline
47 & 1436.68816727918 \tabularnewline
48 & 1618.40006178942 \tabularnewline
49 & 1663.58746689196 \tabularnewline
50 & 1761.86257977176 \tabularnewline
51 & 1905.34733316527 \tabularnewline
52 & 2106.01197290044 \tabularnewline
53 & 2146.54180019863 \tabularnewline
54 & 2169.58108859752 \tabularnewline
55 & 2299.98686517989 \tabularnewline
56 & 3789.58326204874 \tabularnewline
57 & 4745.29123869126 \tabularnewline
58 & 4904.02946259502 \tabularnewline
59 & 8947.8030471172 \tabularnewline
60 & 14441.7250912071 \tabularnewline
\hline
\end{tabular}
%Source: https://freestatistics.org/blog/index.php?pk=23643&T=1

[TABLE]
[ROW][C]Summary of Dendrogram[/C][/ROW]
[ROW][C]Label[/C][C]Height[/C][/ROW]
[ROW][C]1[/C][C]167.267151586915[/C][/ROW]
[ROW][C]2[/C][C]178.393553695194[/C][/ROW]
[ROW][C]3[/C][C]220.051448529657[/C][/ROW]
[ROW][C]4[/C][C]306.318951421553[/C][/ROW]
[ROW][C]5[/C][C]313.408599116234[/C][/ROW]
[ROW][C]6[/C][C]343.965245337374[/C][/ROW]
[ROW][C]7[/C][C]354.479773753031[/C][/ROW]
[ROW][C]8[/C][C]371.521345281803[/C][/ROW]
[ROW][C]9[/C][C]409.701073955146[/C][/ROW]
[ROW][C]10[/C][C]416.102138903418[/C][/ROW]
[ROW][C]11[/C][C]424.588318256638[/C][/ROW]
[ROW][C]12[/C][C]428.642298426088[/C][/ROW]
[ROW][C]13[/C][C]447.916967751837[/C][/ROW]
[ROW][C]14[/C][C]463.358079674888[/C][/ROW]
[ROW][C]15[/C][C]470.80575612454[/C][/ROW]
[ROW][C]16[/C][C]510.876726813818[/C][/ROW]
[ROW][C]17[/C][C]528.807469690056[/C][/ROW]
[ROW][C]18[/C][C]530.219341405046[/C][/ROW]
[ROW][C]19[/C][C]534.104465437239[/C][/ROW]
[ROW][C]20[/C][C]541.171488532055[/C][/ROW]
[ROW][C]21[/C][C]589.759832474203[/C][/ROW]
[ROW][C]22[/C][C]594.96520066303[/C][/ROW]
[ROW][C]23[/C][C]603.828170922822[/C][/ROW]
[ROW][C]24[/C][C]621.76896834757[/C][/ROW]
[ROW][C]25[/C][C]699.618395984554[/C][/ROW]
[ROW][C]26[/C][C]717.871304622214[/C][/ROW]
[ROW][C]27[/C][C]756.836105111272[/C][/ROW]
[ROW][C]28[/C][C]780.258015018108[/C][/ROW]
[ROW][C]29[/C][C]860.465600706966[/C][/ROW]
[ROW][C]30[/C][C]861.197282856837[/C][/ROW]
[ROW][C]31[/C][C]874.915167316237[/C][/ROW]
[ROW][C]32[/C][C]891.989047017954[/C][/ROW]
[ROW][C]33[/C][C]896.171998000384[/C][/ROW]
[ROW][C]34[/C][C]898.325030264659[/C][/ROW]
[ROW][C]35[/C][C]915.443875942157[/C][/ROW]
[ROW][C]36[/C][C]947.246351272994[/C][/ROW]
[ROW][C]37[/C][C]984.846698730316[/C][/ROW]
[ROW][C]38[/C][C]1005.48866229312[/C][/ROW]
[ROW][C]39[/C][C]1033.06462527763[/C][/ROW]
[ROW][C]40[/C][C]1036.04336781816[/C][/ROW]
[ROW][C]41[/C][C]1185.71768984021[/C][/ROW]
[ROW][C]42[/C][C]1197.76103626725[/C][/ROW]
[ROW][C]43[/C][C]1257.07683933799[/C][/ROW]
[ROW][C]44[/C][C]1334.29445026201[/C][/ROW]
[ROW][C]45[/C][C]1338.14773100731[/C][/ROW]
[ROW][C]46[/C][C]1373.81700018598[/C][/ROW]
[ROW][C]47[/C][C]1436.68816727918[/C][/ROW]
[ROW][C]48[/C][C]1618.40006178942[/C][/ROW]
[ROW][C]49[/C][C]1663.58746689196[/C][/ROW]
[ROW][C]50[/C][C]1761.86257977176[/C][/ROW]
[ROW][C]51[/C][C]1905.34733316527[/C][/ROW]
[ROW][C]52[/C][C]2106.01197290044[/C][/ROW]
[ROW][C]53[/C][C]2146.54180019863[/C][/ROW]
[ROW][C]54[/C][C]2169.58108859752[/C][/ROW]
[ROW][C]55[/C][C]2299.98686517989[/C][/ROW]
[ROW][C]56[/C][C]3789.58326204874[/C][/ROW]
[ROW][C]57[/C][C]4745.29123869126[/C][/ROW]
[ROW][C]58[/C][C]4904.02946259502[/C][/ROW]
[ROW][C]59[/C][C]8947.8030471172[/C][/ROW]
[ROW][C]60[/C][C]14441.7250912071[/C][/ROW]
[/TABLE]
Source: https://freestatistics.org/blog/index.php?pk=23643&T=1

Globally Unique Identifier (entire table): ba.freestatistics.org/blog/index.php?pk=23643&T=1

As an alternative you can also use a QR Code:  

The GUIDs for individual cells are displayed in the table below:

Summary of Dendrogram
LabelHeight
1167.267151586915
2178.393553695194
3220.051448529657
4306.318951421553
5313.408599116234
6343.965245337374
7354.479773753031
8371.521345281803
9409.701073955146
10416.102138903418
11424.588318256638
12428.642298426088
13447.916967751837
14463.358079674888
15470.80575612454
16510.876726813818
17528.807469690056
18530.219341405046
19534.104465437239
20541.171488532055
21589.759832474203
22594.96520066303
23603.828170922822
24621.76896834757
25699.618395984554
26717.871304622214
27756.836105111272
28780.258015018108
29860.465600706966
30861.197282856837
31874.915167316237
32891.989047017954
33896.171998000384
34898.325030264659
35915.443875942157
36947.246351272994
37984.846698730316
381005.48866229312
391033.06462527763
401036.04336781816
411185.71768984021
421197.76103626725
431257.07683933799
441334.29445026201
451338.14773100731
461373.81700018598
471436.68816727918
481618.40006178942
491663.58746689196
501761.86257977176
511905.34733316527
522106.01197290044
532146.54180019863
542169.58108859752
552299.98686517989
563789.58326204874
574745.29123869126
584904.02946259502
598947.8030471172
6014441.7250912071


Parameters (Session):
par1 = complete ; par2 = ALL ; par3 = FALSE ; par4 = FALSE ;
Parameters (R input):
par1 = complete ; par2 = ALL ; par3 = FALSE ; par4 = FALSE ;
R code (references can be found in the software module):
par3 <- as.logical(par3)
par4 <- as.logical(par4)
if (par3 == 'TRUE'){
dum = xlab
xlab = ylab
ylab = dum
}
x <- t(y)
hc <- hclust(dist(x),method=par1)
d <- as.dendrogram(hc)
str(d)
mysub <- paste('Method: ',par1)
bitmap(file='test1.png')
if (par4 == 'TRUE'){
plot(d,main=main,ylab=ylab,xlab=xlab,horiz=par3, nodePar=list(pch = c(1,NA), cex=0.8, lab.cex = 0.8),type='t',center=T, sub=mysub)
} else {
plot(d,main=main,ylab=ylab,xlab=xlab,horiz=par3, nodePar=list(pch = c(1,NA), cex=0.8, lab.cex = 0.8), sub=mysub)
}
dev.off()
if (par2 != 'ALL'){
if (par3 == 'TRUE'){
ylab = 'cluster'
} else {
xlab = 'cluster'
}
par2 <- as.numeric(par2)
memb <- cutree(hc, k = par2)
cent <- NULL
for(k in 1:par2){
cent <- rbind(cent, colMeans(x[memb == k, , drop = FALSE]))
}
hc1 <- hclust(dist(cent),method=par1, members = table(memb))
de <- as.dendrogram(hc1)
bitmap(file='test2.png')
if (par4 == 'TRUE'){
plot(de,main=main,ylab=ylab,xlab=xlab,horiz=par3, nodePar=list(pch = c(1,NA), cex=0.8, lab.cex = 0.8),type='t',center=T, sub=mysub)
} else {
plot(de,main=main,ylab=ylab,xlab=xlab,horiz=par3, nodePar=list(pch = c(1,NA), cex=0.8, lab.cex = 0.8), sub=mysub)
}
dev.off()
str(de)
}
load(file='createtable')
a<-table.start()
a<-table.row.start(a)
a<-table.element(a,'Summary of Dendrogram',2,TRUE)
a<-table.row.end(a)
a<-table.row.start(a)
a<-table.element(a,'Label',header=TRUE)
a<-table.element(a,'Height',header=TRUE)
a<-table.row.end(a)
num <- length(x[,1])-1
for (i in 1:num)
{
a<-table.row.start(a)
a<-table.element(a,hc$labels[i])
a<-table.element(a,hc$height[i])
a<-table.row.end(a)
}
a<-table.end(a)
table.save(a,file='mytable1.tab')
if (par2 != 'ALL'){
a<-table.start()
a<-table.row.start(a)
a<-table.element(a,'Summary of Cut Dendrogram',2,TRUE)
a<-table.row.end(a)
a<-table.row.start(a)
a<-table.element(a,'Label',header=TRUE)
a<-table.element(a,'Height',header=TRUE)
a<-table.row.end(a)
num <- par2-1
for (i in 1:num)
{
a<-table.row.start(a)
a<-table.element(a,i)
a<-table.element(a,hc1$height[i])
a<-table.row.end(a)
}
a<-table.end(a)
table.save(a,file='mytable2.tab')
}