Free Statistics

of Irreproducible Research!

Author's title

Author*Unverified author*
R Software Modulerwasp_cloud.wasp
Title produced by softwareTrivariate Scatterplots
Date of computationTue, 11 Nov 2008 08:20:59 -0700
Cite this page as followsStatistical Computations at FreeStatistics.org, Office for Research Development and Education, URL https://freestatistics.org/blog/index.php?v=date/2008/Nov/11/t1226416961djlx7gv09dg96um.htm/, Retrieved Mon, 20 May 2024 08:41:19 +0000
Statistical Computations at FreeStatistics.org, Office for Research Development and Education, URL https://freestatistics.org/blog/index.php?pk=23590, Retrieved Mon, 20 May 2024 08:41:19 +0000
QR Codes:

Original text written by user:
IsPrivate?No (this computation is public)
User-defined keywords
Estimated Impact114
Family? (F = Feedback message, R = changed R code, M = changed R Module, P = changed Parameters, D = changed Data)
F       [Trivariate Scatterplots] [Gilliam Schoorel] [2008-11-11 15:20:59] [858b7042afe52f6c8b5a77939309cfed] [Current]
Feedback Forum
2008-11-14 15:21:04 [Annemiek Hoofman] [reply
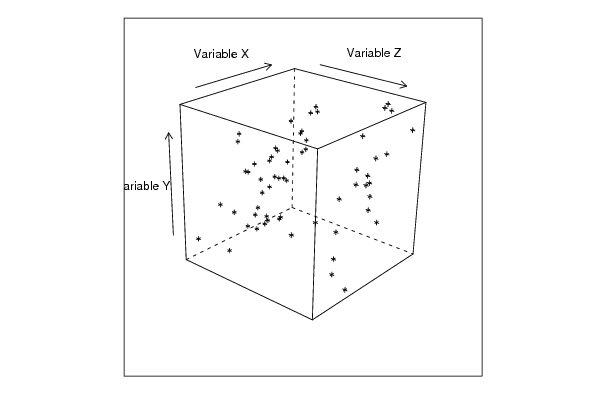
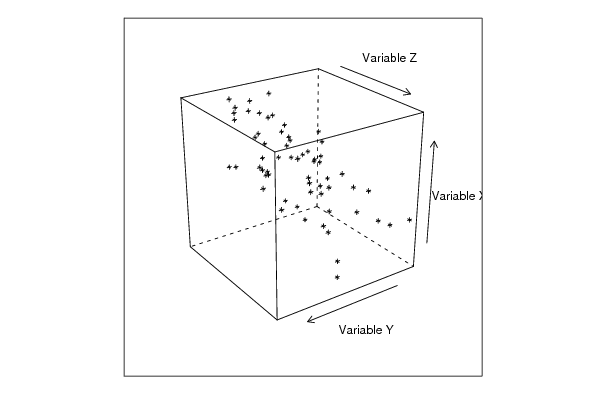
De student heeft deze vraag goed geïnterpreteerd. Ik kan er nog wel bijzeggen dat men best de kubus van alle kanten observeert, dit kan sommige opmerkelijkheden aan het licht brengen, die je vanuit een andere positie niet kan zien.
2008-11-17 13:19:23 [Stef Vermeiren] [reply
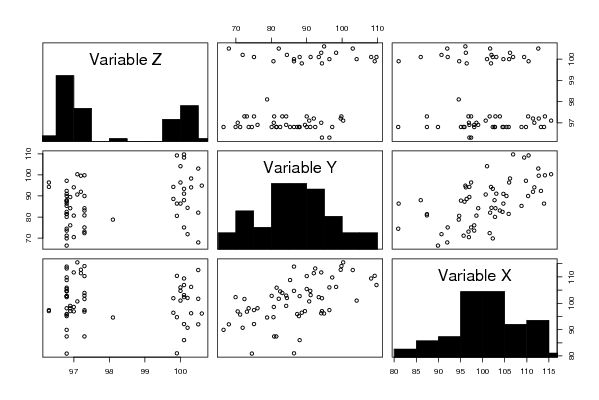
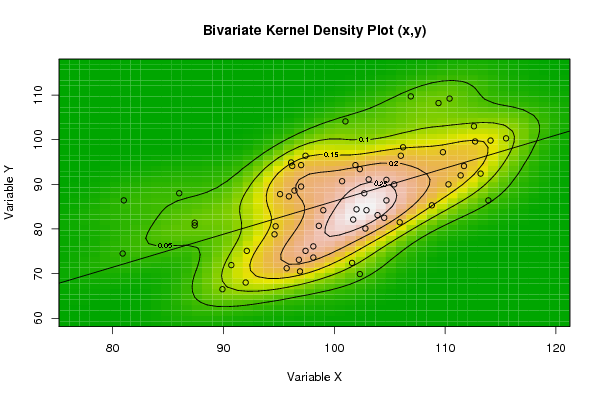
De student bereikt een goede analyse van de vraag. Bijkomend kan gezegd worden dat men de correlatie (de verbanden) gelijktijdig van 3 variabelen kan onderzoeken. Men kan de variabelen vanuit verschillende perspectieven bekijken. Zo is het mogelijk om puntenwolken beter de analyseren.

Post a new message
Dataseries X:
110,40
96,40
101,90
106,20
81,00
94,70
101,00
109,40
102,30
90,70
96,20
96,10
106,00
103,10
102,00
104,70
86,00
92,10
106,90
112,60
101,70
92,00
97,40
97,00
105,40
102,70
98,10
104,50
87,40
89,90
109,80
111,70
98,60
96,90
95,10
97,00
112,70
102,90
97,40
111,40
87,40
96,80
114,10
110,30
103,90
101,60
94,60
95,90
104,70
102,80
98,10
113,90
80,90
95,70
113,20
105,90
108,80
102,30
99,00
100,70
115,50
Dataseries Y:
109,20
88,60
94,30
98,30
86,40
80,60
104,10
108,20
93,40
71,90
94,10
94,90
96,40
91,10
84,40
86,40
88,00
75,10
109,70
103,00
82,10
68,00
96,40
94,30
90,00
88,00
76,10
82,50
81,40
66,50
97,20
94,10
80,70
70,50
87,80
89,50
99,60
84,20
75,10
92,00
80,80
73,10
99,80
90,00
83,10
72,40
78,80
87,30
91,00
80,10
73,60
86,40
74,50
71,20
92,40
81,50
85,30
69,90
84,20
90,70
100,30
Dataseries Z:
99,90
99,80
99,80
100,30
99,90
99,90
100,00
100,10
100,10
100,20
100,30
100,60
100,00
100,10
100,20
100,00
100,10
100,10
100,10
100,50
100,50
100,50
96,30
96,30
96,80
96,80
96,90
96,80
96,80
96,80
96,80
97,00
97,00
97,00
96,80
96,90
97,20
97,30
97,30
97,20
97,30
97,30
97,30
97,30
97,30
97,30
98,10
96,80
96,80
96,80
96,80
96,80
96,80
96,80
96,80
96,80
96,80
96,80
96,90
97,10
97,10


Summary of computational transaction
Raw Inputview raw input (R code)
Raw Outputview raw output of R engine
Computing time5 seconds
R Server'Sir Ronald Aylmer Fisher' @ 193.190.124.24

\begin{tabular}{lllllllll}
\hline
Summary of computational transaction \tabularnewline
Raw Input & view raw input (R code)  \tabularnewline
Raw Output & view raw output of R engine  \tabularnewline
Computing time & 5 seconds \tabularnewline
R Server & 'Sir Ronald Aylmer Fisher' @ 193.190.124.24 \tabularnewline
\hline
\end{tabular}
%Source: https://freestatistics.org/blog/index.php?pk=23590&T=0

[TABLE]
[ROW][C]Summary of computational transaction[/C][/ROW]
[ROW][C]Raw Input[/C][C]view raw input (R code) [/C][/ROW]
[ROW][C]Raw Output[/C][C]view raw output of R engine [/C][/ROW]
[ROW][C]Computing time[/C][C]5 seconds[/C][/ROW]
[ROW][C]R Server[/C][C]'Sir Ronald Aylmer Fisher' @ 193.190.124.24[/C][/ROW]
[/TABLE]
Source: https://freestatistics.org/blog/index.php?pk=23590&T=0

Globally Unique Identifier (entire table): ba.freestatistics.org/blog/index.php?pk=23590&T=0

As an alternative you can also use a QR Code:  

The GUIDs for individual cells are displayed in the table below:

Summary of computational transaction
Raw Inputview raw input (R code)
Raw Outputview raw output of R engine
Computing time5 seconds
R Server'Sir Ronald Aylmer Fisher' @ 193.190.124.24


Parameters (Session):
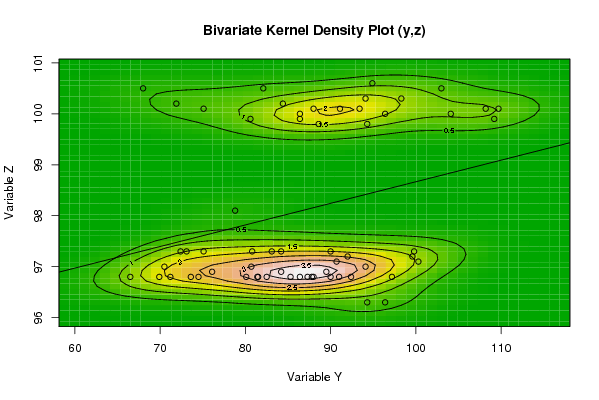
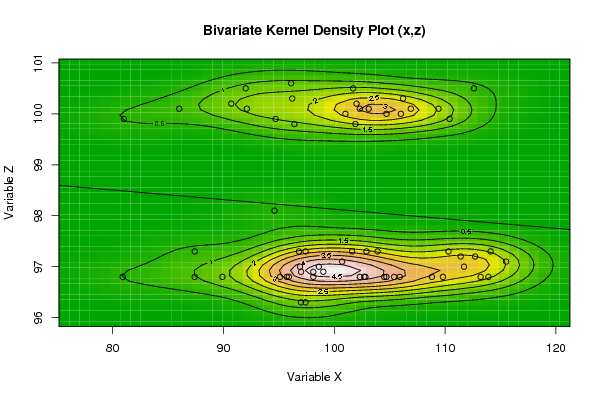
par1 = 50 ; par2 = 50 ; par3 = Y ; par4 = Y ; par5 = Variable X ; par6 = Variable Y ; par7 = Variable Z ;
Parameters (R input):
par1 = 50 ; par2 = 50 ; par3 = Y ; par4 = Y ; par5 = Variable X ; par6 = Variable Y ; par7 = Variable Z ;
R code (references can be found in the software module):
x <- array(x,dim=c(length(x),1))
colnames(x) <- par5
y <- array(y,dim=c(length(y),1))
colnames(y) <- par6
z <- array(z,dim=c(length(z),1))
colnames(z) <- par7
d <- data.frame(cbind(z,y,x))
colnames(d) <- list(par7,par6,par5)
par1 <- as.numeric(par1)
par2 <- as.numeric(par2)
if (par1>500) par1 <- 500
if (par2>500) par2 <- 500
if (par1<10) par1 <- 10
if (par2<10) par2 <- 10
library(GenKern)
library(lattice)
panel.hist <- function(x, ...)
{
usr <- par('usr'); on.exit(par(usr))
par(usr = c(usr[1:2], 0, 1.5) )
h <- hist(x, plot = FALSE)
breaks <- h$breaks; nB <- length(breaks)
y <- h$counts; y <- y/max(y)
rect(breaks[-nB], 0, breaks[-1], y, col='black', ...)
}
bitmap(file='cloud1.png')
cloud(z~x*y, screen = list(x=-45, y=45, z=35),xlab=par5,ylab=par6,zlab=par7)
dev.off()
bitmap(file='cloud2.png')
cloud(z~x*y, screen = list(x=35, y=45, z=25),xlab=par5,ylab=par6,zlab=par7)
dev.off()
bitmap(file='cloud3.png')
cloud(z~x*y, screen = list(x=35, y=-25, z=90),xlab=par5,ylab=par6,zlab=par7)
dev.off()
bitmap(file='pairs.png')
pairs(d,diag.panel=panel.hist)
dev.off()
x <- as.vector(x)
y <- as.vector(y)
z <- as.vector(z)
bitmap(file='bidensity1.png')
op <- KernSur(x,y, xgridsize=par1, ygridsize=par2, correlation=cor(x,y), xbandwidth=dpik(x), ybandwidth=dpik(y))
image(op$xords, op$yords, op$zden, col=terrain.colors(100), axes=TRUE,main='Bivariate Kernel Density Plot (x,y)',xlab=par5,ylab=par6)
if (par3=='Y') contour(op$xords, op$yords, op$zden, add=TRUE)
if (par4=='Y') points(x,y)
(r<-lm(y ~ x))
abline(r)
box()
dev.off()
bitmap(file='bidensity2.png')
op <- KernSur(y,z, xgridsize=par1, ygridsize=par2, correlation=cor(y,z), xbandwidth=dpik(y), ybandwidth=dpik(z))
op
image(op$xords, op$yords, op$zden, col=terrain.colors(100), axes=TRUE,main='Bivariate Kernel Density Plot (y,z)',xlab=par6,ylab=par7)
if (par3=='Y') contour(op$xords, op$yords, op$zden, add=TRUE)
if (par4=='Y') points(y,z)
(r<-lm(z ~ y))
abline(r)
box()
dev.off()
bitmap(file='bidensity3.png')
op <- KernSur(x,z, xgridsize=par1, ygridsize=par2, correlation=cor(x,z), xbandwidth=dpik(x), ybandwidth=dpik(z))
op
image(op$xords, op$yords, op$zden, col=terrain.colors(100), axes=TRUE,main='Bivariate Kernel Density Plot (x,z)',xlab=par5,ylab=par7)
if (par3=='Y') contour(op$xords, op$yords, op$zden, add=TRUE)
if (par4=='Y') points(x,z)
(r<-lm(z ~ x))
abline(r)
box()
dev.off()