Free Statistics

of Irreproducible Research!

Author's title

Author*Unverified author*
R Software Modulerwasp_hierarchicalclustering.wasp
Title produced by softwareHierarchical Clustering
Date of computationTue, 11 Nov 2008 04:00:46 -0700
Cite this page as followsStatistical Computations at FreeStatistics.org, Office for Research Development and Education, URL https://freestatistics.org/blog/index.php?v=date/2008/Nov/11/t12264014249i9112xt9pfs4w0.htm/, Retrieved Mon, 20 May 2024 11:07:24 +0000
Statistical Computations at FreeStatistics.org, Office for Research Development and Education, URL https://freestatistics.org/blog/index.php?pk=23309, Retrieved Mon, 20 May 2024 11:07:24 +0000
QR Codes:

Original text written by user:
IsPrivate?No (this computation is public)
User-defined keywords
Estimated Impact133
Family? (F = Feedback message, R = changed R code, M = changed R Module, P = changed Parameters, D = changed Data)
F       [Hierarchical Clustering] [Hierarchical Clus...] [2008-11-11 11:00:46] [3b916296c2d2371d528ff188880e3d2b] [Current]
F   PD    [Hierarchical Clustering] [hierarchical clus...] [2008-11-12 18:58:10] [0e5eff269cdcaf8789c45b6ee36b0c3d]
Feedback Forum
2008-11-22 13:51:02 [An Knapen] [reply
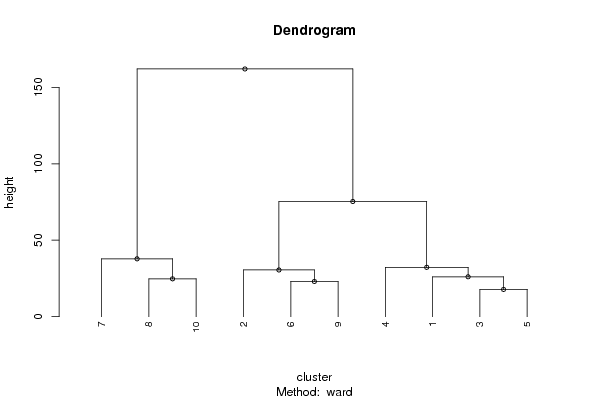
Door middel van een dendrogram worden er groepen gemaakt die gelijkaardige kenmerken vertonen. De tijdreeksen worden ingedeeld in verschillende groepen, het begint bij 2, deze worden dan opnieuw verdeeld,… tot je uiteindelijk een heleboel vertakkingen krijgt. We kunnen duidelijk opmerken dat de eerste indeling zorgt de opslitsing in een grote en een kleine groep.
De grote groep wordt vervolgens opnieuw opgesplits in twee kleinere groepen.

2008-11-23 13:53:41 [Nathalie Daneels] [reply
Evaluatie opdracht 3 - Blok 8 (Q2)
De student heeft enkel theorie geschreven over het dendrogram, maar voor de rest geen conclusie.

Dit zou een mogelijke conclusie kunnen zijn:
We produceren een dendrogram om een antwoord te kunnen formuleren op de vraag: Kunnen er in periodes groepen gemaakt worden die gelijkaardig zijn?
Een dendogram wordt op de volgende manier 'gemaakt': De tijdreeks wordt eerst opgesplitst in 2 delen (2 vertakkingen vanuit 1 knooppunt) en wordt dan telkens verderop gesplitst totdat er telkens nog maar 1 maand overblijft. Elke vertakking/cluster geeft de periodes weer die gelijkaardig zijn.
Als we deze informatie toepassen op de gegevens van de student, kunnen we vaststellen dat de tijdreeks (de perioden) eerder random verdeeld zijn. Dit betekent dat we geen 'vast' patroon kunnen waarnemen tussen de clusters of met andere woorden dat er niet echt periodes zijn die gelijkaardig zijn en dus allemaal in dezelfde cluster zitten. Bijvoorbeeld als men een tijdreeks heeft van 18 maanden. En de eerste 7 maanden bevinden zich allemaal in de eerste cluster en de overige maanden in de tweede cluster. Dan kunnen we wel vaststellen dat er een verandering heeft opgetreden na de zevende maand en kunnen we op zoek gaan naar een patroon voor de periodes die gelijkaardig zijn en dus in dezelfde cluster zitten.
We kunnen wel opmerken bij de dendrogram van de student dat de periodes die beginnen met het cijfer 7 enkel in de tweede cluster voorkomen. En dat de periodes 1 tot en met 9 enkel in de eerste cluster voorkomen. Voor de rest zijn de periodes eigenlijk willekeurig verdeeld. Voor deze periodes kunnen we dus stellen dat ze gelijkaardig zijn.

Post a new message
Dataseries X:
97.3	93.5	105.5	96.5
101	94.7	106.4	97.3
113.2	112.9	117.9	122
101	99.2	89.7	91
105.7	105.6	88.5	107.9
113.9	113	106.4	114.6
86.4	83.1	61.4	98
96.5	81.1	92.3	95.5
103.3	96.9	95.5	98.7
114.9	104.3	92.5	115.9
105.8	97.7	89.6	110.4
94.2	102.6	84.3	109.5
98.4	89.9	76.3	92.3
99.4	96	80.7	102.1
108.8	112.7	96.3	112.8
112.6	107.1	81	110.2
104.4	106.2	82.9	98.9
112.2	121	90.3	119
81.1	101.2	74.8	104.3
97.1	83.2	70.1	98.8
112.6	105.1	86.7	109.4
113.8	113.3	86.4	170.3
107.8	99.1	89.9	118
103.2	100.3	88.1	116.9
103.3	93.5	78.8	111.7
101.2	98.8	81.1	116.8
107.7	106.2	85.4	116.1
110.4	98.3	82.6	114.8
101.9	102.1	80.3	110.8
115.9	117.1	81.2	122.8
89.9	101.5	68	104.7
88.6	80.5	67.4	86
117.2	105.9	91.3	127.2
123.9	109.5	94.9	126.1
100	97.2	82.8	114.6
103.6	114.5	88.6	127.8
94.1	93.5	73.1	105.2
98.7	100.9	76.7	113.1
119.5	121.1	93.2	161
112.7	116.5	84.9	126.9
104.4	109.3	83.8	117.7
124.7	118.1	93.5	144.9
89.1	108.3	91.9	119.4
97	105.4	69.6	107.1
121.6	116.2	87	142.8
118.8	111.2	90.2	126.2
114	105.8	82.7	126.9
111.5	122.7	91.4	179.2
97.2	99.5	74.6	105.3
102.5	107.9	76.1	114.8
113.4	124.6	87.1	125.4
109.8	115	78.4	113.2
104.9	110.3	81.3	134.4
126.1	132.7	99.3	150
80	99.7	71	100.9
96.8	96.5	73.2	101.8
117.2	118.7	95.6	137.7
112.3	112.9	84	138.7
117.3	130.5	90.8	135.4
111.1	137.9	93.6	153.8
102.2	115	80.9	119.5
104.3	116.8	84.4	123.3
122.9	140.9	97.3	166.4
107.6	120.7	83.5	137.5
121.3	134.2	88.8	142.2
131.5	147.3	100.7	167
89	112.4	69.4	112.3
104.4	107.1	74.6	120.6
128.9	128.4	96.6	154.9
135.9	137.7	96.6	153.4
133.3	135	93.1	156.2
121.3	151	91.8	175.8
120.5	137.4	85.7	131.7
120.4	132.4	79.1	130.1
137.9	161.3	91.3	161.1
126.1	139.8	84.2	128.2
133.2	146	85.8	140.3
151.1	166.5	94.6	174.9
105	143.3	77.1	111.8
119	121	76.5	136.6
140.4	152.6	89.7	166.1
156.6	154.4	103.6	159.4
137.1	154.6	100	168.2
122.7	158	96.6	154.6


Summary of computational transaction
Raw Inputview raw input (R code)
Raw Outputview raw output of R engine
Computing time4 seconds
R Server'George Udny Yule' @ 72.249.76.132

\begin{tabular}{lllllllll}
\hline
Summary of computational transaction \tabularnewline
Raw Input & view raw input (R code)  \tabularnewline
Raw Output & view raw output of R engine  \tabularnewline
Computing time & 4 seconds \tabularnewline
R Server & 'George Udny Yule' @ 72.249.76.132 \tabularnewline
\hline
\end{tabular}
%Source: https://freestatistics.org/blog/index.php?pk=23309&T=0

[TABLE]
[ROW][C]Summary of computational transaction[/C][/ROW]
[ROW][C]Raw Input[/C][C]view raw input (R code) [/C][/ROW]
[ROW][C]Raw Output[/C][C]view raw output of R engine [/C][/ROW]
[ROW][C]Computing time[/C][C]4 seconds[/C][/ROW]
[ROW][C]R Server[/C][C]'George Udny Yule' @ 72.249.76.132[/C][/ROW]
[/TABLE]
Source: https://freestatistics.org/blog/index.php?pk=23309&T=0

Globally Unique Identifier (entire table): ba.freestatistics.org/blog/index.php?pk=23309&T=0

As an alternative you can also use a QR Code:  

The GUIDs for individual cells are displayed in the table below:

Summary of computational transaction
Raw Inputview raw input (R code)
Raw Outputview raw output of R engine
Computing time4 seconds
R Server'George Udny Yule' @ 72.249.76.132


Summary of Dendrogram
LabelHeight
13.42490875790874
24.07185461430047
34.83425278610873
45.06162029393751
55.20096144957834
65.42770669804476
75.47083174663597
85.7323642591866
95.8429444631966
105.86003412959344
116.09343909463285
126.33561362458286
136.41092816992985
146.51996388168818
157.18470597867442
167.5914425506619
177.73821684886124
188.09938269252664
198.35942581760254
208.50780406844028
218.59883713068226
228.8495476786472
238.94035793466904
249.1989129792601
259.30483745156248
2610.0647700592165
2710.1498768338859
2810.1739864360043
2910.2004898382589
3010.2231087223271
3110.4347668272364
3210.4642247682282
3310.7609056860358
3411.2814006222632
3511.4608027642046
3611.9737990389705
3712.8903416743467
3813.0321193346946
3913.0818322731710
4013.1688210771077
4113.2056920815861
4213.8419651783986
4313.9519397759106
4414.0662717164144
4514.3299579684984
4614.7927284330718
4714.9392101531507
4815.2363221047147
4915.7475997770911
5017.4925758107547
5118.6854260533227
5219.0527337526540
5319.3214701101887
5420.7403782816229
5521.2335085226022
5621.5138443692751
5722.3138970150890
5823.4138847695123
5923.9686294558721
6024.0262986291667
6124.200498182342
6225.4214692758231
6325.6907921049861
6428.1760936307079
6532.557869096833
6633.6692528464547
6734.0737556766259
6834.4511742294636
6934.6586917554746
7044.8792610134792
7150.3539838950428
7254.6776448873855
7356.2050076936645
7456.8333786129471
7570.7948423759706
7672.1517854488152
7783.415108412949
78115.439762089984
79116.135537296676
80122.207831290847
81213.422176127059
82420.210761664436
831134.39907550252

\begin{tabular}{lllllllll}
\hline
Summary of Dendrogram \tabularnewline
Label & Height \tabularnewline
1 & 3.42490875790874 \tabularnewline
2 & 4.07185461430047 \tabularnewline
3 & 4.83425278610873 \tabularnewline
4 & 5.06162029393751 \tabularnewline
5 & 5.20096144957834 \tabularnewline
6 & 5.42770669804476 \tabularnewline
7 & 5.47083174663597 \tabularnewline
8 & 5.7323642591866 \tabularnewline
9 & 5.8429444631966 \tabularnewline
10 & 5.86003412959344 \tabularnewline
11 & 6.09343909463285 \tabularnewline
12 & 6.33561362458286 \tabularnewline
13 & 6.41092816992985 \tabularnewline
14 & 6.51996388168818 \tabularnewline
15 & 7.18470597867442 \tabularnewline
16 & 7.5914425506619 \tabularnewline
17 & 7.73821684886124 \tabularnewline
18 & 8.09938269252664 \tabularnewline
19 & 8.35942581760254 \tabularnewline
20 & 8.50780406844028 \tabularnewline
21 & 8.59883713068226 \tabularnewline
22 & 8.8495476786472 \tabularnewline
23 & 8.94035793466904 \tabularnewline
24 & 9.1989129792601 \tabularnewline
25 & 9.30483745156248 \tabularnewline
26 & 10.0647700592165 \tabularnewline
27 & 10.1498768338859 \tabularnewline
28 & 10.1739864360043 \tabularnewline
29 & 10.2004898382589 \tabularnewline
30 & 10.2231087223271 \tabularnewline
31 & 10.4347668272364 \tabularnewline
32 & 10.4642247682282 \tabularnewline
33 & 10.7609056860358 \tabularnewline
34 & 11.2814006222632 \tabularnewline
35 & 11.4608027642046 \tabularnewline
36 & 11.9737990389705 \tabularnewline
37 & 12.8903416743467 \tabularnewline
38 & 13.0321193346946 \tabularnewline
39 & 13.0818322731710 \tabularnewline
40 & 13.1688210771077 \tabularnewline
41 & 13.2056920815861 \tabularnewline
42 & 13.8419651783986 \tabularnewline
43 & 13.9519397759106 \tabularnewline
44 & 14.0662717164144 \tabularnewline
45 & 14.3299579684984 \tabularnewline
46 & 14.7927284330718 \tabularnewline
47 & 14.9392101531507 \tabularnewline
48 & 15.2363221047147 \tabularnewline
49 & 15.7475997770911 \tabularnewline
50 & 17.4925758107547 \tabularnewline
51 & 18.6854260533227 \tabularnewline
52 & 19.0527337526540 \tabularnewline
53 & 19.3214701101887 \tabularnewline
54 & 20.7403782816229 \tabularnewline
55 & 21.2335085226022 \tabularnewline
56 & 21.5138443692751 \tabularnewline
57 & 22.3138970150890 \tabularnewline
58 & 23.4138847695123 \tabularnewline
59 & 23.9686294558721 \tabularnewline
60 & 24.0262986291667 \tabularnewline
61 & 24.200498182342 \tabularnewline
62 & 25.4214692758231 \tabularnewline
63 & 25.6907921049861 \tabularnewline
64 & 28.1760936307079 \tabularnewline
65 & 32.557869096833 \tabularnewline
66 & 33.6692528464547 \tabularnewline
67 & 34.0737556766259 \tabularnewline
68 & 34.4511742294636 \tabularnewline
69 & 34.6586917554746 \tabularnewline
70 & 44.8792610134792 \tabularnewline
71 & 50.3539838950428 \tabularnewline
72 & 54.6776448873855 \tabularnewline
73 & 56.2050076936645 \tabularnewline
74 & 56.8333786129471 \tabularnewline
75 & 70.7948423759706 \tabularnewline
76 & 72.1517854488152 \tabularnewline
77 & 83.415108412949 \tabularnewline
78 & 115.439762089984 \tabularnewline
79 & 116.135537296676 \tabularnewline
80 & 122.207831290847 \tabularnewline
81 & 213.422176127059 \tabularnewline
82 & 420.210761664436 \tabularnewline
83 & 1134.39907550252 \tabularnewline
\hline
\end{tabular}
%Source: https://freestatistics.org/blog/index.php?pk=23309&T=1

[TABLE]
[ROW][C]Summary of Dendrogram[/C][/ROW]
[ROW][C]Label[/C][C]Height[/C][/ROW]
[ROW][C]1[/C][C]3.42490875790874[/C][/ROW]
[ROW][C]2[/C][C]4.07185461430047[/C][/ROW]
[ROW][C]3[/C][C]4.83425278610873[/C][/ROW]
[ROW][C]4[/C][C]5.06162029393751[/C][/ROW]
[ROW][C]5[/C][C]5.20096144957834[/C][/ROW]
[ROW][C]6[/C][C]5.42770669804476[/C][/ROW]
[ROW][C]7[/C][C]5.47083174663597[/C][/ROW]
[ROW][C]8[/C][C]5.7323642591866[/C][/ROW]
[ROW][C]9[/C][C]5.8429444631966[/C][/ROW]
[ROW][C]10[/C][C]5.86003412959344[/C][/ROW]
[ROW][C]11[/C][C]6.09343909463285[/C][/ROW]
[ROW][C]12[/C][C]6.33561362458286[/C][/ROW]
[ROW][C]13[/C][C]6.41092816992985[/C][/ROW]
[ROW][C]14[/C][C]6.51996388168818[/C][/ROW]
[ROW][C]15[/C][C]7.18470597867442[/C][/ROW]
[ROW][C]16[/C][C]7.5914425506619[/C][/ROW]
[ROW][C]17[/C][C]7.73821684886124[/C][/ROW]
[ROW][C]18[/C][C]8.09938269252664[/C][/ROW]
[ROW][C]19[/C][C]8.35942581760254[/C][/ROW]
[ROW][C]20[/C][C]8.50780406844028[/C][/ROW]
[ROW][C]21[/C][C]8.59883713068226[/C][/ROW]
[ROW][C]22[/C][C]8.8495476786472[/C][/ROW]
[ROW][C]23[/C][C]8.94035793466904[/C][/ROW]
[ROW][C]24[/C][C]9.1989129792601[/C][/ROW]
[ROW][C]25[/C][C]9.30483745156248[/C][/ROW]
[ROW][C]26[/C][C]10.0647700592165[/C][/ROW]
[ROW][C]27[/C][C]10.1498768338859[/C][/ROW]
[ROW][C]28[/C][C]10.1739864360043[/C][/ROW]
[ROW][C]29[/C][C]10.2004898382589[/C][/ROW]
[ROW][C]30[/C][C]10.2231087223271[/C][/ROW]
[ROW][C]31[/C][C]10.4347668272364[/C][/ROW]
[ROW][C]32[/C][C]10.4642247682282[/C][/ROW]
[ROW][C]33[/C][C]10.7609056860358[/C][/ROW]
[ROW][C]34[/C][C]11.2814006222632[/C][/ROW]
[ROW][C]35[/C][C]11.4608027642046[/C][/ROW]
[ROW][C]36[/C][C]11.9737990389705[/C][/ROW]
[ROW][C]37[/C][C]12.8903416743467[/C][/ROW]
[ROW][C]38[/C][C]13.0321193346946[/C][/ROW]
[ROW][C]39[/C][C]13.0818322731710[/C][/ROW]
[ROW][C]40[/C][C]13.1688210771077[/C][/ROW]
[ROW][C]41[/C][C]13.2056920815861[/C][/ROW]
[ROW][C]42[/C][C]13.8419651783986[/C][/ROW]
[ROW][C]43[/C][C]13.9519397759106[/C][/ROW]
[ROW][C]44[/C][C]14.0662717164144[/C][/ROW]
[ROW][C]45[/C][C]14.3299579684984[/C][/ROW]
[ROW][C]46[/C][C]14.7927284330718[/C][/ROW]
[ROW][C]47[/C][C]14.9392101531507[/C][/ROW]
[ROW][C]48[/C][C]15.2363221047147[/C][/ROW]
[ROW][C]49[/C][C]15.7475997770911[/C][/ROW]
[ROW][C]50[/C][C]17.4925758107547[/C][/ROW]
[ROW][C]51[/C][C]18.6854260533227[/C][/ROW]
[ROW][C]52[/C][C]19.0527337526540[/C][/ROW]
[ROW][C]53[/C][C]19.3214701101887[/C][/ROW]
[ROW][C]54[/C][C]20.7403782816229[/C][/ROW]
[ROW][C]55[/C][C]21.2335085226022[/C][/ROW]
[ROW][C]56[/C][C]21.5138443692751[/C][/ROW]
[ROW][C]57[/C][C]22.3138970150890[/C][/ROW]
[ROW][C]58[/C][C]23.4138847695123[/C][/ROW]
[ROW][C]59[/C][C]23.9686294558721[/C][/ROW]
[ROW][C]60[/C][C]24.0262986291667[/C][/ROW]
[ROW][C]61[/C][C]24.200498182342[/C][/ROW]
[ROW][C]62[/C][C]25.4214692758231[/C][/ROW]
[ROW][C]63[/C][C]25.6907921049861[/C][/ROW]
[ROW][C]64[/C][C]28.1760936307079[/C][/ROW]
[ROW][C]65[/C][C]32.557869096833[/C][/ROW]
[ROW][C]66[/C][C]33.6692528464547[/C][/ROW]
[ROW][C]67[/C][C]34.0737556766259[/C][/ROW]
[ROW][C]68[/C][C]34.4511742294636[/C][/ROW]
[ROW][C]69[/C][C]34.6586917554746[/C][/ROW]
[ROW][C]70[/C][C]44.8792610134792[/C][/ROW]
[ROW][C]71[/C][C]50.3539838950428[/C][/ROW]
[ROW][C]72[/C][C]54.6776448873855[/C][/ROW]
[ROW][C]73[/C][C]56.2050076936645[/C][/ROW]
[ROW][C]74[/C][C]56.8333786129471[/C][/ROW]
[ROW][C]75[/C][C]70.7948423759706[/C][/ROW]
[ROW][C]76[/C][C]72.1517854488152[/C][/ROW]
[ROW][C]77[/C][C]83.415108412949[/C][/ROW]
[ROW][C]78[/C][C]115.439762089984[/C][/ROW]
[ROW][C]79[/C][C]116.135537296676[/C][/ROW]
[ROW][C]80[/C][C]122.207831290847[/C][/ROW]
[ROW][C]81[/C][C]213.422176127059[/C][/ROW]
[ROW][C]82[/C][C]420.210761664436[/C][/ROW]
[ROW][C]83[/C][C]1134.39907550252[/C][/ROW]
[/TABLE]
Source: https://freestatistics.org/blog/index.php?pk=23309&T=1

Globally Unique Identifier (entire table): ba.freestatistics.org/blog/index.php?pk=23309&T=1

As an alternative you can also use a QR Code:  

The GUIDs for individual cells are displayed in the table below:

Summary of Dendrogram
LabelHeight
13.42490875790874
24.07185461430047
34.83425278610873
45.06162029393751
55.20096144957834
65.42770669804476
75.47083174663597
85.7323642591866
95.8429444631966
105.86003412959344
116.09343909463285
126.33561362458286
136.41092816992985
146.51996388168818
157.18470597867442
167.5914425506619
177.73821684886124
188.09938269252664
198.35942581760254
208.50780406844028
218.59883713068226
228.8495476786472
238.94035793466904
249.1989129792601
259.30483745156248
2610.0647700592165
2710.1498768338859
2810.1739864360043
2910.2004898382589
3010.2231087223271
3110.4347668272364
3210.4642247682282
3310.7609056860358
3411.2814006222632
3511.4608027642046
3611.9737990389705
3712.8903416743467
3813.0321193346946
3913.0818322731710
4013.1688210771077
4113.2056920815861
4213.8419651783986
4313.9519397759106
4414.0662717164144
4514.3299579684984
4614.7927284330718
4714.9392101531507
4815.2363221047147
4915.7475997770911
5017.4925758107547
5118.6854260533227
5219.0527337526540
5319.3214701101887
5420.7403782816229
5521.2335085226022
5621.5138443692751
5722.3138970150890
5823.4138847695123
5923.9686294558721
6024.0262986291667
6124.200498182342
6225.4214692758231
6325.6907921049861
6428.1760936307079
6532.557869096833
6633.6692528464547
6734.0737556766259
6834.4511742294636
6934.6586917554746
7044.8792610134792
7150.3539838950428
7254.6776448873855
7356.2050076936645
7456.8333786129471
7570.7948423759706
7672.1517854488152
7783.415108412949
78115.439762089984
79116.135537296676
80122.207831290847
81213.422176127059
82420.210761664436
831134.39907550252


Summary of Cut Dendrogram
LabelHeight
117.8014480315073
223.0066215057009
324.7485795046908
426.0836514352437
530.5408773027900
632.2697581807124
737.848037318212
875.339799576612
9162.075404491801

\begin{tabular}{lllllllll}
\hline
Summary of Cut Dendrogram \tabularnewline
Label & Height \tabularnewline
1 & 17.8014480315073 \tabularnewline
2 & 23.0066215057009 \tabularnewline
3 & 24.7485795046908 \tabularnewline
4 & 26.0836514352437 \tabularnewline
5 & 30.5408773027900 \tabularnewline
6 & 32.2697581807124 \tabularnewline
7 & 37.848037318212 \tabularnewline
8 & 75.339799576612 \tabularnewline
9 & 162.075404491801 \tabularnewline
\hline
\end{tabular}
%Source: https://freestatistics.org/blog/index.php?pk=23309&T=2

[TABLE]
[ROW][C]Summary of Cut Dendrogram[/C][/ROW]
[ROW][C]Label[/C][C]Height[/C][/ROW]
[ROW][C]1[/C][C]17.8014480315073[/C][/ROW]
[ROW][C]2[/C][C]23.0066215057009[/C][/ROW]
[ROW][C]3[/C][C]24.7485795046908[/C][/ROW]
[ROW][C]4[/C][C]26.0836514352437[/C][/ROW]
[ROW][C]5[/C][C]30.5408773027900[/C][/ROW]
[ROW][C]6[/C][C]32.2697581807124[/C][/ROW]
[ROW][C]7[/C][C]37.848037318212[/C][/ROW]
[ROW][C]8[/C][C]75.339799576612[/C][/ROW]
[ROW][C]9[/C][C]162.075404491801[/C][/ROW]
[/TABLE]
Source: https://freestatistics.org/blog/index.php?pk=23309&T=2

Globally Unique Identifier (entire table): ba.freestatistics.org/blog/index.php?pk=23309&T=2

As an alternative you can also use a QR Code:  

The GUIDs for individual cells are displayed in the table below:

Summary of Cut Dendrogram
LabelHeight
117.8014480315073
223.0066215057009
324.7485795046908
426.0836514352437
530.5408773027900
632.2697581807124
737.848037318212
875.339799576612
9162.075404491801


Parameters (Session):
par1 = ward ; par2 = 10 ; par3 = FALSE ; par4 = FALSE ;
Parameters (R input):
par1 = ward ; par2 = 10 ; par3 = FALSE ; par4 = FALSE ;
R code (references can be found in the software module):
par3 <- as.logical(par3)
par4 <- as.logical(par4)
if (par3 == 'TRUE'){
dum = xlab
xlab = ylab
ylab = dum
}
x <- t(y)
hc <- hclust(dist(x),method=par1)
d <- as.dendrogram(hc)
str(d)
mysub <- paste('Method: ',par1)
bitmap(file='test1.png')
if (par4 == 'TRUE'){
plot(d,main=main,ylab=ylab,xlab=xlab,horiz=par3, nodePar=list(pch = c(1,NA), cex=0.8, lab.cex = 0.8),type='t',center=T, sub=mysub)
} else {
plot(d,main=main,ylab=ylab,xlab=xlab,horiz=par3, nodePar=list(pch = c(1,NA), cex=0.8, lab.cex = 0.8), sub=mysub)
}
dev.off()
if (par2 != 'ALL'){
if (par3 == 'TRUE'){
ylab = 'cluster'
} else {
xlab = 'cluster'
}
par2 <- as.numeric(par2)
memb <- cutree(hc, k = par2)
cent <- NULL
for(k in 1:par2){
cent <- rbind(cent, colMeans(x[memb == k, , drop = FALSE]))
}
hc1 <- hclust(dist(cent),method=par1, members = table(memb))
de <- as.dendrogram(hc1)
bitmap(file='test2.png')
if (par4 == 'TRUE'){
plot(de,main=main,ylab=ylab,xlab=xlab,horiz=par3, nodePar=list(pch = c(1,NA), cex=0.8, lab.cex = 0.8),type='t',center=T, sub=mysub)
} else {
plot(de,main=main,ylab=ylab,xlab=xlab,horiz=par3, nodePar=list(pch = c(1,NA), cex=0.8, lab.cex = 0.8), sub=mysub)
}
dev.off()
str(de)
}
load(file='createtable')
a<-table.start()
a<-table.row.start(a)
a<-table.element(a,'Summary of Dendrogram',2,TRUE)
a<-table.row.end(a)
a<-table.row.start(a)
a<-table.element(a,'Label',header=TRUE)
a<-table.element(a,'Height',header=TRUE)
a<-table.row.end(a)
num <- length(x[,1])-1
for (i in 1:num)
{
a<-table.row.start(a)
a<-table.element(a,hc$labels[i])
a<-table.element(a,hc$height[i])
a<-table.row.end(a)
}
a<-table.end(a)
table.save(a,file='mytable1.tab')
if (par2 != 'ALL'){
a<-table.start()
a<-table.row.start(a)
a<-table.element(a,'Summary of Cut Dendrogram',2,TRUE)
a<-table.row.end(a)
a<-table.row.start(a)
a<-table.element(a,'Label',header=TRUE)
a<-table.element(a,'Height',header=TRUE)
a<-table.row.end(a)
num <- par2-1
for (i in 1:num)
{
a<-table.row.start(a)
a<-table.element(a,i)
a<-table.element(a,hc1$height[i])
a<-table.row.end(a)
}
a<-table.end(a)
table.save(a,file='mytable2.tab')
}