Free Statistics

of Irreproducible Research!

Author's title

Author*The author of this computation has been verified*
R Software Modulerwasp_cloud.wasp
Title produced by softwareTrivariate Scatterplots
Date of computationMon, 10 Nov 2008 03:20:12 -0700
Cite this page as followsStatistical Computations at FreeStatistics.org, Office for Research Development and Education, URL https://freestatistics.org/blog/index.php?v=date/2008/Nov/10/t1226312548nvtnqh8kof2i552.htm/, Retrieved Mon, 20 May 2024 09:28:58 +0000
Statistical Computations at FreeStatistics.org, Office for Research Development and Education, URL https://freestatistics.org/blog/index.php?pk=22907, Retrieved Mon, 20 May 2024 09:28:58 +0000
QR Codes:

Original text written by user:
IsPrivate?No (this computation is public)
User-defined keywordsBert Moons, Trivariate Scatterplot, inflatie
Estimated Impact216
Family? (F = Feedback message, R = changed R code, M = changed R Module, P = changed Parameters, D = changed Data)
F       [Trivariate Scatterplots] [Bert Moons Trivar...] [2008-11-10 10:20:12] [1828943283e41f5e3270e2e73d6433b4] [Current]
Feedback Forum
2008-11-19 17:33:08 [Toon Wouters] [reply
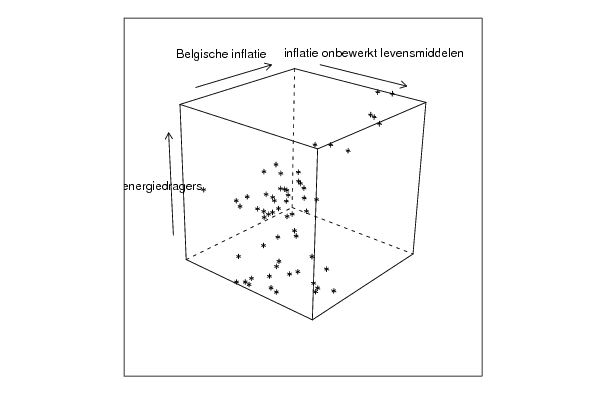
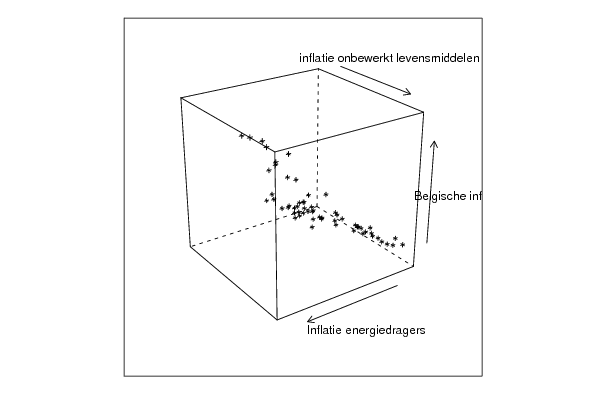
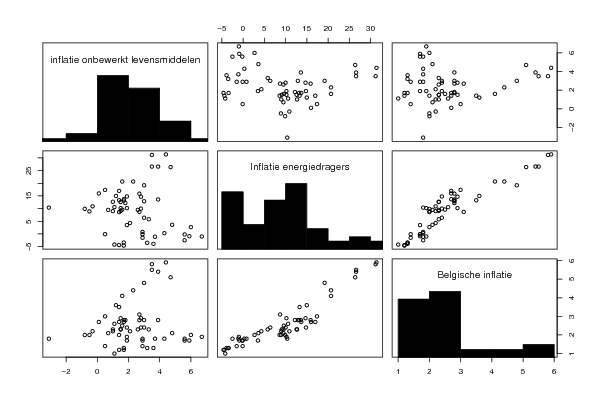
Bij het berekenen van de trivariate scatterplot is het belangrijk te zien naar de 3-dimensionale scatterplots en de 2-dimensionale scatterplot. Via de 3-dimensionale scatterplot kunnen we het verband nagaan van 3 variabelen te gelijkertijd. In de kubus die je in je word-doc hebt gebruikt kunnen we zien dat er zich een grote puntenwolk in het vlak van Belgische inflatie en inflatie energiedragers en is er misschien wel sprake van een verband. In de 2-dimensionale scatterplot stellen we dit ook vast en is er bijna sprake van een lineaire verband maar deze scatterplot kan vertekend zijn omdat er dingens worden uitgelaten
2008-11-20 15:28:16 [Natalie De Wilde] [reply
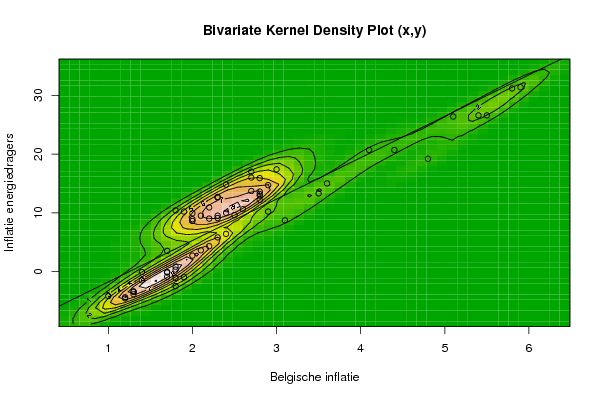
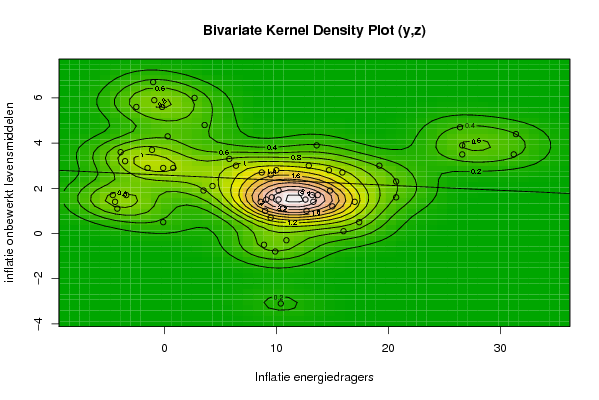
De trivariate scatterplot probeert een driedimensioneel beeld te geven van het verband tussen de drie variabelen. Deze gaat deels verloren omdat je het bekijkt op een 2dimensioneel scherm. Daarom wordt ook hier de bivariate kernel density plot weergegeven, die ook het verband probeer weer te geven.
Het is duidelijk dat er een verband is tussen de Belgische inflatie en de inflatie van de energiedragers, dit is af te leiden uit de scatterplots, er is een lineair stijgend verband.Uit de bivariate kernel density plots lijkt er niet echt een verband te bestaan tussen de inflatie van onbewerkte levensmiddelen en de andere twee variabelen.
2008-11-24 18:31:31 [Sören Van Donink] [reply
In de drie dimensionale scatterplot kunnen we het verband nagaan van 3 variabelen te gelijkertijd. Bij jouw oplossing zien we een grote puntenwolk in het vlak van Belgische inflatie en inflatie energiedragers. Dit zou kunnen wijzen op een verband. Dit verband vinden we ook terug in de tweedimensionale weergave.
2008-11-24 20:26:33 [Vincent Vanden Poel] [reply
Een trivariate scatterplot toont ons het verband tussen 3 variabelen tegelijk. Een nadeel is dat een deel van de transformatie verloren gaat doordat een 3D figuur geprojecteerd wordt op een 2D scherm. Naargelang de rotatie, invalshoeken zie je andere trends. De projectie van deze kubus zijn de scatterplots. Deze kunnen vertekend zijn omdat bepaalde lengtes gereduceerd worden. In dit geval zien we dezelfde puntenwolk in de 3D en 2D figuren.

Post a new message
Dataseries X:
4.8
5.5
5.4
5.9
5.8
5.1
4.1
4.4
3.6
3.5
3.1
2.9
2.2
1.4
1.2
1.3
1.3
1.3
1.8
1.8
1.8
1.7
2.1
2
1.7
1.9
2.3
2.4
2.5
2.8
2.6
2.2
2.8
2.8
2.8
2.3
2.2
3
2.9
2.7
2.7
2.3
2.4
2.8
2.3
2
1.9
2.3
2.7
1.8
2
2.1
2
2.4
1.7
1
1.2
1.4
1.7
1.8
Dataseries Y:
19.2
26.6
26.6
31.4
31.2
26.4
20.7
20.7
15
13.3
8.7
10.2
4.3
-0.1
-4.6
-3.9
-3.5
-3.4
-2.5
-1.1
0.3
-0.9
3.6
2.7
-0.2
-1
5.8
6.4
9.6
13.2
10.6
10.9
12.9
15.9
12.2
9.1
9
17.4
14.7
17
13.7
9.5
14.8
13.6
12.6
8.9
10.2
12.7
16
10.4
9.9
9.5
8.6
10
3.5
-4.2
-4.4
-1.5
-0.1
0.8
Dataseries Z:
3
3.5
3.9
4.4
3.5
4.7
1.6
2.3
1.2
1.4
2.7
1.5
2.1
0.5
1.7
3.6
3.2
1.7
5.6
3.7
4.3
5.9
4.8
6
5.6
6.7
3.3
3
1.6
1.7
1.1
-0.3
3
2.7
1.8
1.5
1
0.5
2.8
1.4
1.7
2.6
1.9
3.9
1.5
-0.5
1.9
1
0.1
-3.1
-0.8
0.7
1.4
2.8
1.9
1.1
1.4
2.9
2.9
2.9


Summary of computational transaction
Raw Inputview raw input (R code)
Raw Outputview raw output of R engine
Computing time6 seconds
R Server'Gwilym Jenkins' @ 72.249.127.135

\begin{tabular}{lllllllll}
\hline
Summary of computational transaction \tabularnewline
Raw Input & view raw input (R code)  \tabularnewline
Raw Output & view raw output of R engine  \tabularnewline
Computing time & 6 seconds \tabularnewline
R Server & 'Gwilym Jenkins' @ 72.249.127.135 \tabularnewline
\hline
\end{tabular}
%Source: https://freestatistics.org/blog/index.php?pk=22907&T=0

[TABLE]
[ROW][C]Summary of computational transaction[/C][/ROW]
[ROW][C]Raw Input[/C][C]view raw input (R code) [/C][/ROW]
[ROW][C]Raw Output[/C][C]view raw output of R engine [/C][/ROW]
[ROW][C]Computing time[/C][C]6 seconds[/C][/ROW]
[ROW][C]R Server[/C][C]'Gwilym Jenkins' @ 72.249.127.135[/C][/ROW]
[/TABLE]
Source: https://freestatistics.org/blog/index.php?pk=22907&T=0

Globally Unique Identifier (entire table): ba.freestatistics.org/blog/index.php?pk=22907&T=0

As an alternative you can also use a QR Code:  

The GUIDs for individual cells are displayed in the table below:

Summary of computational transaction
Raw Inputview raw input (R code)
Raw Outputview raw output of R engine
Computing time6 seconds
R Server'Gwilym Jenkins' @ 72.249.127.135


Parameters (Session):
par1 = 50 ; par2 = 50 ; par3 = Y ; par4 = Y ; par5 = Belgische inflatie ; par6 = Inflatie energiedragers ; par7 = inflatie onbewerkt levensmiddelen ;
Parameters (R input):
par1 = 50 ; par2 = 50 ; par3 = Y ; par4 = Y ; par5 = Belgische inflatie ; par6 = Inflatie energiedragers ; par7 = inflatie onbewerkt levensmiddelen ;
R code (references can be found in the software module):
x <- array(x,dim=c(length(x),1))
colnames(x) <- par5
y <- array(y,dim=c(length(y),1))
colnames(y) <- par6
z <- array(z,dim=c(length(z),1))
colnames(z) <- par7
d <- data.frame(cbind(z,y,x))
colnames(d) <- list(par7,par6,par5)
par1 <- as.numeric(par1)
par2 <- as.numeric(par2)
if (par1>500) par1 <- 500
if (par2>500) par2 <- 500
if (par1<10) par1 <- 10
if (par2<10) par2 <- 10
library(GenKern)
library(lattice)
panel.hist <- function(x, ...)
{
usr <- par('usr'); on.exit(par(usr))
par(usr = c(usr[1:2], 0, 1.5) )
h <- hist(x, plot = FALSE)
breaks <- h$breaks; nB <- length(breaks)
y <- h$counts; y <- y/max(y)
rect(breaks[-nB], 0, breaks[-1], y, col='black', ...)
}
bitmap(file='cloud1.png')
cloud(z~x*y, screen = list(x=-45, y=45, z=35),xlab=par5,ylab=par6,zlab=par7)
dev.off()
bitmap(file='cloud2.png')
cloud(z~x*y, screen = list(x=35, y=45, z=25),xlab=par5,ylab=par6,zlab=par7)
dev.off()
bitmap(file='cloud3.png')
cloud(z~x*y, screen = list(x=35, y=-25, z=90),xlab=par5,ylab=par6,zlab=par7)
dev.off()
bitmap(file='pairs.png')
pairs(d,diag.panel=panel.hist)
dev.off()
x <- as.vector(x)
y <- as.vector(y)
z <- as.vector(z)
bitmap(file='bidensity1.png')
op <- KernSur(x,y, xgridsize=par1, ygridsize=par2, correlation=cor(x,y), xbandwidth=dpik(x), ybandwidth=dpik(y))
image(op$xords, op$yords, op$zden, col=terrain.colors(100), axes=TRUE,main='Bivariate Kernel Density Plot (x,y)',xlab=par5,ylab=par6)
if (par3=='Y') contour(op$xords, op$yords, op$zden, add=TRUE)
if (par4=='Y') points(x,y)
(r<-lm(y ~ x))
abline(r)
box()
dev.off()
bitmap(file='bidensity2.png')
op <- KernSur(y,z, xgridsize=par1, ygridsize=par2, correlation=cor(y,z), xbandwidth=dpik(y), ybandwidth=dpik(z))
op
image(op$xords, op$yords, op$zden, col=terrain.colors(100), axes=TRUE,main='Bivariate Kernel Density Plot (y,z)',xlab=par6,ylab=par7)
if (par3=='Y') contour(op$xords, op$yords, op$zden, add=TRUE)
if (par4=='Y') points(y,z)
(r<-lm(z ~ y))
abline(r)
box()
dev.off()
bitmap(file='bidensity3.png')
op <- KernSur(x,z, xgridsize=par1, ygridsize=par2, correlation=cor(x,z), xbandwidth=dpik(x), ybandwidth=dpik(z))
op
image(op$xords, op$yords, op$zden, col=terrain.colors(100), axes=TRUE,main='Bivariate Kernel Density Plot (x,z)',xlab=par5,ylab=par7)
if (par3=='Y') contour(op$xords, op$yords, op$zden, add=TRUE)
if (par4=='Y') points(x,z)
(r<-lm(z ~ x))
abline(r)
box()
dev.off()