Free Statistics

of Irreproducible Research!

Author's title

Author*Unverified author*
R Software Modulerwasp_meanplot.wasp
Title produced by softwareMean Plot
Date of computationWed, 05 Nov 2008 03:39:05 -0700
Cite this page as followsStatistical Computations at FreeStatistics.org, Office for Research Development and Education, URL https://freestatistics.org/blog/index.php?v=date/2008/Nov/05/t1225881577rdbasfg1ydvusve.htm/, Retrieved Mon, 20 May 2024 11:07:29 +0000
Statistical Computations at FreeStatistics.org, Office for Research Development and Education, URL https://freestatistics.org/blog/index.php?pk=21671, Retrieved Mon, 20 May 2024 11:07:29 +0000
QR Codes:

Original text written by user:
IsPrivate?No (this computation is public)
User-defined keywordsjenske_cole@hotmail.com
Estimated Impact209
Family? (F = Feedback message, R = changed R code, M = changed R Module, P = changed Parameters, D = changed Data)
F     [Mean Plot] [workshop 3] [2007-10-26 12:14:28] [e9ffc5de6f8a7be62f22b142b5b6b1a8]
F    D    [Mean Plot] [opdracht 1q2] [2008-11-05 10:39:05] [d41d8cd98f00b204e9800998ecf8427e] [Current]
-    D      [Mean Plot] [paper mean plot] [2008-12-13 11:47:50] [975daa21de49eaf4d491226310243f5a]
Feedback Forum
2008-11-09 16:01:21 [Steven Vercammen] [reply
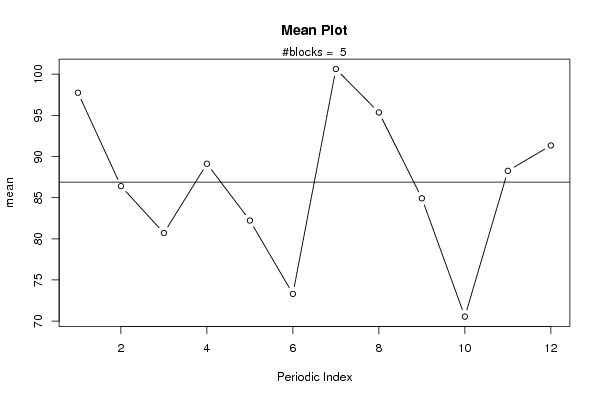
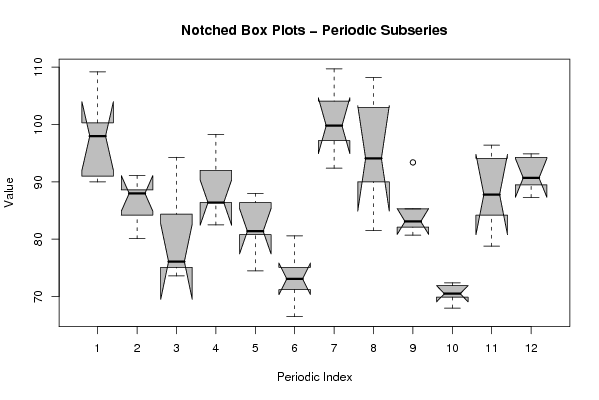
Q2: Deze conclusie klopt niet helemaal. Men moet eerst kijken naar de mean plot waarop elk punt het gemiddelde voorstelt van een bepaalde maand over verschillende jaren heen. Daarop blijkt dat er een sterke stijging is van bv. maand 6 naar maand 7. Daarna controleert men of het over een significant verschil gaat door naar de boxplots te kijken. Wanneer men maand 6 en 7 vergelijkt blijkt duidelijk dat de inkepingen niet overlappen. Men kan hieruit concluderen dat er sprake is van seizoenaliteit.

Q3: Ook hier is de conclusie slechts gedeeltelijk correct. Men moet vermelden waarom men besluit dat de daling niet significant is : nl. de inkepingen overlappen niet. Wanneer men jaar 1 met jaar 5 vergelijkt is er echter sprake van een twijfelgeval dat grafisch moeilijk is waar te nemen. De kans bestaat dat het hier wel om een significante daling gaat.
2008-11-10 09:49:29 [Annelies Lauwen] [reply
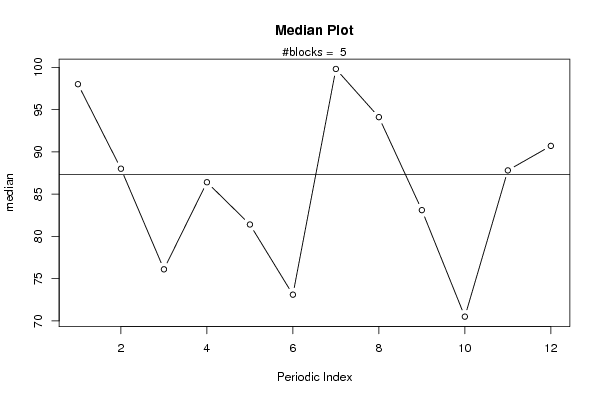
Theorie: Mean plots are used to see if the mean varies between different groups of the data. The grouping is determined by the analyst. In most cases, the data set contains a specific grouping variable. For example, the groups may be the levels of a factor variable. In the sample plot below, the months of the year provide the grouping.
Conclusie bij mean plot: Volgens de mean plot wordt de kledingproductie beïnvloed door seizoenaliteit. In de maanden 1 (maart) en 7(september) wordt er duidelijk meer geproduceerd dan in de maanden 6 (augustus) en 10 (december). Omdat we zeker moeten zijn dat het verschil tussen de gemiddelden groot genoeg is, moeten we ook gebruik maken van de notched boxplots.
conclusie bij notched box plot: Als we de medianen en inkepingen van de maanden met de hoogste en laagste productie vergelijken, kunnen we besluiten dat deze significant verschillen, omdat de inkepingen elkaar niet overlappen. We hebben 95% zekerheid dat het resultaat niet door toeval is ontstaan en we kunnen spreken van seizoenaliteit.
2008-11-10 10:57:10 [Jenske Cole] [reply
Op de mean plot is heel duidelijk te zien dat tussen maand 6 (juni) en maand 7 (juli) een grote stijging plaatsvindt. We kunnen niet op basis van enkel de mean plot vaststellen of er sprake is van seizoenaliteit. Dit is dan ook de reden waarom we een notched boxplot moeten maken omdat we daar de betrouwbaarheid op kunnen aflezen. Op de grafiek is duidelijk merkbaar dat de inkepingen van maand 6 en 7 elkaar niet overlappen, wat betekent dat het verschil significant is. Er is sprake van seizoenaliteit.

Post a new message
Dataseries X:
109.20
88.60
94.30
98.30
86.40
80.60
104.10
108.20
93.40
71.90
94.10
94.90
96.40
91.10
84.40
86.40
88.00
75.10
109.70
103.00
82.10
68.00
96.40
94.30
90.00
88.00
76.10
82.50
81.40
66.50
97.20
94.10
80.70
70.50
87.80
89.50
99.60
84.20
75.10
92.00
80.80
73.10
99.80
90.00
83.10
72.40
78.80
87.30
91.00
80.10
73.60
86.40
74.50
71.20
92.40
81.50
85.30
69.90
84.20
90.70
100.30


Summary of computational transaction
Raw Inputview raw input (R code)
Raw Outputview raw output of R engine
Computing time2 seconds
R Server'Gwilym Jenkins' @ 72.249.127.135

\begin{tabular}{lllllllll}
\hline
Summary of computational transaction \tabularnewline
Raw Input & view raw input (R code)  \tabularnewline
Raw Output & view raw output of R engine  \tabularnewline
Computing time & 2 seconds \tabularnewline
R Server & 'Gwilym Jenkins' @ 72.249.127.135 \tabularnewline
\hline
\end{tabular}
%Source: https://freestatistics.org/blog/index.php?pk=21671&T=0

[TABLE]
[ROW][C]Summary of computational transaction[/C][/ROW]
[ROW][C]Raw Input[/C][C]view raw input (R code) [/C][/ROW]
[ROW][C]Raw Output[/C][C]view raw output of R engine [/C][/ROW]
[ROW][C]Computing time[/C][C]2 seconds[/C][/ROW]
[ROW][C]R Server[/C][C]'Gwilym Jenkins' @ 72.249.127.135[/C][/ROW]
[/TABLE]
Source: https://freestatistics.org/blog/index.php?pk=21671&T=0

Globally Unique Identifier (entire table): ba.freestatistics.org/blog/index.php?pk=21671&T=0

As an alternative you can also use a QR Code:  

The GUIDs for individual cells are displayed in the table below:

Summary of computational transaction
Raw Inputview raw input (R code)
Raw Outputview raw output of R engine
Computing time2 seconds
R Server'Gwilym Jenkins' @ 72.249.127.135


Parameters (Session):
par1 = 12 ;
Parameters (R input):
par1 = 12 ;
R code (references can be found in the software module):
par1 <- as.numeric(par1)
(n <- length(x))
(np <- floor(n / par1))
arr <- array(NA,dim=c(par1,np+1))
ari <- array(0,dim=par1)
j <- 0
for (i in 1:n)
{
j = j + 1
ari[j] = ari[j] + 1
arr[j,ari[j]] <- x[i]
if (j == par1) j = 0
}
ari
arr
arr.mean <- array(NA,dim=par1)
arr.median <- array(NA,dim=par1)
arr.midrange <- array(NA,dim=par1)
for (j in 1:par1)
{
arr.mean[j] <- mean(arr[j,],na.rm=TRUE)
arr.median[j] <- median(arr[j,],na.rm=TRUE)
arr.midrange[j] <- (quantile(arr[j,],0.75,na.rm=TRUE) + quantile(arr[j,],0.25,na.rm=TRUE)) / 2
}
overall.mean <- mean(x)
overall.median <- median(x)
overall.midrange <- (quantile(x,0.75) + quantile(x,0.25)) / 2
bitmap(file='plot1.png')
plot(arr.mean,type='b',ylab='mean',main='Mean Plot',xlab='Periodic Index')
mtext(paste('#blocks = ',np))
abline(overall.mean,0)
dev.off()
bitmap(file='plot2.png')
plot(arr.median,type='b',ylab='median',main='Median Plot',xlab='Periodic Index')
mtext(paste('#blocks = ',np))
abline(overall.median,0)
dev.off()
bitmap(file='plot3.png')
plot(arr.midrange,type='b',ylab='midrange',main='Midrange Plot',xlab='Periodic Index')
mtext(paste('#blocks = ',np))
abline(overall.midrange,0)
dev.off()
bitmap(file='plot4.png')
z <- data.frame(t(arr))
names(z) <- c(1:par1)
(boxplot(z,notch=TRUE,col='grey',xlab='Periodic Index',ylab='Value',main='Notched Box Plots - Periodic Subseries'))
dev.off()
bitmap(file='plot5.png')
z <- data.frame(arr)
names(z) <- c(1:np)
(boxplot(z,notch=TRUE,col='grey',xlab='Block Index',ylab='Value',main='Notched Box Plots - Sequential Blocks'))
dev.off()
bitmap(file='plot6.png')
z <- data.frame(cbind(arr.mean,arr.median,arr.midrange))
names(z) <- list('mean','median','midrange')
(boxplot(z,notch=TRUE,col='grey',ylab='Overall Central Tendency',main='Notched Box Plots'))
dev.off()