Free Statistics

of Irreproducible Research!

Author's title

Author*The author of this computation has been verified*
R Software Modulerwasp_notchedbox1.wasp
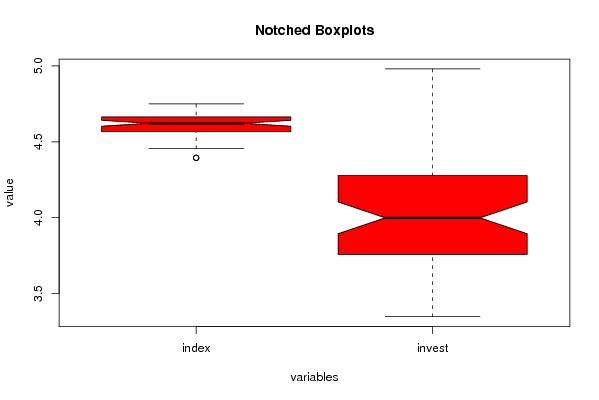
Title produced by softwareNotched Boxplots
Date of computationTue, 04 Nov 2008 12:20:22 -0700
Cite this page as followsStatistical Computations at FreeStatistics.org, Office for Research Development and Education, URL https://freestatistics.org/blog/index.php?v=date/2008/Nov/04/t1225826465t82x5w0n8yp8cen.htm/, Retrieved Mon, 20 May 2024 12:10:50 +0000
Statistical Computations at FreeStatistics.org, Office for Research Development and Education, URL https://freestatistics.org/blog/index.php?pk=21635, Retrieved Mon, 20 May 2024 12:10:50 +0000
QR Codes:

Original text written by user:
IsPrivate?No (this computation is public)
User-defined keywords
Estimated Impact158
Family? (F = Feedback message, R = changed R code, M = changed R Module, P = changed Parameters, D = changed Data)
F     [Mean Plot] [workshop 3] [2007-10-26 12:14:28] [e9ffc5de6f8a7be62f22b142b5b6b1a8]
F RMPD  [Notched Boxplots] [task 3.1] [2008-11-04 19:10:11] [1eab65e90adf64584b8e6f0da23ff414]
F R         [Notched Boxplots] [task 3.2] [2008-11-04 19:20:22] [0458bd763b171003ec052ce63099d477] [Current]
Feedback Forum
2008-11-10 08:13:02 [Jasmine Hendrikx] [reply
Evaluatie task 3

De student maakt hier enkel gebruik van de gegevens van investeringen. Er staat in de opdracht dat je de vorige berekening moet verbeteren, door van de variabele z, log (z) te maken. Dus je moet volgens mij dan gewoon de link van task 2 aanklikken en dan die z veranderen in log z. (je gebruikt dan alle gegevens). Ook noemt de student de eerste notched boxplot in de grafiek ‘index’. Dit is niet zo’n goede naam, aangezien het gaat over de totale productie.
Hieronder zal ik de URL zetten van hetgeen ik denk dat je moet berekenen en dus moet uitkomen:
http://www.freestatistics.org/blog/index.php?v=date/2008/Nov/09/t1226226976cqiu8s2wz71ktid.htm
De student merkt wel correct op dat door log te gebruiken de grote getallen kleiner worden gemaakt, dus dat grote schommelingen naar beneden worden getrokken. Hierbij zou je nog kunnen zeggen dat er een soort afvlakking optreedt en dat de kleine schommelingen hierdoor meer tot uiting komen. Men gaat dus ook de invloed van de outliners verminderen. Als je de oorspronkelijke grafiek dan vergelijkt met deze grafiek (dus met log), zie je dat de investeringen nog steeds de grootste achteruitgang kennen in vergelijking met de andere variabelen. Er zijn nu wel minder outliers te bespeuren. Als je kijkt naar de verdeling van de eenheden op de y-as, dan zie je dat de spreiding nu ook kleiner is geworden ten opzichte van de oorspronkelijke grafiek.
2008-11-12 09:40:41 [Maarten Van Gucht] [reply
Task 3:
Wat hij resulteert bij een log-transformatie is juist. De hogere waarden worden afgevlakt en de kleinere waarden worden omhooggetrokken. Dit betekent niet dat er geen outliers meer aanwezig kunnen zijn. De y-waarden veranderen ook. Deze worden kleiner.

Post a new message
Dataseries X:
110.40	72.50
96.40	59.40
101.90	85.70
106.20	88.20
81.00	62.80
94.70	87.00
101.00	79.20
109.40	112.00
102.30	79.20
90.70	132.10
96.20	40.10
96.10	69.00
106.00	59.40
103.10	73.80
102.00	57.40
104.70	81.10
86.00	46.60
92.10	41.40
106.90	71.20
112.60	67.90
101.70	72.00
92.00	145.50
97.40	39.70
97.00	51.90
105.40	73.70
102.70	70.90
98.10	60.80
104.50	61.00
87.40	54.50
89.90	39.10
109.80	66.60
111.70	58.50
98.60	59.80
96.90	80.90
95.10	37.30
97.00	44.60
112.70	48.70
102.90	54.00
97.40	49.50
111.40	61.60
87.40	35.00
96.80	35.70
114.10	51.30
110.30	49.00
103.90	41.50
101.60	72.50
94.60	42.10
95.90	44.10
104.70	45.10
102.80	50.30
98.10	40.90
113.90	47.20
80.90	36.90
95.70	40.90
113.20	38.30
105.90	46.30
108.80	28.40
102.30	78.40
99.00	36.80
100.70	50.70
115.50	42.80


Summary of computational transaction
Raw Inputview raw input (R code)
Raw Outputview raw output of R engine
Computing time1 seconds
R Server'Gwilym Jenkins' @ 72.249.127.135

\begin{tabular}{lllllllll}
\hline
Summary of computational transaction \tabularnewline
Raw Input & view raw input (R code)  \tabularnewline
Raw Output & view raw output of R engine  \tabularnewline
Computing time & 1 seconds \tabularnewline
R Server & 'Gwilym Jenkins' @ 72.249.127.135 \tabularnewline
\hline
\end{tabular}
%Source: https://freestatistics.org/blog/index.php?pk=21635&T=0

[TABLE]
[ROW][C]Summary of computational transaction[/C][/ROW]
[ROW][C]Raw Input[/C][C]view raw input (R code) [/C][/ROW]
[ROW][C]Raw Output[/C][C]view raw output of R engine [/C][/ROW]
[ROW][C]Computing time[/C][C]1 seconds[/C][/ROW]
[ROW][C]R Server[/C][C]'Gwilym Jenkins' @ 72.249.127.135[/C][/ROW]
[/TABLE]
Source: https://freestatistics.org/blog/index.php?pk=21635&T=0

Globally Unique Identifier (entire table): ba.freestatistics.org/blog/index.php?pk=21635&T=0

As an alternative you can also use a QR Code:  

The GUIDs for individual cells are displayed in the table below:

Summary of computational transaction
Raw Inputview raw input (R code)
Raw Outputview raw output of R engine
Computing time1 seconds
R Server'Gwilym Jenkins' @ 72.249.127.135


Boxplot statistics
Variablelower whiskerlower hingemedianupper hingeupper whisker
index4.454347296253514.566429357671664.622027303054514.663439094112074.74927052996185
invest3.346389145167163.756538102587753.99820070166924.276666119016064.98017608661155

\begin{tabular}{lllllllll}
\hline
Boxplot statistics \tabularnewline
Variable & lower whisker & lower hinge & median & upper hinge & upper whisker \tabularnewline
index & 4.45434729625351 & 4.56642935767166 & 4.62202730305451 & 4.66343909411207 & 4.74927052996185 \tabularnewline
invest & 3.34638914516716 & 3.75653810258775 & 3.9982007016692 & 4.27666611901606 & 4.98017608661155 \tabularnewline
\hline
\end{tabular}
%Source: https://freestatistics.org/blog/index.php?pk=21635&T=1

[TABLE]
[ROW][C]Boxplot statistics[/C][/ROW]
[ROW][C]Variable[/C][C]lower whisker[/C][C]lower hinge[/C][C]median[/C][C]upper hinge[/C][C]upper whisker[/C][/ROW]
[ROW][C]index[/C][C]4.45434729625351[/C][C]4.56642935767166[/C][C]4.62202730305451[/C][C]4.66343909411207[/C][C]4.74927052996185[/C][/ROW]
[ROW][C]invest[/C][C]3.34638914516716[/C][C]3.75653810258775[/C][C]3.9982007016692[/C][C]4.27666611901606[/C][C]4.98017608661155[/C][/ROW]
[/TABLE]
Source: https://freestatistics.org/blog/index.php?pk=21635&T=1

Globally Unique Identifier (entire table): ba.freestatistics.org/blog/index.php?pk=21635&T=1

As an alternative you can also use a QR Code:  

The GUIDs for individual cells are displayed in the table below:

Boxplot statistics
Variablelower whiskerlower hingemedianupper hingeupper whisker
index4.454347296253514.566429357671664.622027303054514.663439094112074.74927052996185
invest3.346389145167163.756538102587753.99820070166924.276666119016064.98017608661155


Boxplot Notches
Variablelower boundmedianupper bound
index4.602402401170954.622027303054514.64165220493808
invest3.892979703614323.99820070166924.10342169972408

\begin{tabular}{lllllllll}
\hline
Boxplot Notches \tabularnewline
Variable & lower bound & median & upper bound \tabularnewline
index & 4.60240240117095 & 4.62202730305451 & 4.64165220493808 \tabularnewline
invest & 3.89297970361432 & 3.9982007016692 & 4.10342169972408 \tabularnewline
\hline
\end{tabular}
%Source: https://freestatistics.org/blog/index.php?pk=21635&T=2

[TABLE]
[ROW][C]Boxplot Notches[/C][/ROW]
[ROW][C]Variable[/C][C]lower bound[/C][C]median[/C][C]upper bound[/C][/ROW]
[ROW][C]index[/C][C]4.60240240117095[/C][C]4.62202730305451[/C][C]4.64165220493808[/C][/ROW]
[ROW][C]invest[/C][C]3.89297970361432[/C][C]3.9982007016692[/C][C]4.10342169972408[/C][/ROW]
[/TABLE]
Source: https://freestatistics.org/blog/index.php?pk=21635&T=2

Globally Unique Identifier (entire table): ba.freestatistics.org/blog/index.php?pk=21635&T=2

As an alternative you can also use a QR Code:  

The GUIDs for individual cells are displayed in the table below:

Boxplot Notches
Variablelower boundmedianupper bound
index4.602402401170954.622027303054514.64165220493808
invest3.892979703614323.99820070166924.10342169972408


Parameters (Session):
par1 = red ;
Parameters (R input):
par1 = red ;
R code (references can be found in the software module):
z <- as.data.frame(t(y))
bitmap(file='test1.png')
(r<-boxplot(log(z)
,xlab=xlab,ylab=ylab,main=main,notch=TRUE,col=par1))
dev.off()
load(file='createtable')
a<-table.start()
a<-table.row.start(a)
a<-table.element(a,hyperlink('overview.htm','Boxplot statistics','Boxplot overview'),6,TRUE)
a<-table.row.end(a)
a<-table.row.start(a)
a<-table.element(a,'Variable',1,TRUE)
a<-table.element(a,hyperlink('lower_whisker.htm','lower whisker','definition of lower whisker'),1,TRUE)
a<-table.element(a,hyperlink('lower_hinge.htm','lower hinge','definition of lower hinge'),1,TRUE)
a<-table.element(a,hyperlink('central_tendency.htm','median','definitions about measures of central tendency'),1,TRUE)
a<-table.element(a,hyperlink('upper_hinge.htm','upper hinge','definition of upper hinge'),1,TRUE)
a<-table.element(a,hyperlink('upper_whisker.htm','upper whisker','definition of upper whisker'),1,TRUE)
a<-table.row.end(a)
for (i in 1:length(y[,1]))
{
a<-table.row.start(a)
a<-table.element(a,dimnames(t(x))[[2]][i],1,TRUE)
for (j in 1:5)
{
a<-table.element(a,r$stats[j,i])
}
a<-table.row.end(a)
}
a<-table.end(a)
table.save(a,file='mytable.tab')
a<-table.start()
a<-table.row.start(a)
a<-table.element(a,'Boxplot Notches',4,TRUE)
a<-table.row.end(a)
a<-table.row.start(a)
a<-table.element(a,'Variable',1,TRUE)
a<-table.element(a,'lower bound',1,TRUE)
a<-table.element(a,'median',1,TRUE)
a<-table.element(a,'upper bound',1,TRUE)
a<-table.row.end(a)
for (i in 1:length(y[,1]))
{
a<-table.row.start(a)
a<-table.element(a,dimnames(t(x))[[2]][i],1,TRUE)
a<-table.element(a,r$conf[1,i])
a<-table.element(a,r$stats[3,i])
a<-table.element(a,r$conf[2,i])
a<-table.row.end(a)
}
a<-table.end(a)
table.save(a,file='mytable1.tab')