Free Statistics

of Irreproducible Research!

Author's title

Author*The author of this computation has been verified*
R Software Modulerwasp_notchedbox1.wasp
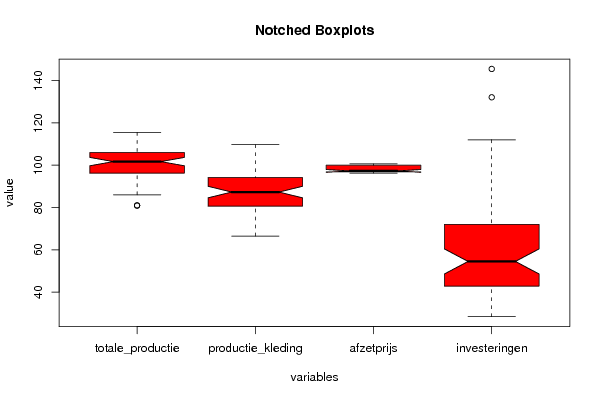
Title produced by softwareNotched Boxplots
Date of computationMon, 03 Nov 2008 12:34:17 -0700
Cite this page as followsStatistical Computations at FreeStatistics.org, Office for Research Development and Education, URL https://freestatistics.org/blog/index.php?v=date/2008/Nov/03/t1225740887wqeyo1vaxhneul0.htm/, Retrieved Mon, 20 May 2024 09:26:43 +0000
Statistical Computations at FreeStatistics.org, Office for Research Development and Education, URL https://freestatistics.org/blog/index.php?pk=21071, Retrieved Mon, 20 May 2024 09:26:43 +0000
QR Codes:

Original text written by user:
IsPrivate?No (this computation is public)
User-defined keywords
Estimated Impact184
Family? (F = Feedback message, R = changed R code, M = changed R Module, P = changed Parameters, D = changed Data)
F     [Notched Boxplots] [Q1] [2008-11-02 11:40:21] [4300be8b33fd3dcdacd2aa9800ceba23]
F    D  [Notched Boxplots] [Task 2] [2008-11-02 12:22:03] [4300be8b33fd3dcdacd2aa9800ceba23]
F    D      [Notched Boxplots] [Task 2] [2008-11-03 19:34:17] [541f63fa3157af9df10fc4d202b2a90b] [Current]
Feedback Forum
2008-11-10 10:57:12 [Steffi Van Isveldt] [reply
De mediaan van de investeringen het laagst ligt, maar het is niet zo dat we daardoor kunnen stellen dat er een dalende trend merkbaar is.
  2008-11-11 20:52:48 [Koen De Winter] [reply
We kunnen wel spreken van een dalende trend. In het excel-document van de vier tijdreeksen is te zien dat het jaar 2000 is gelijkgesteld met de waarde 100. Het is duidelijk dat de mediaan van de investeringen nu lager ligt dan 100. Er kan dus gesteld worden dan vanaf het jaar 2000 de investeringen een dalende trend gekend hebben. Deze dalende trend is misschien al eerder begonnen maar dit weten we niet aangezien we enkel gegevens hebben van na het jaar 2000.
2008-11-11 17:17:20 [Tim Damen] [reply
De r-code is goed aangepast maar je kan aan de hand van de notched box plots idd niet zien dat er een dalende trend is.
2008-11-11 20:49:22 [Koen De Winter] [reply
Het antwoord van de student is eerder onvolledig. De vraag was of de investeringen het grootste verval kenden van alle vier tijdreeksen. De student geeft enkel aan dat de investeringen een dalende trend kenden.

Ik mis hier een vergelijking met de andere tijdreeksen en een uitleg over waarom er duidelijk te zien is dat de investeringen een verval kenden. Dit kan men namelijk zien aan de notched box van de investeringen. De bovenkant van deze notched box komt duidelijk niet aan de onderkanten van de andere boxen. Deze box ligt dus significant lager dan de andere. Daarom kan men zeggen dat de investeringen het laagste verval kenden van alle vier.

Post a new message
Dataseries X:
110.40	109.20	99.90	72.50
96.40	88.60	99.80	59.40
101.90	94.30	99.80	85.70
106.20	98.30	100.30	88.20
81.00	86.40	99.90	62.80
94.70	80.60	99.90	87.00
101.00	104.10	100.00	79.20
109.40	108.20	100.10	112.00
102.30	93.40	100.10	79.20
90.70	71.90	100.20	132.10
96.20	94.10	100.30	40.10
96.10	94.90	100.60	69.00
106.00	96.40	100.00	59.40
103.10	91.10	100.10	73.80
102.00	84.40	100.20	57.40
104.70	86.40	100.00	81.10
86.00	88.00	100.10	46.60
92.10	75.10	100.10	41.40
106.90	109.70	100.10	71.20
112.60	103.00	100.50	67.90
101.70	82.10	100.50	72.00
92.00	68.00	100.50	145.50
97.40	96.40	96.30	39.70
97.00	94.30	96.30	51.90
105.40	90.00	96.80	73.70
102.70	88.00	96.80	70.90
98.10	76.10	96.90	60.80
104.50	82.50	96.80	61.00
87.40	81.40	96.80	54.50
89.90	66.50	96.80	39.10
109.80	97.20	96.80	66.60
111.70	94.10	97.00	58.50
98.60	80.70	97.00	59.80
96.90	70.50	97.00	80.90
95.10	87.80	96.80	37.30
97.00	89.50	96.90	44.60
112.70	99.60	97.20	48.70
102.90	84.20	97.30	54.00
97.40	75.10	97.30	49.50
111.40	92.00	97.20	61.60
87.40	80.80	97.30	35.00
96.80	73.10	97.30	35.70
114.10	99.80	97.30	51.30
110.30	90.00	97.30	49.00
103.90	83.10	97.30	41.50
101.60	72.40	97.30	72.50
94.60	78.80	98.10	42.10
95.90	87.30	96.80	44.10
104.70	91.00	96.80	45.10
102.80	80.10	96.80	50.30
98.10	73.60	96.80	40.90
113.90	86.40	96.80	47.20
80.90	74.50	96.80	36.90
95.70	71.20	96.80	40.90
113.20	92.40	96.80	38.30
105.90	81.50	96.80	46.30
108.80	85.30	96.80	28.40
102.30	69.90	96.80	78.40
99.00	84.20	96.90	36.80
100.70	90.70	97.10	50.70
115.50	100.30	97.10	42.80


Summary of computational transaction
Raw Inputview raw input (R code)
Raw Outputview raw output of R engine
Computing time2 seconds
R Server'Sir Ronald Aylmer Fisher' @ 193.190.124.24

\begin{tabular}{lllllllll}
\hline
Summary of computational transaction \tabularnewline
Raw Input & view raw input (R code)  \tabularnewline
Raw Output & view raw output of R engine  \tabularnewline
Computing time & 2 seconds \tabularnewline
R Server & 'Sir Ronald Aylmer Fisher' @ 193.190.124.24 \tabularnewline
\hline
\end{tabular}
%Source: https://freestatistics.org/blog/index.php?pk=21071&T=0

[TABLE]
[ROW][C]Summary of computational transaction[/C][/ROW]
[ROW][C]Raw Input[/C][C]view raw input (R code) [/C][/ROW]
[ROW][C]Raw Output[/C][C]view raw output of R engine [/C][/ROW]
[ROW][C]Computing time[/C][C]2 seconds[/C][/ROW]
[ROW][C]R Server[/C][C]'Sir Ronald Aylmer Fisher' @ 193.190.124.24[/C][/ROW]
[/TABLE]
Source: https://freestatistics.org/blog/index.php?pk=21071&T=0

Globally Unique Identifier (entire table): ba.freestatistics.org/blog/index.php?pk=21071&T=0

As an alternative you can also use a QR Code:  

The GUIDs for individual cells are displayed in the table below:

Summary of computational transaction
Raw Inputview raw input (R code)
Raw Outputview raw output of R engine
Computing time2 seconds
R Server'Sir Ronald Aylmer Fisher' @ 193.190.124.24


Boxplot statistics
Variablelower whiskerlower hingemedianupper hingeupper whisker
totale_productie8696.2101.7106115.5
productie_kleding66.580.687.394.1109.7
afzetprijs96.396.897.3100100.6
investeringen28.442.854.572112

\begin{tabular}{lllllllll}
\hline
Boxplot statistics \tabularnewline
Variable & lower whisker & lower hinge & median & upper hinge & upper whisker \tabularnewline
totale_productie & 86 & 96.2 & 101.7 & 106 & 115.5 \tabularnewline
productie_kleding & 66.5 & 80.6 & 87.3 & 94.1 & 109.7 \tabularnewline
afzetprijs & 96.3 & 96.8 & 97.3 & 100 & 100.6 \tabularnewline
investeringen & 28.4 & 42.8 & 54.5 & 72 & 112 \tabularnewline
\hline
\end{tabular}
%Source: https://freestatistics.org/blog/index.php?pk=21071&T=1

[TABLE]
[ROW][C]Boxplot statistics[/C][/ROW]
[ROW][C]Variable[/C][C]lower whisker[/C][C]lower hinge[/C][C]median[/C][C]upper hinge[/C][C]upper whisker[/C][/ROW]
[ROW][C]totale_productie[/C][C]86[/C][C]96.2[/C][C]101.7[/C][C]106[/C][C]115.5[/C][/ROW]
[ROW][C]productie_kleding[/C][C]66.5[/C][C]80.6[/C][C]87.3[/C][C]94.1[/C][C]109.7[/C][/ROW]
[ROW][C]afzetprijs[/C][C]96.3[/C][C]96.8[/C][C]97.3[/C][C]100[/C][C]100.6[/C][/ROW]
[ROW][C]investeringen[/C][C]28.4[/C][C]42.8[/C][C]54.5[/C][C]72[/C][C]112[/C][/ROW]
[/TABLE]
Source: https://freestatistics.org/blog/index.php?pk=21071&T=1

Globally Unique Identifier (entire table): ba.freestatistics.org/blog/index.php?pk=21071&T=1

As an alternative you can also use a QR Code:  

The GUIDs for individual cells are displayed in the table below:

Boxplot statistics
Variablelower whiskerlower hingemedianupper hingeupper whisker
totale_productie8696.2101.7106115.5
productie_kleding66.580.687.394.1109.7
afzetprijs96.396.897.3100100.6
investeringen28.442.854.572112


Boxplot Notches
Variablelower boundmedianupper bound
totale_productie99.717476951119101.7103.682523048881
productie_kleding84.568973351031387.390.0310266489687
afzetprijs96.652645535059397.397.9473544649407
investeringen48.592890507415954.560.4071094925841

\begin{tabular}{lllllllll}
\hline
Boxplot Notches \tabularnewline
Variable & lower bound & median & upper bound \tabularnewline
totale_productie & 99.717476951119 & 101.7 & 103.682523048881 \tabularnewline
productie_kleding & 84.5689733510313 & 87.3 & 90.0310266489687 \tabularnewline
afzetprijs & 96.6526455350593 & 97.3 & 97.9473544649407 \tabularnewline
investeringen & 48.5928905074159 & 54.5 & 60.4071094925841 \tabularnewline
\hline
\end{tabular}
%Source: https://freestatistics.org/blog/index.php?pk=21071&T=2

[TABLE]
[ROW][C]Boxplot Notches[/C][/ROW]
[ROW][C]Variable[/C][C]lower bound[/C][C]median[/C][C]upper bound[/C][/ROW]
[ROW][C]totale_productie[/C][C]99.717476951119[/C][C]101.7[/C][C]103.682523048881[/C][/ROW]
[ROW][C]productie_kleding[/C][C]84.5689733510313[/C][C]87.3[/C][C]90.0310266489687[/C][/ROW]
[ROW][C]afzetprijs[/C][C]96.6526455350593[/C][C]97.3[/C][C]97.9473544649407[/C][/ROW]
[ROW][C]investeringen[/C][C]48.5928905074159[/C][C]54.5[/C][C]60.4071094925841[/C][/ROW]
[/TABLE]
Source: https://freestatistics.org/blog/index.php?pk=21071&T=2

Globally Unique Identifier (entire table): ba.freestatistics.org/blog/index.php?pk=21071&T=2

As an alternative you can also use a QR Code:  

The GUIDs for individual cells are displayed in the table below:

Boxplot Notches
Variablelower boundmedianupper bound
totale_productie99.717476951119101.7103.682523048881
productie_kleding84.568973351031387.390.0310266489687
afzetprijs96.652645535059397.397.9473544649407
investeringen48.592890507415954.560.4071094925841


Parameters (Session):
par1 = red ;
Parameters (R input):
par1 = red ;
R code (references can be found in the software module):
z <- as.data.frame(t(y))
bitmap(file='test1.png')
(r<-boxplot(z ,xlab=xlab,ylab=ylab,main=main,notch=TRUE,col=par1))
dev.off()
load(file='createtable')
a<-table.start()
a<-table.row.start(a)
a<-table.element(a,hyperlink('overview.htm','Boxplot statistics','Boxplot overview'),6,TRUE)
a<-table.row.end(a)
a<-table.row.start(a)
a<-table.element(a,'Variable',1,TRUE)
a<-table.element(a,hyperlink('lower_whisker.htm','lower whisker','definition of lower whisker'),1,TRUE)
a<-table.element(a,hyperlink('lower_hinge.htm','lower hinge','definition of lower hinge'),1,TRUE)
a<-table.element(a,hyperlink('central_tendency.htm','median','definitions about measures of central tendency'),1,TRUE)
a<-table.element(a,hyperlink('upper_hinge.htm','upper hinge','definition of upper hinge'),1,TRUE)
a<-table.element(a,hyperlink('upper_whisker.htm','upper whisker','definition of upper whisker'),1,TRUE)
a<-table.row.end(a)
for (i in 1:length(y[,1]))
{
a<-table.row.start(a)
a<-table.element(a,dimnames(t(x))[[2]][i],1,TRUE)
for (j in 1:5)
{
a<-table.element(a,r$stats[j,i])
}
a<-table.row.end(a)
}
a<-table.end(a)
table.save(a,file='mytable.tab')
a<-table.start()
a<-table.row.start(a)
a<-table.element(a,'Boxplot Notches',4,TRUE)
a<-table.row.end(a)
a<-table.row.start(a)
a<-table.element(a,'Variable',1,TRUE)
a<-table.element(a,'lower bound',1,TRUE)
a<-table.element(a,'median',1,TRUE)
a<-table.element(a,'upper bound',1,TRUE)
a<-table.row.end(a)
for (i in 1:length(y[,1]))
{
a<-table.row.start(a)
a<-table.element(a,dimnames(t(x))[[2]][i],1,TRUE)
a<-table.element(a,r$conf[1,i])
a<-table.element(a,r$stats[3,i])
a<-table.element(a,r$conf[2,i])
a<-table.row.end(a)
}
a<-table.end(a)
table.save(a,file='mytable1.tab')