Free Statistics
of Irreproducible Research!
Description of Statistical Computation | |||||||||||||||||||||||||||||||||||||||||
|---|---|---|---|---|---|---|---|---|---|---|---|---|---|---|---|---|---|---|---|---|---|---|---|---|---|---|---|---|---|---|---|---|---|---|---|---|---|---|---|---|---|
| Author's title | |||||||||||||||||||||||||||||||||||||||||
| Author | *Unverified author* | ||||||||||||||||||||||||||||||||||||||||
| R Software Module | rwasp_univariatedataseries.wasp | ||||||||||||||||||||||||||||||||||||||||
| Title produced by software | Univariate Data Series | ||||||||||||||||||||||||||||||||||||||||
| Date of computation | Thu, 21 Feb 2008 12:11:56 -0700 | ||||||||||||||||||||||||||||||||||||||||
| Cite this page as follows | Statistical Computations at FreeStatistics.org, Office for Research Development and Education, URL https://freestatistics.org/blog/index.php?v=date/2008/Feb/21/t1203621308pr4la46d03cdyjw.htm/, Retrieved Thu, 16 May 2024 02:50:32 +0000 | ||||||||||||||||||||||||||||||||||||||||
| Statistical Computations at FreeStatistics.org, Office for Research Development and Education, URL https://freestatistics.org/blog/index.php?pk=8496, Retrieved Thu, 16 May 2024 02:50:32 +0000 | |||||||||||||||||||||||||||||||||||||||||
| QR Codes: | |||||||||||||||||||||||||||||||||||||||||
|
| |||||||||||||||||||||||||||||||||||||||||
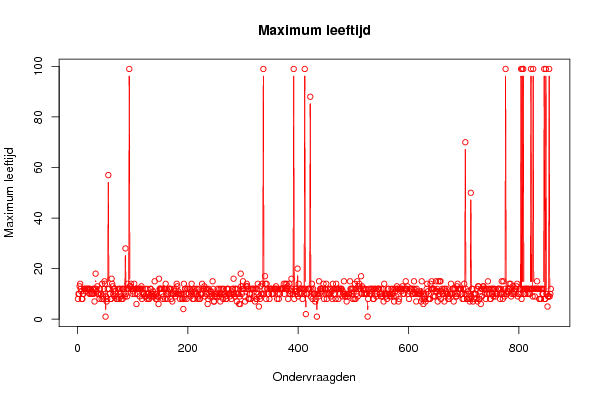
| Original text written by user: | Deze vraag werd aan 858 mensen gesteld. | ||||||||||||||||||||||||||||||||||||||||
| IsPrivate? | No (this computation is public) | ||||||||||||||||||||||||||||||||||||||||
| User-defined keywords | Wat is de maximum leeftijd van een kind om naar de Grote Sinterklaasshow te gaan kijken? | ||||||||||||||||||||||||||||||||||||||||
| Estimated Impact | 212 | ||||||||||||||||||||||||||||||||||||||||
Tree of Dependent Computations | |||||||||||||||||||||||||||||||||||||||||
| Family? (F = Feedback message, R = changed R code, M = changed R Module, P = changed Parameters, D = changed Data) | |||||||||||||||||||||||||||||||||||||||||
| - [Univariate Data Series] [Maximum leeftijd ...] [2008-02-21 19:11:56] [d8973bbb712c03ae516525a15d4e5e48] [Current] | |||||||||||||||||||||||||||||||||||||||||
| Feedback Forum | |||||||||||||||||||||||||||||||||||||||||
Post a new message | |||||||||||||||||||||||||||||||||||||||||
Dataset | |||||||||||||||||||||||||||||||||||||||||
| Dataseries X: | |||||||||||||||||||||||||||||||||||||||||
8 10 10 13 14 12 11 8 8 10 10 12 12 12 11 12 12 12 12 12 12 10 12 10 11 10 10 12 10 12 7 12 18 12 11 13 10 10 10 8 12 10 10 8 14 9 8 12 15 14 1 9 7 8 12 57 12 10 10 8 8 16 14 13 10 12 9 12 11 10 8 8 9 12 8 12 10 12 9 8 12 8 12 10 12 9 28 10 12 9 14 12 12 99 13 13 14 12 12 10 11 12 14 10 12 12 6 12 10 12 12 12 9 12 12 13 8 12 10 10 10 9 12 9 10 8 12 10 8 8 9 12 12 10 10 9 11 10 9 15 10 8 10 8 9 9 6 16 12 12 12 12 10 12 8 9 12 12 8 14 10 12 8 11 10 12 12 12 12 8 10 7 10 10 12 11 9 10 12 14 13 10 11 10 10 8 10 10 10 8 8 4 14 8 12 12 10 8 12 12 10 10 12 12 9 11 14 10 8 12 8 10 11 12 10 10 12 8 9 12 8 8 10 10 10 14 10 12 12 13 9 12 12 10 12 6 8 12 10 9 11 11 9 10 15 12 7 7 10 9 10 10 9 12 10 9 12 10 7 12 10 10 12 8 12 10 10 9 8 8 12 12 10 12 10 9 10 10 8 10 12 12 16 10 9 12 12 10 7 12 10 10 6 9 6 18 13 10 12 15 12 12 9 7 12 13 14 13 12 8 8 10 10 8 12 10 12 12 12 9 12 7 12 8 8 12 14 10 5 9 8 13 10 10 14 10 99 10 12 17 14 8 14 12 12 10 10 8 12 12 12 10 12 10 10 12 12 12 12 13 12 8 10 12 8 10 10 12 12 12 12 12 12 14 10 12 14 12 14 12 13 8 12 14 10 10 11 16 12 10 10 99 8 11 12 12 11 10 20 9 14 12 10 12 10 12 12 8 12 12 10 99 12 2 10 10 10 12 12 12 12 88 9 12 14 8 12 10 10 10 7 8 10 1 10 10 9 15 10 12 12 12 11 12 12 14 8 12 12 10 14 8 10 12 10 10 10 12 9 12 11 8 14 12 10 12 10 8 14 12 12 12 8 12 12 10 12 12 12 9 11 10 15 10 9 9 10 7 10 9 10 10 10 15 12 12 10 12 8 12 11 8 14 8 12 10 15 9 13 12 14 12 12 17 10 13 12 12 10 12 10 12 10 10 10 1 8 12 10 10 10 12 12 11 12 8 8 12 12 10 12 9 10 12 12 12 12 10 10 9 12 10 9 12 7 14 10 10 9 10 8 10 12 12 10 9 10 9 12 10 12 10 9 7 12 11 12 9 13 12 12 7 8 12 12 12 11 12 13 10 12 10 12 12 15 12 12 13 10 10 8 11 12 12 12 12 10 10 12 15 12 10 10 7 12 10 11 10 10 10 10 11 7 15 8 10 6 8 9 8 7 10 12 14 11 8 10 8 8 14 12 15 12 12 9 12 12 9 11 15 11 12 7 15 9 10 15 15 8 11 12 10 10 12 7 12 10 11 12 10 10 8 9 8 10 10 14 10 10 12 12 7 12 10 12 9 9 13 14 10 12 12 12 12 12 10 10 8 12 8 14 10 70 12 10 8 8 11 10 8 7 8 50 9 12 12 7 10 8 10 10 10 8 12 7 13 13 8 8 11 6 12 9 12 13 13 12 12 10 8 12 10 10 15 12 10 12 8 8 12 12 10 12 9 12 12 10 9 10 10 10 12 12 12 12 8 10 12 15 10 8 15 10 9 12 99 10 10 11 11 12 12 14 12 14 9 10 12 13 10 11 10 12 12 12 13 14 9 10 10 12 12 10 99 8 99 12 99 12 10 12 10 12 12 12 10 12 12 10 10 12 99 12 12 9 99 12 12 9 12 12 12 15 12 12 12 8 8 12 8 12 12 10 10 12 99 8 8 99 10 10 5 9 9 99 9 10 12 | |||||||||||||||||||||||||||||||||||||||||
Tables (Output of Computation) | |||||||||||||||||||||||||||||||||||||||||
| |||||||||||||||||||||||||||||||||||||||||
Figures (Output of Computation) | |||||||||||||||||||||||||||||||||||||||||
Input Parameters & R Code | |||||||||||||||||||||||||||||||||||||||||
| Parameters (Session): | |||||||||||||||||||||||||||||||||||||||||
| par1 = Maximum leeftijd ; par2 = Een onderzoek in opdracht van Studio 100. ; par3 = Aan 858 mensen werd gevraagd wat zij de maximum leeftijd van een kind vonden om naar om naar de Grote Sinterklaasshow te gaan kijken. ; | |||||||||||||||||||||||||||||||||||||||||
| Parameters (R input): | |||||||||||||||||||||||||||||||||||||||||
| par1 = Maximum leeftijd ; par2 = Een onderzoek in opdracht van Studio 100. ; par3 = Aan 858 mensen werd gevraagd wat zij de maximum leeftijd van een kind vonden om naar om naar de Grote Sinterklaasshow te gaan kijken. ; | |||||||||||||||||||||||||||||||||||||||||
| R code (references can be found in the software module): | |||||||||||||||||||||||||||||||||||||||||
bitmap(file='test1.png') | |||||||||||||||||||||||||||||||||||||||||