Free Statistics
of Irreproducible Research!
Description of Statistical Computation | |||||||||||||||||||||||||||||||||||||||||
|---|---|---|---|---|---|---|---|---|---|---|---|---|---|---|---|---|---|---|---|---|---|---|---|---|---|---|---|---|---|---|---|---|---|---|---|---|---|---|---|---|---|
| Author's title | |||||||||||||||||||||||||||||||||||||||||
| Author | *Unverified author* | ||||||||||||||||||||||||||||||||||||||||
| R Software Module | rwasp_univariatedataseries.wasp | ||||||||||||||||||||||||||||||||||||||||
| Title produced by software | Univariate Data Series | ||||||||||||||||||||||||||||||||||||||||
| Date of computation | Fri, 15 Feb 2008 06:47:10 -0700 | ||||||||||||||||||||||||||||||||||||||||
| Cite this page as follows | Statistical Computations at FreeStatistics.org, Office for Research Development and Education, URL https://freestatistics.org/blog/index.php?v=date/2008/Feb/15/t1203083390e0cnaei9ccufsqq.htm/, Retrieved Wed, 15 May 2024 22:45:44 +0000 | ||||||||||||||||||||||||||||||||||||||||
| Statistical Computations at FreeStatistics.org, Office for Research Development and Education, URL https://freestatistics.org/blog/index.php?pk=8223, Retrieved Wed, 15 May 2024 22:45:44 +0000 | |||||||||||||||||||||||||||||||||||||||||
| QR Codes: | |||||||||||||||||||||||||||||||||||||||||
|
| |||||||||||||||||||||||||||||||||||||||||
| Original text written by user: | Bron: http://www.nbb.be/belgostat/PresentationLinker?TableId=417000065&Lang=N | ||||||||||||||||||||||||||||||||||||||||
| IsPrivate? | No (this computation is public) | ||||||||||||||||||||||||||||||||||||||||
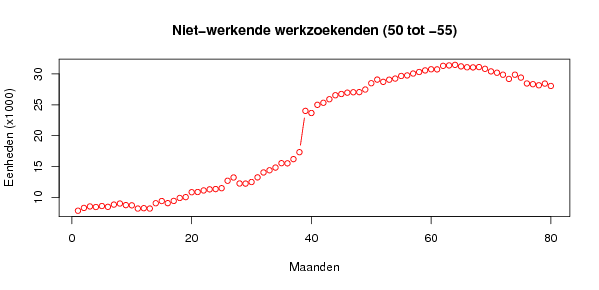
| User-defined keywords | Niet- werkende werkzoekende van het Vlaams Gewest van 50 tot -55 jaar. Periode 2001/06 tot 2008/01. Met een maandelijks tijdsinterval. | ||||||||||||||||||||||||||||||||||||||||
| Estimated Impact | 258 | ||||||||||||||||||||||||||||||||||||||||
Tree of Dependent Computations | |||||||||||||||||||||||||||||||||||||||||
| Family? (F = Feedback message, R = changed R code, M = changed R Module, P = changed Parameters, D = changed Data) | |||||||||||||||||||||||||||||||||||||||||
| - [Univariate Data Series] [Cijferreeks] [2008-02-15 13:47:10] [d8973bbb712c03ae516525a15d4e5e48] [Current] | |||||||||||||||||||||||||||||||||||||||||
| Feedback Forum | |||||||||||||||||||||||||||||||||||||||||
Post a new message | |||||||||||||||||||||||||||||||||||||||||
Dataset | |||||||||||||||||||||||||||||||||||||||||
| Dataseries X: | |||||||||||||||||||||||||||||||||||||||||
7.840 8.292 8.534 8.441 8.602 8.468 8.832 9.006 8.749 8.714 8.193 8.251 8.192 9.056 9.407 9.068 9.431 9.907 10.044 10.838 10.871 11.127 11.303 11.349 11.493 12.694 13.227 12.253 12.234 12.491 13.248 14.042 14.392 14.834 15.542 15.518 16.197 17.325 24.016 23.671 24.998 25.329 25.904 26.548 26.752 26.967 27.034 27.056 27.476 28.497 29.085 28.720 29.067 29.249 29.672 29.761 30.066 30.315 30.571 30.757 30.742 31.310 31.381 31.470 31.226 31.081 31.061 31.114 30.828 30.418 30.195 29.877 29.192 29.876 29.409 28.458 28.340 28.164 28.438 28.053 | |||||||||||||||||||||||||||||||||||||||||
Tables (Output of Computation) | |||||||||||||||||||||||||||||||||||||||||
| |||||||||||||||||||||||||||||||||||||||||
Figures (Output of Computation) | |||||||||||||||||||||||||||||||||||||||||
Input Parameters & R Code | |||||||||||||||||||||||||||||||||||||||||
| Parameters (Session): | |||||||||||||||||||||||||||||||||||||||||
| par1 = Niet werkende werkzoekende tussen de 50 en de -55 jaar ; par2 = http://www.belgostat.be ; par3 = Niet- werkende werkzoekenden tussen de 50 en -55 jaar van het Vlaams Gewest. Er wordt gebruik gemaakt van een maandelijks tijdsinterval. ; | |||||||||||||||||||||||||||||||||||||||||
| Parameters (R input): | |||||||||||||||||||||||||||||||||||||||||
| par1 = Niet werkende werkzoekende tussen de 50 en de -55 jaar ; par2 = http://www.belgostat.be ; par3 = Niet- werkende werkzoekenden tussen de 50 en -55 jaar van het Vlaams Gewest. Er wordt gebruik gemaakt van een maandelijks tijdsinterval. ; | |||||||||||||||||||||||||||||||||||||||||
| R code (references can be found in the software module): | |||||||||||||||||||||||||||||||||||||||||
bitmap(file='test1.png') | |||||||||||||||||||||||||||||||||||||||||