Free Statistics

of Irreproducible Research!

Author's title

Author*Unverified author*
R Software Modulerwasp_histogram.wasp
Title produced by softwareHistogram
Date of computationFri, 15 Feb 2008 03:36:42 -0700
Cite this page as followsStatistical Computations at FreeStatistics.org, Office for Research Development and Education, URL https://freestatistics.org/blog/index.php?v=date/2008/Feb/15/t12030724922v207cjl836slly.htm/, Retrieved Wed, 15 May 2024 04:31:07 +0000
Statistical Computations at FreeStatistics.org, Office for Research Development and Education, URL https://freestatistics.org/blog/index.php?pk=8212, Retrieved Wed, 15 May 2024 04:31:07 +0000
QR Codes:

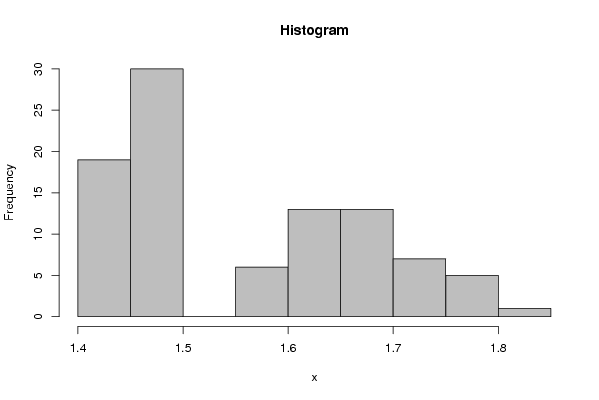
Original text written by user:We stellen vast dat in de prijs alleen maar gestegen is sinds de eerste meting. Maar de prijs stijgt sneller en sneller. Tussen €1.40 en €1.45 hebben we 19 metingen, en tussen €1.45 en €1.50 hebben we zelfs 30 metingen. Dit wil zeggen dat de prijs in die periodes min of meer constant bleef. We hebben één periode zonder resultaten, dit komt doordat er een prijsstijging van meer dan €0.05 is geweest. Vanaf dan zien we dat de prijsstijgingen elkaar sneller en sneller opvolgen met als gevolg dat de absolute frequenties kleiner en kleiner worden.
IsPrivate?No (this computation is public)
User-defined keywordsfrequentietabel, verkoopprijs, brood
Estimated Impact252
Family? (F = Feedback message, R = changed R code, M = changed R Module, P = changed Parameters, D = changed Data)
-       [Histogram] [Frequentietabel v...] [2008-02-15 10:36:42] [3244ffc2cb3525df557e4a14321135d8] [Current]
Feedback Forum

Post a new message
Dataseries X:
1.43
1.43
1.43
1.43
1.43
1.43
1.43
1.43
1.43
1.43
1.43
1.43
1.43
1.43
1.43
1.43
1.43
1.43
1.44
1.48
1.48
1.48
1.48
1.48
1.48
1.48
1.48
1.48
1.48
1.48
1.48
1.48
1.48
1.48
1.48
1.48
1.48
1.48
1.48
1.48
1.48
1.48
1.48
1.48
1.48
1.48
1.48
1.48
1.48
1.57
1.58
1.58
1.58
1.58
1.59
1.6
1.6
1.61
1.61
1.61
1.62
1.63
1.63
1.64
1.64
1.64
1.64
1.64
1.65
1.65
1.65
1.65
1.65
1.66
1.66
1.67
1.68
1.68
1.68
1.68
1.69
1.7
1.7
1.71
1.72
1.73
1.74
1.74
1.75
1.75
1.75
1.76
1.79
1.83


Summary of compuational transaction
Raw Inputview raw input (R code)
Raw Outputview raw output of R engine
Computing time3 seconds
R Server'Herman Ole Andreas Wold' @ 193.190.124.10:1001

\begin{tabular}{lllllllll}
\hline
Summary of compuational transaction \tabularnewline
Raw Input & view raw input (R code)  \tabularnewline
Raw Output & view raw output of R engine  \tabularnewline
Computing time & 3 seconds \tabularnewline
R Server & 'Herman Ole Andreas Wold' @ 193.190.124.10:1001 \tabularnewline
\hline
\end{tabular}
%Source: https://freestatistics.org/blog/index.php?pk=8212&T=0

[TABLE]
[ROW][C]Summary of compuational transaction[/C][/ROW]
[ROW][C]Raw Input[/C][C]view raw input (R code) [/C][/ROW]
[ROW][C]Raw Output[/C][C]view raw output of R engine [/C][/ROW]
[ROW][C]Computing time[/C][C]3 seconds[/C][/ROW]
[ROW][C]R Server[/C][C]'Herman Ole Andreas Wold' @ 193.190.124.10:1001[/C][/ROW]
[/TABLE]
Source: https://freestatistics.org/blog/index.php?pk=8212&T=0

Globally Unique Identifier (entire table): ba.freestatistics.org/blog/index.php?pk=8212&T=0

As an alternative you can also use a QR Code:  

The GUIDs for individual cells are displayed in the table below:

Summary of compuational transaction
Raw Inputview raw input (R code)
Raw Outputview raw output of R engine
Computing time3 seconds
R Server'Herman Ole Andreas Wold' @ 193.190.124.10:1001


Frequency Table (Histogram)
BinsMidpointAbs. FrequencyRel. FrequencyCumul. Rel. Freq.Density
[1.4,1.45[1.425190.2021280.2021284.042553
[1.45,1.5[1.475300.3191490.5212776.382979
[1.5,1.55[1.525000.5212770
[1.55,1.6[1.57560.063830.5851061.276596
[1.6,1.65[1.625130.1382980.7234042.765957
[1.65,1.7[1.675130.1382980.8617022.765957
[1.7,1.75[1.72570.0744680.936171.489362
[1.75,1.8[1.77550.0531910.9893621.06383
[1.8,1.85]1.82510.01063810.212766

\begin{tabular}{lllllllll}
\hline
Frequency Table (Histogram) \tabularnewline
Bins & Midpoint & Abs. Frequency & Rel. Frequency & Cumul. Rel. Freq. & Density \tabularnewline
[1.4,1.45[ & 1.425 & 19 & 0.202128 & 0.202128 & 4.042553 \tabularnewline
[1.45,1.5[ & 1.475 & 30 & 0.319149 & 0.521277 & 6.382979 \tabularnewline
[1.5,1.55[ & 1.525 & 0 & 0 & 0.521277 & 0 \tabularnewline
[1.55,1.6[ & 1.575 & 6 & 0.06383 & 0.585106 & 1.276596 \tabularnewline
[1.6,1.65[ & 1.625 & 13 & 0.138298 & 0.723404 & 2.765957 \tabularnewline
[1.65,1.7[ & 1.675 & 13 & 0.138298 & 0.861702 & 2.765957 \tabularnewline
[1.7,1.75[ & 1.725 & 7 & 0.074468 & 0.93617 & 1.489362 \tabularnewline
[1.75,1.8[ & 1.775 & 5 & 0.053191 & 0.989362 & 1.06383 \tabularnewline
[1.8,1.85] & 1.825 & 1 & 0.010638 & 1 & 0.212766 \tabularnewline
\hline
\end{tabular}
%Source: https://freestatistics.org/blog/index.php?pk=8212&T=1

[TABLE]
[ROW][C]Frequency Table (Histogram)[/C][/ROW]
[ROW][C]Bins[/C][C]Midpoint[/C][C]Abs. Frequency[/C][C]Rel. Frequency[/C][C]Cumul. Rel. Freq.[/C][C]Density[/C][/ROW]
[ROW][C][1.4,1.45[[/C][C]1.425[/C][C]19[/C][C]0.202128[/C][C]0.202128[/C][C]4.042553[/C][/ROW]
[ROW][C][1.45,1.5[[/C][C]1.475[/C][C]30[/C][C]0.319149[/C][C]0.521277[/C][C]6.382979[/C][/ROW]
[ROW][C][1.5,1.55[[/C][C]1.525[/C][C]0[/C][C]0[/C][C]0.521277[/C][C]0[/C][/ROW]
[ROW][C][1.55,1.6[[/C][C]1.575[/C][C]6[/C][C]0.06383[/C][C]0.585106[/C][C]1.276596[/C][/ROW]
[ROW][C][1.6,1.65[[/C][C]1.625[/C][C]13[/C][C]0.138298[/C][C]0.723404[/C][C]2.765957[/C][/ROW]
[ROW][C][1.65,1.7[[/C][C]1.675[/C][C]13[/C][C]0.138298[/C][C]0.861702[/C][C]2.765957[/C][/ROW]
[ROW][C][1.7,1.75[[/C][C]1.725[/C][C]7[/C][C]0.074468[/C][C]0.93617[/C][C]1.489362[/C][/ROW]
[ROW][C][1.75,1.8[[/C][C]1.775[/C][C]5[/C][C]0.053191[/C][C]0.989362[/C][C]1.06383[/C][/ROW]
[ROW][C][1.8,1.85][/C][C]1.825[/C][C]1[/C][C]0.010638[/C][C]1[/C][C]0.212766[/C][/ROW]
[/TABLE]
Source: https://freestatistics.org/blog/index.php?pk=8212&T=1

Globally Unique Identifier (entire table): ba.freestatistics.org/blog/index.php?pk=8212&T=1

As an alternative you can also use a QR Code:  

The GUIDs for individual cells are displayed in the table below:

Frequency Table (Histogram)
BinsMidpointAbs. FrequencyRel. FrequencyCumul. Rel. Freq.Density
[1.4,1.45[1.425190.2021280.2021284.042553
[1.45,1.5[1.475300.3191490.5212776.382979
[1.5,1.55[1.525000.5212770
[1.55,1.6[1.57560.063830.5851061.276596
[1.6,1.65[1.625130.1382980.7234042.765957
[1.65,1.7[1.675130.1382980.8617022.765957
[1.7,1.75[1.72570.0744680.936171.489362
[1.75,1.8[1.77550.0531910.9893621.06383
[1.8,1.85]1.82510.01063810.212766


Parameters (Session):
Parameters (R input):
par1 = ; par2 = grey ; par3 = FALSE ; par4 = Unknown ;
R code (references can be found in the software module):
par1 <- as.numeric(par1)
if (par3 == 'TRUE') par3 <- TRUE
if (par3 == 'FALSE') par3 <- FALSE
if (par4 == 'Unknown') par1 <- as.numeric(par1)
if (par4 == 'Interval/Ratio') par1 <- as.numeric(par1)
if (par4 == '3-point Likert') par1 <- c(1:3 - 0.5, 3.5)
if (par4 == '4-point Likert') par1 <- c(1:4 - 0.5, 4.5)
if (par4 == '5-point Likert') par1 <- c(1:5 - 0.5, 5.5)
if (par4 == '6-point Likert') par1 <- c(1:6 - 0.5, 6.5)
if (par4 == '7-point Likert') par1 <- c(1:7 - 0.5, 7.5)
if (par4 == '8-point Likert') par1 <- c(1:8 - 0.5, 8.5)
if (par4 == '9-point Likert') par1 <- c(1:9 - 0.5, 9.5)
if (par4 == '10-point Likert') par1 <- c(1:10 - 0.5, 10.5)
bitmap(file='test1.png')
if (is.na(par1)) {
myhist<-hist(x,col=par2,main=main,xlab=xlab,right=par3)
} else {
if (par1 < 0) par1 <- 3
if (par1 > 50) par1 <- 50
myhist<-hist(x,breaks=par1,col=par2,main=main,xlab=xlab,right=par3)
}
dev.off()
myhist
n <- length(x)
load(file='createtable')
a<-table.start()
a<-table.row.start(a)
a<-table.element(a,hyperlink('histogram.htm','Frequency Table (Histogram)',''),6,TRUE)
a<-table.row.end(a)
a<-table.row.start(a)
a<-table.element(a,'Bins',header=TRUE)
a<-table.element(a,'Midpoint',header=TRUE)
a<-table.element(a,'Abs. Frequency',header=TRUE)
a<-table.element(a,'Rel. Frequency',header=TRUE)
a<-table.element(a,'Cumul. Rel. Freq.',header=TRUE)
a<-table.element(a,'Density',header=TRUE)
a<-table.row.end(a)
crf <- 0
if (par3 == FALSE) mybracket <- '[' else mybracket <- ']'
mynumrows <- (length(myhist$breaks)-1)
for (i in 1:mynumrows) {
a<-table.row.start(a)
if (i == 1)
dum <- paste('[',myhist$breaks[i],sep='')
else
dum <- paste(mybracket,myhist$breaks[i],sep='')
dum <- paste(dum,myhist$breaks[i+1],sep=',')
if (i==mynumrows)
dum <- paste(dum,']',sep='')
else
dum <- paste(dum,mybracket,sep='')
a<-table.element(a,dum,header=TRUE)
a<-table.element(a,myhist$mids[i])
a<-table.element(a,myhist$counts[i])
rf <- myhist$counts[i]/n
crf <- crf + rf
a<-table.element(a,round(rf,6))
a<-table.element(a,round(crf,6))
a<-table.element(a,round(myhist$density[i],6))
a<-table.row.end(a)
}
a<-table.end(a)
table.save(a,file='mytable.tab')