Free Statistics

of Irreproducible Research!

Author's title

Author*Unverified author*
R Software Modulerwasp_autocorrelation.wasp
Title produced by software(Partial) Autocorrelation Function
Date of computationWed, 24 Dec 2008 07:35:03 -0700
Cite this page as followsStatistical Computations at FreeStatistics.org, Office for Research Development and Education, URL https://freestatistics.org/blog/index.php?v=date/2008/Dec/24/t12301294305fniorjvjd2bv6x.htm/, Retrieved Fri, 17 May 2024 01:42:27 +0000
Statistical Computations at FreeStatistics.org, Office for Research Development and Education, URL https://freestatistics.org/blog/index.php?pk=36593, Retrieved Fri, 17 May 2024 01:42:27 +0000
QR Codes:

Original text written by user:
IsPrivate?No (this computation is public)
User-defined keywords
Estimated Impact198
Family? (F = Feedback message, R = changed R code, M = changed R Module, P = changed Parameters, D = changed Data)
-     [(Partial) Autocorrelation Function] [] [2008-12-24 14:31:53] [74be16979710d4c4e7c6647856088456]
-   P     [(Partial) Autocorrelation Function] [] [2008-12-24 14:35:03] [d41d8cd98f00b204e9800998ecf8427e] [Current]
-   P       [(Partial) Autocorrelation Function] [] [2008-12-24 14:41:27] [74be16979710d4c4e7c6647856088456]
Feedback Forum

Post a new message
Dataseries X:
555
562
561
555
544
537
543
594
611
613
611
594
595
591
589
584
573
567
569
621
629
628
612
595
597
593
590
580
574
573
573
620
626
620
588
566
557
561
549
532
526
511
499
555
565
542
527
510
514
517
508
493
490
469
478
528
534
518
506
502


Summary of computational transaction
Raw Inputview raw input (R code)
Raw Outputview raw output of R engine
Computing time2 seconds
R Server'Gwilym Jenkins' @ 72.249.127.135

\begin{tabular}{lllllllll}
\hline
Summary of computational transaction \tabularnewline
Raw Input & view raw input (R code)  \tabularnewline
Raw Output & view raw output of R engine  \tabularnewline
Computing time & 2 seconds \tabularnewline
R Server & 'Gwilym Jenkins' @ 72.249.127.135 \tabularnewline
\hline
\end{tabular}
%Source: https://freestatistics.org/blog/index.php?pk=36593&T=0

[TABLE]
[ROW][C]Summary of computational transaction[/C][/ROW]
[ROW][C]Raw Input[/C][C]view raw input (R code) [/C][/ROW]
[ROW][C]Raw Output[/C][C]view raw output of R engine [/C][/ROW]
[ROW][C]Computing time[/C][C]2 seconds[/C][/ROW]
[ROW][C]R Server[/C][C]'Gwilym Jenkins' @ 72.249.127.135[/C][/ROW]
[/TABLE]
Source: https://freestatistics.org/blog/index.php?pk=36593&T=0

Globally Unique Identifier (entire table): ba.freestatistics.org/blog/index.php?pk=36593&T=0

As an alternative you can also use a QR Code:  

The GUIDs for individual cells are displayed in the table below:

Summary of computational transaction
Raw Inputview raw input (R code)
Raw Outputview raw output of R engine
Computing time2 seconds
R Server'Gwilym Jenkins' @ 72.249.127.135


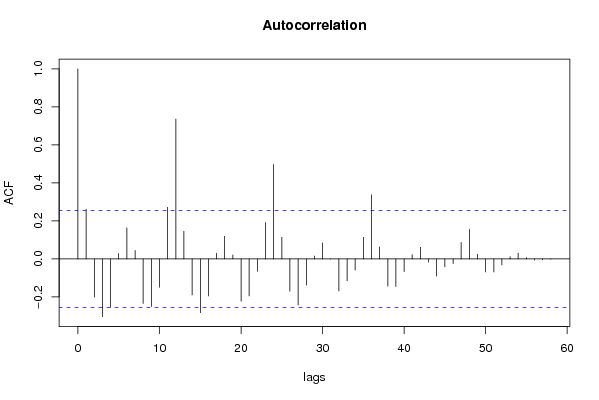
Autocorrelation Function
Time lag kACF(k)T-STATP-value
10.2614892.00850.024585
2-0.20071-1.54170.064248
3-0.303746-2.33310.011536
4-0.254302-1.95330.027764
50.0290920.22350.411974
60.1635631.25630.106971
70.0439880.33790.368326
8-0.234029-1.79760.038678
9-0.250488-1.9240.029589
10-0.148806-1.1430.128827
110.2718412.08810.02056
120.7362265.65510
130.145171.11510.134671
14-0.189588-1.45630.075312
15-0.282722-2.17160.016958
16-0.194432-1.49350.070323
170.0303580.23320.408213
180.1192540.9160.181696
190.0210340.16160.436099
20-0.222232-1.7070.046541
21-0.194775-1.49610.06998
22-0.065289-0.50150.308944
230.1913831.470.073431
240.4971953.8190.000162
250.1138850.87480.192625
26-0.1699-1.3050.098475
27-0.241955-1.85850.034045
28-0.13831-1.06240.146196
290.0152790.11740.453486
300.0849640.65260.258268
31-0.000218-0.00170.499336
32-0.168602-1.29510.100173
33-0.115151-0.88450.190011
34-0.057784-0.44380.329389
350.1136470.87290.193117
360.3376452.59350.005981
370.06250.48010.316477
38-0.143097-1.09920.138084
39-0.145587-1.11830.133991
40-0.066411-0.51010.305937
410.0223730.17190.432071
420.0612580.47050.319856
43-0.01643-0.12620.450002
44-0.089963-0.6910.246133
45-0.041138-0.3160.376565
46-0.024511-0.18830.425656
470.0868020.66670.253769
480.1554591.19410.118609
490.0251260.1930.423812
50-0.068372-0.52520.300714
51-0.068078-0.52290.301496
52-0.03183-0.24450.40385
530.0118740.09120.46382
540.030570.23480.407584
550.0072230.05550.477972
56-0.005133-0.03940.484342
57-0.004383-0.03370.48663
58-0.001229-0.00940.49625
59NANANA
60NANANA

\begin{tabular}{lllllllll}
\hline
Autocorrelation Function \tabularnewline
Time lag k & ACF(k) & T-STAT & P-value \tabularnewline
1 & 0.261489 & 2.0085 & 0.024585 \tabularnewline
2 & -0.20071 & -1.5417 & 0.064248 \tabularnewline
3 & -0.303746 & -2.3331 & 0.011536 \tabularnewline
4 & -0.254302 & -1.9533 & 0.027764 \tabularnewline
5 & 0.029092 & 0.2235 & 0.411974 \tabularnewline
6 & 0.163563 & 1.2563 & 0.106971 \tabularnewline
7 & 0.043988 & 0.3379 & 0.368326 \tabularnewline
8 & -0.234029 & -1.7976 & 0.038678 \tabularnewline
9 & -0.250488 & -1.924 & 0.029589 \tabularnewline
10 & -0.148806 & -1.143 & 0.128827 \tabularnewline
11 & 0.271841 & 2.0881 & 0.02056 \tabularnewline
12 & 0.736226 & 5.6551 & 0 \tabularnewline
13 & 0.14517 & 1.1151 & 0.134671 \tabularnewline
14 & -0.189588 & -1.4563 & 0.075312 \tabularnewline
15 & -0.282722 & -2.1716 & 0.016958 \tabularnewline
16 & -0.194432 & -1.4935 & 0.070323 \tabularnewline
17 & 0.030358 & 0.2332 & 0.408213 \tabularnewline
18 & 0.119254 & 0.916 & 0.181696 \tabularnewline
19 & 0.021034 & 0.1616 & 0.436099 \tabularnewline
20 & -0.222232 & -1.707 & 0.046541 \tabularnewline
21 & -0.194775 & -1.4961 & 0.06998 \tabularnewline
22 & -0.065289 & -0.5015 & 0.308944 \tabularnewline
23 & 0.191383 & 1.47 & 0.073431 \tabularnewline
24 & 0.497195 & 3.819 & 0.000162 \tabularnewline
25 & 0.113885 & 0.8748 & 0.192625 \tabularnewline
26 & -0.1699 & -1.305 & 0.098475 \tabularnewline
27 & -0.241955 & -1.8585 & 0.034045 \tabularnewline
28 & -0.13831 & -1.0624 & 0.146196 \tabularnewline
29 & 0.015279 & 0.1174 & 0.453486 \tabularnewline
30 & 0.084964 & 0.6526 & 0.258268 \tabularnewline
31 & -0.000218 & -0.0017 & 0.499336 \tabularnewline
32 & -0.168602 & -1.2951 & 0.100173 \tabularnewline
33 & -0.115151 & -0.8845 & 0.190011 \tabularnewline
34 & -0.057784 & -0.4438 & 0.329389 \tabularnewline
35 & 0.113647 & 0.8729 & 0.193117 \tabularnewline
36 & 0.337645 & 2.5935 & 0.005981 \tabularnewline
37 & 0.0625 & 0.4801 & 0.316477 \tabularnewline
38 & -0.143097 & -1.0992 & 0.138084 \tabularnewline
39 & -0.145587 & -1.1183 & 0.133991 \tabularnewline
40 & -0.066411 & -0.5101 & 0.305937 \tabularnewline
41 & 0.022373 & 0.1719 & 0.432071 \tabularnewline
42 & 0.061258 & 0.4705 & 0.319856 \tabularnewline
43 & -0.01643 & -0.1262 & 0.450002 \tabularnewline
44 & -0.089963 & -0.691 & 0.246133 \tabularnewline
45 & -0.041138 & -0.316 & 0.376565 \tabularnewline
46 & -0.024511 & -0.1883 & 0.425656 \tabularnewline
47 & 0.086802 & 0.6667 & 0.253769 \tabularnewline
48 & 0.155459 & 1.1941 & 0.118609 \tabularnewline
49 & 0.025126 & 0.193 & 0.423812 \tabularnewline
50 & -0.068372 & -0.5252 & 0.300714 \tabularnewline
51 & -0.068078 & -0.5229 & 0.301496 \tabularnewline
52 & -0.03183 & -0.2445 & 0.40385 \tabularnewline
53 & 0.011874 & 0.0912 & 0.46382 \tabularnewline
54 & 0.03057 & 0.2348 & 0.407584 \tabularnewline
55 & 0.007223 & 0.0555 & 0.477972 \tabularnewline
56 & -0.005133 & -0.0394 & 0.484342 \tabularnewline
57 & -0.004383 & -0.0337 & 0.48663 \tabularnewline
58 & -0.001229 & -0.0094 & 0.49625 \tabularnewline
59 & NA & NA & NA \tabularnewline
60 & NA & NA & NA \tabularnewline
\hline
\end{tabular}
%Source: https://freestatistics.org/blog/index.php?pk=36593&T=1

[TABLE]
[ROW][C]Autocorrelation Function[/C][/ROW]
[ROW][C]Time lag k[/C][C]ACF(k)[/C][C]T-STAT[/C][C]P-value[/C][/ROW]
[ROW][C]1[/C][C]0.261489[/C][C]2.0085[/C][C]0.024585[/C][/ROW]
[ROW][C]2[/C][C]-0.20071[/C][C]-1.5417[/C][C]0.064248[/C][/ROW]
[ROW][C]3[/C][C]-0.303746[/C][C]-2.3331[/C][C]0.011536[/C][/ROW]
[ROW][C]4[/C][C]-0.254302[/C][C]-1.9533[/C][C]0.027764[/C][/ROW]
[ROW][C]5[/C][C]0.029092[/C][C]0.2235[/C][C]0.411974[/C][/ROW]
[ROW][C]6[/C][C]0.163563[/C][C]1.2563[/C][C]0.106971[/C][/ROW]
[ROW][C]7[/C][C]0.043988[/C][C]0.3379[/C][C]0.368326[/C][/ROW]
[ROW][C]8[/C][C]-0.234029[/C][C]-1.7976[/C][C]0.038678[/C][/ROW]
[ROW][C]9[/C][C]-0.250488[/C][C]-1.924[/C][C]0.029589[/C][/ROW]
[ROW][C]10[/C][C]-0.148806[/C][C]-1.143[/C][C]0.128827[/C][/ROW]
[ROW][C]11[/C][C]0.271841[/C][C]2.0881[/C][C]0.02056[/C][/ROW]
[ROW][C]12[/C][C]0.736226[/C][C]5.6551[/C][C]0[/C][/ROW]
[ROW][C]13[/C][C]0.14517[/C][C]1.1151[/C][C]0.134671[/C][/ROW]
[ROW][C]14[/C][C]-0.189588[/C][C]-1.4563[/C][C]0.075312[/C][/ROW]
[ROW][C]15[/C][C]-0.282722[/C][C]-2.1716[/C][C]0.016958[/C][/ROW]
[ROW][C]16[/C][C]-0.194432[/C][C]-1.4935[/C][C]0.070323[/C][/ROW]
[ROW][C]17[/C][C]0.030358[/C][C]0.2332[/C][C]0.408213[/C][/ROW]
[ROW][C]18[/C][C]0.119254[/C][C]0.916[/C][C]0.181696[/C][/ROW]
[ROW][C]19[/C][C]0.021034[/C][C]0.1616[/C][C]0.436099[/C][/ROW]
[ROW][C]20[/C][C]-0.222232[/C][C]-1.707[/C][C]0.046541[/C][/ROW]
[ROW][C]21[/C][C]-0.194775[/C][C]-1.4961[/C][C]0.06998[/C][/ROW]
[ROW][C]22[/C][C]-0.065289[/C][C]-0.5015[/C][C]0.308944[/C][/ROW]
[ROW][C]23[/C][C]0.191383[/C][C]1.47[/C][C]0.073431[/C][/ROW]
[ROW][C]24[/C][C]0.497195[/C][C]3.819[/C][C]0.000162[/C][/ROW]
[ROW][C]25[/C][C]0.113885[/C][C]0.8748[/C][C]0.192625[/C][/ROW]
[ROW][C]26[/C][C]-0.1699[/C][C]-1.305[/C][C]0.098475[/C][/ROW]
[ROW][C]27[/C][C]-0.241955[/C][C]-1.8585[/C][C]0.034045[/C][/ROW]
[ROW][C]28[/C][C]-0.13831[/C][C]-1.0624[/C][C]0.146196[/C][/ROW]
[ROW][C]29[/C][C]0.015279[/C][C]0.1174[/C][C]0.453486[/C][/ROW]
[ROW][C]30[/C][C]0.084964[/C][C]0.6526[/C][C]0.258268[/C][/ROW]
[ROW][C]31[/C][C]-0.000218[/C][C]-0.0017[/C][C]0.499336[/C][/ROW]
[ROW][C]32[/C][C]-0.168602[/C][C]-1.2951[/C][C]0.100173[/C][/ROW]
[ROW][C]33[/C][C]-0.115151[/C][C]-0.8845[/C][C]0.190011[/C][/ROW]
[ROW][C]34[/C][C]-0.057784[/C][C]-0.4438[/C][C]0.329389[/C][/ROW]
[ROW][C]35[/C][C]0.113647[/C][C]0.8729[/C][C]0.193117[/C][/ROW]
[ROW][C]36[/C][C]0.337645[/C][C]2.5935[/C][C]0.005981[/C][/ROW]
[ROW][C]37[/C][C]0.0625[/C][C]0.4801[/C][C]0.316477[/C][/ROW]
[ROW][C]38[/C][C]-0.143097[/C][C]-1.0992[/C][C]0.138084[/C][/ROW]
[ROW][C]39[/C][C]-0.145587[/C][C]-1.1183[/C][C]0.133991[/C][/ROW]
[ROW][C]40[/C][C]-0.066411[/C][C]-0.5101[/C][C]0.305937[/C][/ROW]
[ROW][C]41[/C][C]0.022373[/C][C]0.1719[/C][C]0.432071[/C][/ROW]
[ROW][C]42[/C][C]0.061258[/C][C]0.4705[/C][C]0.319856[/C][/ROW]
[ROW][C]43[/C][C]-0.01643[/C][C]-0.1262[/C][C]0.450002[/C][/ROW]
[ROW][C]44[/C][C]-0.089963[/C][C]-0.691[/C][C]0.246133[/C][/ROW]
[ROW][C]45[/C][C]-0.041138[/C][C]-0.316[/C][C]0.376565[/C][/ROW]
[ROW][C]46[/C][C]-0.024511[/C][C]-0.1883[/C][C]0.425656[/C][/ROW]
[ROW][C]47[/C][C]0.086802[/C][C]0.6667[/C][C]0.253769[/C][/ROW]
[ROW][C]48[/C][C]0.155459[/C][C]1.1941[/C][C]0.118609[/C][/ROW]
[ROW][C]49[/C][C]0.025126[/C][C]0.193[/C][C]0.423812[/C][/ROW]
[ROW][C]50[/C][C]-0.068372[/C][C]-0.5252[/C][C]0.300714[/C][/ROW]
[ROW][C]51[/C][C]-0.068078[/C][C]-0.5229[/C][C]0.301496[/C][/ROW]
[ROW][C]52[/C][C]-0.03183[/C][C]-0.2445[/C][C]0.40385[/C][/ROW]
[ROW][C]53[/C][C]0.011874[/C][C]0.0912[/C][C]0.46382[/C][/ROW]
[ROW][C]54[/C][C]0.03057[/C][C]0.2348[/C][C]0.407584[/C][/ROW]
[ROW][C]55[/C][C]0.007223[/C][C]0.0555[/C][C]0.477972[/C][/ROW]
[ROW][C]56[/C][C]-0.005133[/C][C]-0.0394[/C][C]0.484342[/C][/ROW]
[ROW][C]57[/C][C]-0.004383[/C][C]-0.0337[/C][C]0.48663[/C][/ROW]
[ROW][C]58[/C][C]-0.001229[/C][C]-0.0094[/C][C]0.49625[/C][/ROW]
[ROW][C]59[/C][C]NA[/C][C]NA[/C][C]NA[/C][/ROW]
[ROW][C]60[/C][C]NA[/C][C]NA[/C][C]NA[/C][/ROW]
[/TABLE]
Source: https://freestatistics.org/blog/index.php?pk=36593&T=1

Globally Unique Identifier (entire table): ba.freestatistics.org/blog/index.php?pk=36593&T=1

As an alternative you can also use a QR Code:  

The GUIDs for individual cells are displayed in the table below:

Autocorrelation Function
Time lag kACF(k)T-STATP-value
10.2614892.00850.024585
2-0.20071-1.54170.064248
3-0.303746-2.33310.011536
4-0.254302-1.95330.027764
50.0290920.22350.411974
60.1635631.25630.106971
70.0439880.33790.368326
8-0.234029-1.79760.038678
9-0.250488-1.9240.029589
10-0.148806-1.1430.128827
110.2718412.08810.02056
120.7362265.65510
130.145171.11510.134671
14-0.189588-1.45630.075312
15-0.282722-2.17160.016958
16-0.194432-1.49350.070323
170.0303580.23320.408213
180.1192540.9160.181696
190.0210340.16160.436099
20-0.222232-1.7070.046541
21-0.194775-1.49610.06998
22-0.065289-0.50150.308944
230.1913831.470.073431
240.4971953.8190.000162
250.1138850.87480.192625
26-0.1699-1.3050.098475
27-0.241955-1.85850.034045
28-0.13831-1.06240.146196
290.0152790.11740.453486
300.0849640.65260.258268
31-0.000218-0.00170.499336
32-0.168602-1.29510.100173
33-0.115151-0.88450.190011
34-0.057784-0.44380.329389
350.1136470.87290.193117
360.3376452.59350.005981
370.06250.48010.316477
38-0.143097-1.09920.138084
39-0.145587-1.11830.133991
40-0.066411-0.51010.305937
410.0223730.17190.432071
420.0612580.47050.319856
43-0.01643-0.12620.450002
44-0.089963-0.6910.246133
45-0.041138-0.3160.376565
46-0.024511-0.18830.425656
470.0868020.66670.253769
480.1554591.19410.118609
490.0251260.1930.423812
50-0.068372-0.52520.300714
51-0.068078-0.52290.301496
52-0.03183-0.24450.40385
530.0118740.09120.46382
540.030570.23480.407584
550.0072230.05550.477972
56-0.005133-0.03940.484342
57-0.004383-0.03370.48663
58-0.001229-0.00940.49625
59NANANA
60NANANA


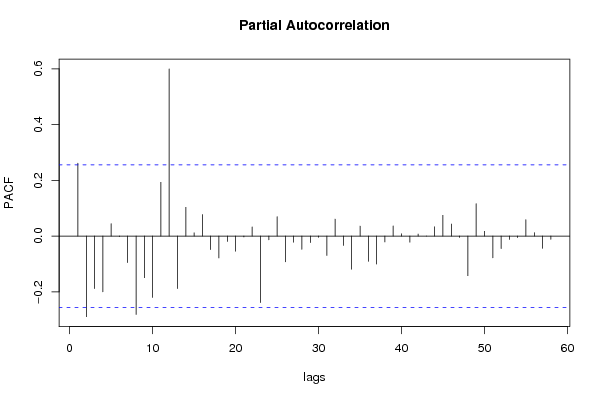
Partial Autocorrelation Function
Time lag kPACF(k)T-STATP-value
10.2614892.00850.024585
2-0.288837-2.21860.015187
3-0.188049-1.44440.076954
4-0.199722-1.53410.065176
50.0443660.34080.36724
6-0.001676-0.01290.494886
7-0.095017-0.72980.234187
8-0.280928-2.15780.017511
9-0.149328-1.1470.128003
10-0.219934-1.68930.048216
110.1930671.4830.071702
120.5993334.60361.1e-05
13-0.188169-1.44540.076824
140.1034240.79440.215069
150.0116610.08960.464466
160.0771720.59280.2778
17-0.048491-0.37250.35544
18-0.078114-0.60.275399
19-0.019047-0.14630.442091
20-0.053918-0.41410.340134
21-0.002845-0.02190.491319
220.0329330.2530.400588
23-0.238478-1.83180.036016
24-0.013211-0.10150.459757
250.0697990.53610.296939
26-0.092397-0.70970.240339
27-0.021887-0.16810.433533
28-0.047502-0.36490.358258
29-0.023217-0.17830.429536
30-0.004491-0.03450.486298
31-0.069275-0.53210.298323
320.0608710.46760.320912
33-0.033566-0.25780.398718
34-0.118616-0.91110.182974
350.0357670.27470.392241
36-0.0903-0.69360.245326
37-0.100258-0.77010.222157
38-0.021086-0.1620.435943
390.0365280.28060.390009
400.0081080.06230.475275
41-0.02178-0.16730.433855
420.0073450.05640.477601
43-8e-06-1e-040.499976
440.0331540.25470.399935
450.0747130.57390.284116
460.0432590.33230.370428
47-0.004623-0.03550.485897
48-0.14217-1.0920.139631
490.1163160.89340.187626
500.0170510.1310.448121
51-0.077979-0.5990.275745
52-0.044605-0.34260.366552
53-0.011946-0.09180.463599
54-0.005212-0.040.484099
550.0587310.45110.326779
560.0123880.09520.462258
57-0.043743-0.3360.369034
58-0.011534-0.08860.464852
59NANANA
60NANANA

\begin{tabular}{lllllllll}
\hline
Partial Autocorrelation Function \tabularnewline
Time lag k & PACF(k) & T-STAT & P-value \tabularnewline
1 & 0.261489 & 2.0085 & 0.024585 \tabularnewline
2 & -0.288837 & -2.2186 & 0.015187 \tabularnewline
3 & -0.188049 & -1.4444 & 0.076954 \tabularnewline
4 & -0.199722 & -1.5341 & 0.065176 \tabularnewline
5 & 0.044366 & 0.3408 & 0.36724 \tabularnewline
6 & -0.001676 & -0.0129 & 0.494886 \tabularnewline
7 & -0.095017 & -0.7298 & 0.234187 \tabularnewline
8 & -0.280928 & -2.1578 & 0.017511 \tabularnewline
9 & -0.149328 & -1.147 & 0.128003 \tabularnewline
10 & -0.219934 & -1.6893 & 0.048216 \tabularnewline
11 & 0.193067 & 1.483 & 0.071702 \tabularnewline
12 & 0.599333 & 4.6036 & 1.1e-05 \tabularnewline
13 & -0.188169 & -1.4454 & 0.076824 \tabularnewline
14 & 0.103424 & 0.7944 & 0.215069 \tabularnewline
15 & 0.011661 & 0.0896 & 0.464466 \tabularnewline
16 & 0.077172 & 0.5928 & 0.2778 \tabularnewline
17 & -0.048491 & -0.3725 & 0.35544 \tabularnewline
18 & -0.078114 & -0.6 & 0.275399 \tabularnewline
19 & -0.019047 & -0.1463 & 0.442091 \tabularnewline
20 & -0.053918 & -0.4141 & 0.340134 \tabularnewline
21 & -0.002845 & -0.0219 & 0.491319 \tabularnewline
22 & 0.032933 & 0.253 & 0.400588 \tabularnewline
23 & -0.238478 & -1.8318 & 0.036016 \tabularnewline
24 & -0.013211 & -0.1015 & 0.459757 \tabularnewline
25 & 0.069799 & 0.5361 & 0.296939 \tabularnewline
26 & -0.092397 & -0.7097 & 0.240339 \tabularnewline
27 & -0.021887 & -0.1681 & 0.433533 \tabularnewline
28 & -0.047502 & -0.3649 & 0.358258 \tabularnewline
29 & -0.023217 & -0.1783 & 0.429536 \tabularnewline
30 & -0.004491 & -0.0345 & 0.486298 \tabularnewline
31 & -0.069275 & -0.5321 & 0.298323 \tabularnewline
32 & 0.060871 & 0.4676 & 0.320912 \tabularnewline
33 & -0.033566 & -0.2578 & 0.398718 \tabularnewline
34 & -0.118616 & -0.9111 & 0.182974 \tabularnewline
35 & 0.035767 & 0.2747 & 0.392241 \tabularnewline
36 & -0.0903 & -0.6936 & 0.245326 \tabularnewline
37 & -0.100258 & -0.7701 & 0.222157 \tabularnewline
38 & -0.021086 & -0.162 & 0.435943 \tabularnewline
39 & 0.036528 & 0.2806 & 0.390009 \tabularnewline
40 & 0.008108 & 0.0623 & 0.475275 \tabularnewline
41 & -0.02178 & -0.1673 & 0.433855 \tabularnewline
42 & 0.007345 & 0.0564 & 0.477601 \tabularnewline
43 & -8e-06 & -1e-04 & 0.499976 \tabularnewline
44 & 0.033154 & 0.2547 & 0.399935 \tabularnewline
45 & 0.074713 & 0.5739 & 0.284116 \tabularnewline
46 & 0.043259 & 0.3323 & 0.370428 \tabularnewline
47 & -0.004623 & -0.0355 & 0.485897 \tabularnewline
48 & -0.14217 & -1.092 & 0.139631 \tabularnewline
49 & 0.116316 & 0.8934 & 0.187626 \tabularnewline
50 & 0.017051 & 0.131 & 0.448121 \tabularnewline
51 & -0.077979 & -0.599 & 0.275745 \tabularnewline
52 & -0.044605 & -0.3426 & 0.366552 \tabularnewline
53 & -0.011946 & -0.0918 & 0.463599 \tabularnewline
54 & -0.005212 & -0.04 & 0.484099 \tabularnewline
55 & 0.058731 & 0.4511 & 0.326779 \tabularnewline
56 & 0.012388 & 0.0952 & 0.462258 \tabularnewline
57 & -0.043743 & -0.336 & 0.369034 \tabularnewline
58 & -0.011534 & -0.0886 & 0.464852 \tabularnewline
59 & NA & NA & NA \tabularnewline
60 & NA & NA & NA \tabularnewline
\hline
\end{tabular}
%Source: https://freestatistics.org/blog/index.php?pk=36593&T=2

[TABLE]
[ROW][C]Partial Autocorrelation Function[/C][/ROW]
[ROW][C]Time lag k[/C][C]PACF(k)[/C][C]T-STAT[/C][C]P-value[/C][/ROW]
[ROW][C]1[/C][C]0.261489[/C][C]2.0085[/C][C]0.024585[/C][/ROW]
[ROW][C]2[/C][C]-0.288837[/C][C]-2.2186[/C][C]0.015187[/C][/ROW]
[ROW][C]3[/C][C]-0.188049[/C][C]-1.4444[/C][C]0.076954[/C][/ROW]
[ROW][C]4[/C][C]-0.199722[/C][C]-1.5341[/C][C]0.065176[/C][/ROW]
[ROW][C]5[/C][C]0.044366[/C][C]0.3408[/C][C]0.36724[/C][/ROW]
[ROW][C]6[/C][C]-0.001676[/C][C]-0.0129[/C][C]0.494886[/C][/ROW]
[ROW][C]7[/C][C]-0.095017[/C][C]-0.7298[/C][C]0.234187[/C][/ROW]
[ROW][C]8[/C][C]-0.280928[/C][C]-2.1578[/C][C]0.017511[/C][/ROW]
[ROW][C]9[/C][C]-0.149328[/C][C]-1.147[/C][C]0.128003[/C][/ROW]
[ROW][C]10[/C][C]-0.219934[/C][C]-1.6893[/C][C]0.048216[/C][/ROW]
[ROW][C]11[/C][C]0.193067[/C][C]1.483[/C][C]0.071702[/C][/ROW]
[ROW][C]12[/C][C]0.599333[/C][C]4.6036[/C][C]1.1e-05[/C][/ROW]
[ROW][C]13[/C][C]-0.188169[/C][C]-1.4454[/C][C]0.076824[/C][/ROW]
[ROW][C]14[/C][C]0.103424[/C][C]0.7944[/C][C]0.215069[/C][/ROW]
[ROW][C]15[/C][C]0.011661[/C][C]0.0896[/C][C]0.464466[/C][/ROW]
[ROW][C]16[/C][C]0.077172[/C][C]0.5928[/C][C]0.2778[/C][/ROW]
[ROW][C]17[/C][C]-0.048491[/C][C]-0.3725[/C][C]0.35544[/C][/ROW]
[ROW][C]18[/C][C]-0.078114[/C][C]-0.6[/C][C]0.275399[/C][/ROW]
[ROW][C]19[/C][C]-0.019047[/C][C]-0.1463[/C][C]0.442091[/C][/ROW]
[ROW][C]20[/C][C]-0.053918[/C][C]-0.4141[/C][C]0.340134[/C][/ROW]
[ROW][C]21[/C][C]-0.002845[/C][C]-0.0219[/C][C]0.491319[/C][/ROW]
[ROW][C]22[/C][C]0.032933[/C][C]0.253[/C][C]0.400588[/C][/ROW]
[ROW][C]23[/C][C]-0.238478[/C][C]-1.8318[/C][C]0.036016[/C][/ROW]
[ROW][C]24[/C][C]-0.013211[/C][C]-0.1015[/C][C]0.459757[/C][/ROW]
[ROW][C]25[/C][C]0.069799[/C][C]0.5361[/C][C]0.296939[/C][/ROW]
[ROW][C]26[/C][C]-0.092397[/C][C]-0.7097[/C][C]0.240339[/C][/ROW]
[ROW][C]27[/C][C]-0.021887[/C][C]-0.1681[/C][C]0.433533[/C][/ROW]
[ROW][C]28[/C][C]-0.047502[/C][C]-0.3649[/C][C]0.358258[/C][/ROW]
[ROW][C]29[/C][C]-0.023217[/C][C]-0.1783[/C][C]0.429536[/C][/ROW]
[ROW][C]30[/C][C]-0.004491[/C][C]-0.0345[/C][C]0.486298[/C][/ROW]
[ROW][C]31[/C][C]-0.069275[/C][C]-0.5321[/C][C]0.298323[/C][/ROW]
[ROW][C]32[/C][C]0.060871[/C][C]0.4676[/C][C]0.320912[/C][/ROW]
[ROW][C]33[/C][C]-0.033566[/C][C]-0.2578[/C][C]0.398718[/C][/ROW]
[ROW][C]34[/C][C]-0.118616[/C][C]-0.9111[/C][C]0.182974[/C][/ROW]
[ROW][C]35[/C][C]0.035767[/C][C]0.2747[/C][C]0.392241[/C][/ROW]
[ROW][C]36[/C][C]-0.0903[/C][C]-0.6936[/C][C]0.245326[/C][/ROW]
[ROW][C]37[/C][C]-0.100258[/C][C]-0.7701[/C][C]0.222157[/C][/ROW]
[ROW][C]38[/C][C]-0.021086[/C][C]-0.162[/C][C]0.435943[/C][/ROW]
[ROW][C]39[/C][C]0.036528[/C][C]0.2806[/C][C]0.390009[/C][/ROW]
[ROW][C]40[/C][C]0.008108[/C][C]0.0623[/C][C]0.475275[/C][/ROW]
[ROW][C]41[/C][C]-0.02178[/C][C]-0.1673[/C][C]0.433855[/C][/ROW]
[ROW][C]42[/C][C]0.007345[/C][C]0.0564[/C][C]0.477601[/C][/ROW]
[ROW][C]43[/C][C]-8e-06[/C][C]-1e-04[/C][C]0.499976[/C][/ROW]
[ROW][C]44[/C][C]0.033154[/C][C]0.2547[/C][C]0.399935[/C][/ROW]
[ROW][C]45[/C][C]0.074713[/C][C]0.5739[/C][C]0.284116[/C][/ROW]
[ROW][C]46[/C][C]0.043259[/C][C]0.3323[/C][C]0.370428[/C][/ROW]
[ROW][C]47[/C][C]-0.004623[/C][C]-0.0355[/C][C]0.485897[/C][/ROW]
[ROW][C]48[/C][C]-0.14217[/C][C]-1.092[/C][C]0.139631[/C][/ROW]
[ROW][C]49[/C][C]0.116316[/C][C]0.8934[/C][C]0.187626[/C][/ROW]
[ROW][C]50[/C][C]0.017051[/C][C]0.131[/C][C]0.448121[/C][/ROW]
[ROW][C]51[/C][C]-0.077979[/C][C]-0.599[/C][C]0.275745[/C][/ROW]
[ROW][C]52[/C][C]-0.044605[/C][C]-0.3426[/C][C]0.366552[/C][/ROW]
[ROW][C]53[/C][C]-0.011946[/C][C]-0.0918[/C][C]0.463599[/C][/ROW]
[ROW][C]54[/C][C]-0.005212[/C][C]-0.04[/C][C]0.484099[/C][/ROW]
[ROW][C]55[/C][C]0.058731[/C][C]0.4511[/C][C]0.326779[/C][/ROW]
[ROW][C]56[/C][C]0.012388[/C][C]0.0952[/C][C]0.462258[/C][/ROW]
[ROW][C]57[/C][C]-0.043743[/C][C]-0.336[/C][C]0.369034[/C][/ROW]
[ROW][C]58[/C][C]-0.011534[/C][C]-0.0886[/C][C]0.464852[/C][/ROW]
[ROW][C]59[/C][C]NA[/C][C]NA[/C][C]NA[/C][/ROW]
[ROW][C]60[/C][C]NA[/C][C]NA[/C][C]NA[/C][/ROW]
[/TABLE]
Source: https://freestatistics.org/blog/index.php?pk=36593&T=2

Globally Unique Identifier (entire table): ba.freestatistics.org/blog/index.php?pk=36593&T=2

As an alternative you can also use a QR Code:  

The GUIDs for individual cells are displayed in the table below:

Partial Autocorrelation Function
Time lag kPACF(k)T-STATP-value
10.2614892.00850.024585
2-0.288837-2.21860.015187
3-0.188049-1.44440.076954
4-0.199722-1.53410.065176
50.0443660.34080.36724
6-0.001676-0.01290.494886
7-0.095017-0.72980.234187
8-0.280928-2.15780.017511
9-0.149328-1.1470.128003
10-0.219934-1.68930.048216
110.1930671.4830.071702
120.5993334.60361.1e-05
13-0.188169-1.44540.076824
140.1034240.79440.215069
150.0116610.08960.464466
160.0771720.59280.2778
17-0.048491-0.37250.35544
18-0.078114-0.60.275399
19-0.019047-0.14630.442091
20-0.053918-0.41410.340134
21-0.002845-0.02190.491319
220.0329330.2530.400588
23-0.238478-1.83180.036016
24-0.013211-0.10150.459757
250.0697990.53610.296939
26-0.092397-0.70970.240339
27-0.021887-0.16810.433533
28-0.047502-0.36490.358258
29-0.023217-0.17830.429536
30-0.004491-0.03450.486298
31-0.069275-0.53210.298323
320.0608710.46760.320912
33-0.033566-0.25780.398718
34-0.118616-0.91110.182974
350.0357670.27470.392241
36-0.0903-0.69360.245326
37-0.100258-0.77010.222157
38-0.021086-0.1620.435943
390.0365280.28060.390009
400.0081080.06230.475275
41-0.02178-0.16730.433855
420.0073450.05640.477601
43-8e-06-1e-040.499976
440.0331540.25470.399935
450.0747130.57390.284116
460.0432590.33230.370428
47-0.004623-0.03550.485897
48-0.14217-1.0920.139631
490.1163160.89340.187626
500.0170510.1310.448121
51-0.077979-0.5990.275745
52-0.044605-0.34260.366552
53-0.011946-0.09180.463599
54-0.005212-0.040.484099
550.0587310.45110.326779
560.0123880.09520.462258
57-0.043743-0.3360.369034
58-0.011534-0.08860.464852
59NANANA
60NANANA


Parameters (Session):
par1 = 60 ; par2 = 1 ; par3 = 1 ; par4 = 0 ; par5 = 12 ;
Parameters (R input):
par1 = 60 ; par2 = 1 ; par3 = 1 ; par4 = 0 ; par5 = 12 ;
R code (references can be found in the software module):
if (par1 == 'Default') {
par1 = 10*log10(length(x))
} else {
par1 <- as.numeric(par1)
}
par2 <- as.numeric(par2)
par3 <- as.numeric(par3)
par4 <- as.numeric(par4)
par5 <- as.numeric(par5)
if (par2 == 0) {
x <- log(x)
} else {
x <- (x ^ par2 - 1) / par2
}
if (par3 > 0) x <- diff(x,lag=1,difference=par3)
if (par4 > 0) x <- diff(x,lag=par5,difference=par4)
bitmap(file='pic1.png')
racf <- acf(x,par1,main='Autocorrelation',xlab='lags',ylab='ACF')
dev.off()
bitmap(file='pic2.png')
rpacf <- pacf(x,par1,main='Partial Autocorrelation',xlab='lags',ylab='PACF')
dev.off()
(myacf <- c(racf$acf))
(mypacf <- c(rpacf$acf))
lengthx <- length(x)
sqrtn <- sqrt(lengthx)
load(file='createtable')
a<-table.start()
a<-table.row.start(a)
a<-table.element(a,'Autocorrelation Function',4,TRUE)
a<-table.row.end(a)
a<-table.row.start(a)
a<-table.element(a,'Time lag k',header=TRUE)
a<-table.element(a,hyperlink('basics.htm','ACF(k)','click here for more information about the Autocorrelation Function'),header=TRUE)
a<-table.element(a,'T-STAT',header=TRUE)
a<-table.element(a,'P-value',header=TRUE)
a<-table.row.end(a)
for (i in 2:(par1+1)) {
a<-table.row.start(a)
a<-table.element(a,i-1,header=TRUE)
a<-table.element(a,round(myacf[i],6))
mytstat <- myacf[i]*sqrtn
a<-table.element(a,round(mytstat,4))
a<-table.element(a,round(1-pt(abs(mytstat),lengthx),6))
a<-table.row.end(a)
}
a<-table.end(a)
table.save(a,file='mytable.tab')
a<-table.start()
a<-table.row.start(a)
a<-table.element(a,'Partial Autocorrelation Function',4,TRUE)
a<-table.row.end(a)
a<-table.row.start(a)
a<-table.element(a,'Time lag k',header=TRUE)
a<-table.element(a,hyperlink('basics.htm','PACF(k)','click here for more information about the Partial Autocorrelation Function'),header=TRUE)
a<-table.element(a,'T-STAT',header=TRUE)
a<-table.element(a,'P-value',header=TRUE)
a<-table.row.end(a)
for (i in 1:par1) {
a<-table.row.start(a)
a<-table.element(a,i,header=TRUE)
a<-table.element(a,round(mypacf[i],6))
mytstat <- mypacf[i]*sqrtn
a<-table.element(a,round(mytstat,4))
a<-table.element(a,round(1-pt(abs(mytstat),lengthx),6))
a<-table.row.end(a)
}
a<-table.end(a)
table.save(a,file='mytable1.tab')