Free Statistics

of Irreproducible Research!

Author's title

Author*The author of this computation has been verified*
R Software Modulerwasp_cross.wasp
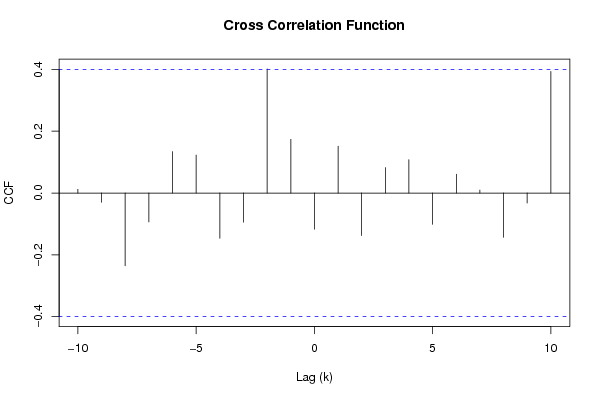
Title produced by softwareCross Correlation Function
Date of computationWed, 24 Dec 2008 04:49:40 -0700
Cite this page as followsStatistical Computations at FreeStatistics.org, Office for Research Development and Education, URL https://freestatistics.org/blog/index.php?v=date/2008/Dec/24/t1230119429kbd5jun7kpwteiz.htm/, Retrieved Fri, 17 May 2024 04:10:17 +0000
Statistical Computations at FreeStatistics.org, Office for Research Development and Education, URL https://freestatistics.org/blog/index.php?pk=36475, Retrieved Fri, 17 May 2024 04:10:17 +0000
QR Codes:

Original text written by user:
IsPrivate?No (this computation is public)
User-defined keywords
Estimated Impact210
Family? (F = Feedback message, R = changed R code, M = changed R Module, P = changed Parameters, D = changed Data)
-     [Cross Correlation Function] [cross correlation...] [2007-12-24 07:43:55] [707a919fab5d6f3020ea3c395672cd86]
-   PD    [Cross Correlation Function] [] [2008-12-24 11:49:40] [e7fa5259715477c9f32960f5b339b707] [Current]
-           [Cross Correlation Function] [] [2008-12-24 11:51:32] [0e3da40906c04c6abfe5eb434331b3f1]
Feedback Forum

Post a new message
Dataseries X:
467
460
448
443
436
431
484
510
513
503
471
471
476
475
470
461
455
456
517
525
523
519
509
512
519
517
510
509
501
507
569
580
578
565
547
555
Dataseries Y:
98,1
101,1
111,1
93,3
100
108
70,4
75,4
105,5
112,3
102,5
93,5
86,7
95,2
103,8
97
95,5
101
67,5
64
106,7
100,6
101,2
93,1
84,2
85,8
91,8
92,4
80,3
79,7
62,5
57,1
100,8
100,7
86,2
83,2


Summary of computational transaction
Raw Inputview raw input (R code)
Raw Outputview raw output of R engine
Computing time2 seconds
R Server'Sir Ronald Aylmer Fisher' @ 193.190.124.24

\begin{tabular}{lllllllll}
\hline
Summary of computational transaction \tabularnewline
Raw Input & view raw input (R code)  \tabularnewline
Raw Output & view raw output of R engine  \tabularnewline
Computing time & 2 seconds \tabularnewline
R Server & 'Sir Ronald Aylmer Fisher' @ 193.190.124.24 \tabularnewline
\hline
\end{tabular}
%Source: https://freestatistics.org/blog/index.php?pk=36475&T=0

[TABLE]
[ROW][C]Summary of computational transaction[/C][/ROW]
[ROW][C]Raw Input[/C][C]view raw input (R code) [/C][/ROW]
[ROW][C]Raw Output[/C][C]view raw output of R engine [/C][/ROW]
[ROW][C]Computing time[/C][C]2 seconds[/C][/ROW]
[ROW][C]R Server[/C][C]'Sir Ronald Aylmer Fisher' @ 193.190.124.24[/C][/ROW]
[/TABLE]
Source: https://freestatistics.org/blog/index.php?pk=36475&T=0

Globally Unique Identifier (entire table): ba.freestatistics.org/blog/index.php?pk=36475&T=0

As an alternative you can also use a QR Code:  

The GUIDs for individual cells are displayed in the table below:

Summary of computational transaction
Raw Inputview raw input (R code)
Raw Outputview raw output of R engine
Computing time2 seconds
R Server'Sir Ronald Aylmer Fisher' @ 193.190.124.24


Cross Correlation Function
ParameterValue
Box-Cox transformation parameter (lambda) of X series1
Degree of non-seasonal differencing (d) of X series1
Degree of seasonal differencing (D) of X series1
Seasonal Period (s)12
Box-Cox transformation parameter (lambda) of Y series1
Degree of non-seasonal differencing (d) of Y series0
Degree of seasonal differencing (D) of Y series1
krho(Y[t],X[t+k])
-100.0118900710793035
-9-0.0297932317875665
-8-0.235263044460185
-7-0.0934057960660452
-60.134015818409933
-50.122692143218108
-4-0.146353464899326
-3-0.09424588021854
-20.401421981004403
-10.173566240314950
0-0.116998313273595
10.151483467579749
2-0.137507068229878
30.0822980872653532
40.107706361459643
5-0.101467752469422
60.0610708392839108
70.00933937033334672
8-0.143422925362282
9-0.0324352773989435
100.392956721868204

\begin{tabular}{lllllllll}
\hline
Cross Correlation Function \tabularnewline
Parameter & Value \tabularnewline
Box-Cox transformation parameter (lambda) of X series & 1 \tabularnewline
Degree of non-seasonal differencing (d) of X series & 1 \tabularnewline
Degree of seasonal differencing (D) of X series & 1 \tabularnewline
Seasonal Period (s) & 12 \tabularnewline
Box-Cox transformation parameter (lambda) of Y series & 1 \tabularnewline
Degree of non-seasonal differencing (d) of Y series & 0 \tabularnewline
Degree of seasonal differencing (D) of Y series & 1 \tabularnewline
k & rho(Y[t],X[t+k]) \tabularnewline
-10 & 0.0118900710793035 \tabularnewline
-9 & -0.0297932317875665 \tabularnewline
-8 & -0.235263044460185 \tabularnewline
-7 & -0.0934057960660452 \tabularnewline
-6 & 0.134015818409933 \tabularnewline
-5 & 0.122692143218108 \tabularnewline
-4 & -0.146353464899326 \tabularnewline
-3 & -0.09424588021854 \tabularnewline
-2 & 0.401421981004403 \tabularnewline
-1 & 0.173566240314950 \tabularnewline
0 & -0.116998313273595 \tabularnewline
1 & 0.151483467579749 \tabularnewline
2 & -0.137507068229878 \tabularnewline
3 & 0.0822980872653532 \tabularnewline
4 & 0.107706361459643 \tabularnewline
5 & -0.101467752469422 \tabularnewline
6 & 0.0610708392839108 \tabularnewline
7 & 0.00933937033334672 \tabularnewline
8 & -0.143422925362282 \tabularnewline
9 & -0.0324352773989435 \tabularnewline
10 & 0.392956721868204 \tabularnewline
\hline
\end{tabular}
%Source: https://freestatistics.org/blog/index.php?pk=36475&T=1

[TABLE]
[ROW][C]Cross Correlation Function[/C][/ROW]
[ROW][C]Parameter[/C][C]Value[/C][/ROW]
[ROW][C]Box-Cox transformation parameter (lambda) of X series[/C][C]1[/C][/ROW]
[ROW][C]Degree of non-seasonal differencing (d) of X series[/C][C]1[/C][/ROW]
[ROW][C]Degree of seasonal differencing (D) of X series[/C][C]1[/C][/ROW]
[ROW][C]Seasonal Period (s)[/C][C]12[/C][/ROW]
[ROW][C]Box-Cox transformation parameter (lambda) of Y series[/C][C]1[/C][/ROW]
[ROW][C]Degree of non-seasonal differencing (d) of Y series[/C][C]0[/C][/ROW]
[ROW][C]Degree of seasonal differencing (D) of Y series[/C][C]1[/C][/ROW]
[ROW][C]k[/C][C]rho(Y[t],X[t+k])[/C][/ROW]
[ROW][C]-10[/C][C]0.0118900710793035[/C][/ROW]
[ROW][C]-9[/C][C]-0.0297932317875665[/C][/ROW]
[ROW][C]-8[/C][C]-0.235263044460185[/C][/ROW]
[ROW][C]-7[/C][C]-0.0934057960660452[/C][/ROW]
[ROW][C]-6[/C][C]0.134015818409933[/C][/ROW]
[ROW][C]-5[/C][C]0.122692143218108[/C][/ROW]
[ROW][C]-4[/C][C]-0.146353464899326[/C][/ROW]
[ROW][C]-3[/C][C]-0.09424588021854[/C][/ROW]
[ROW][C]-2[/C][C]0.401421981004403[/C][/ROW]
[ROW][C]-1[/C][C]0.173566240314950[/C][/ROW]
[ROW][C]0[/C][C]-0.116998313273595[/C][/ROW]
[ROW][C]1[/C][C]0.151483467579749[/C][/ROW]
[ROW][C]2[/C][C]-0.137507068229878[/C][/ROW]
[ROW][C]3[/C][C]0.0822980872653532[/C][/ROW]
[ROW][C]4[/C][C]0.107706361459643[/C][/ROW]
[ROW][C]5[/C][C]-0.101467752469422[/C][/ROW]
[ROW][C]6[/C][C]0.0610708392839108[/C][/ROW]
[ROW][C]7[/C][C]0.00933937033334672[/C][/ROW]
[ROW][C]8[/C][C]-0.143422925362282[/C][/ROW]
[ROW][C]9[/C][C]-0.0324352773989435[/C][/ROW]
[ROW][C]10[/C][C]0.392956721868204[/C][/ROW]
[/TABLE]
Source: https://freestatistics.org/blog/index.php?pk=36475&T=1

Globally Unique Identifier (entire table): ba.freestatistics.org/blog/index.php?pk=36475&T=1

As an alternative you can also use a QR Code:  

The GUIDs for individual cells are displayed in the table below:

Cross Correlation Function
ParameterValue
Box-Cox transformation parameter (lambda) of X series1
Degree of non-seasonal differencing (d) of X series1
Degree of seasonal differencing (D) of X series1
Seasonal Period (s)12
Box-Cox transformation parameter (lambda) of Y series1
Degree of non-seasonal differencing (d) of Y series0
Degree of seasonal differencing (D) of Y series1
krho(Y[t],X[t+k])
-100.0118900710793035
-9-0.0297932317875665
-8-0.235263044460185
-7-0.0934057960660452
-60.134015818409933
-50.122692143218108
-4-0.146353464899326
-3-0.09424588021854
-20.401421981004403
-10.173566240314950
0-0.116998313273595
10.151483467579749
2-0.137507068229878
30.0822980872653532
40.107706361459643
5-0.101467752469422
60.0610708392839108
70.00933937033334672
8-0.143422925362282
9-0.0324352773989435
100.392956721868204


Parameters (Session):
par1 = 1 ; par2 = 1 ; par3 = 1 ; par4 = 12 ; par5 = 1 ; par6 = 0 ; par7 = 1 ;
Parameters (R input):
par1 = 1 ; par2 = 1 ; par3 = 1 ; par4 = 12 ; par5 = 1 ; par6 = 0 ; par7 = 1 ;
R code (references can be found in the software module):
par1 <- as.numeric(par1)
par2 <- as.numeric(par2)
par3 <- as.numeric(par3)
par4 <- as.numeric(par4)
par5 <- as.numeric(par5)
par6 <- as.numeric(par6)
par7 <- as.numeric(par7)
if (par1 == 0) {
x <- log(x)
} else {
x <- (x ^ par1 - 1) / par1
}
if (par5 == 0) {
y <- log(y)
} else {
y <- (y ^ par5 - 1) / par5
}
if (par2 > 0) x <- diff(x,lag=1,difference=par2)
if (par6 > 0) y <- diff(y,lag=1,difference=par6)
if (par3 > 0) x <- diff(x,lag=par4,difference=par3)
if (par7 > 0) x <- diff(y,lag=par4,difference=par7)
x
y
bitmap(file='test1.png')
(r <- ccf(x,y,main='Cross Correlation Function',ylab='CCF',xlab='Lag (k)'))
dev.off()
load(file='createtable')
a<-table.start()
a<-table.row.start(a)
a<-table.element(a,'Cross Correlation Function',2,TRUE)
a<-table.row.end(a)
a<-table.row.start(a)
a<-table.element(a,'Parameter',header=TRUE)
a<-table.element(a,'Value',header=TRUE)
a<-table.row.end(a)
a<-table.row.start(a)
a<-table.element(a,'Box-Cox transformation parameter (lambda) of X series',header=TRUE)
a<-table.element(a,par1)
a<-table.row.end(a)
a<-table.row.start(a)
a<-table.element(a,'Degree of non-seasonal differencing (d) of X series',header=TRUE)
a<-table.element(a,par2)
a<-table.row.end(a)
a<-table.row.start(a)
a<-table.element(a,'Degree of seasonal differencing (D) of X series',header=TRUE)
a<-table.element(a,par3)
a<-table.row.end(a)
a<-table.row.start(a)
a<-table.element(a,'Seasonal Period (s)',header=TRUE)
a<-table.element(a,par4)
a<-table.row.end(a)
a<-table.row.start(a)
a<-table.element(a,'Box-Cox transformation parameter (lambda) of Y series',header=TRUE)
a<-table.element(a,par5)
a<-table.row.end(a)
a<-table.row.start(a)
a<-table.element(a,'Degree of non-seasonal differencing (d) of Y series',header=TRUE)
a<-table.element(a,par6)
a<-table.row.end(a)
a<-table.row.start(a)
a<-table.element(a,'Degree of seasonal differencing (D) of Y series',header=TRUE)
a<-table.element(a,par7)
a<-table.row.end(a)
a<-table.row.start(a)
a<-table.element(a,'k',header=TRUE)
a<-table.element(a,'rho(Y[t],X[t+k])',header=TRUE)
a<-table.row.end(a)
mylength <- length(r$acf)
myhalf <- floor((mylength-1)/2)
for (i in 1:mylength) {
a<-table.row.start(a)
a<-table.element(a,i-myhalf-1,header=TRUE)
a<-table.element(a,r$acf[i])
a<-table.row.end(a)
}
a<-table.end(a)
table.save(a,file='mytable.tab')