Free Statistics

of Irreproducible Research!

Author's title

Author*Unverified author*
R Software Modulerwasp_autocorrelation.wasp
Title produced by software(Partial) Autocorrelation Function
Date of computationTue, 23 Dec 2008 13:24:31 -0700
Cite this page as followsStatistical Computations at FreeStatistics.org, Office for Research Development and Education, URL https://freestatistics.org/blog/index.php?v=date/2008/Dec/23/t12300639568mir2bgjyps4vwe.htm/, Retrieved Fri, 17 May 2024 03:41:20 +0000
Statistical Computations at FreeStatistics.org, Office for Research Development and Education, URL https://freestatistics.org/blog/index.php?pk=36407, Retrieved Fri, 17 May 2024 03:41:20 +0000
QR Codes:

Original text written by user:
IsPrivate?No (this computation is public)
User-defined keywords
Estimated Impact118
Family? (F = Feedback message, R = changed R code, M = changed R Module, P = changed Parameters, D = changed Data)
-       [(Partial) Autocorrelation Function] [(P)ACF Vrouwen (D=1)] [2008-12-23 20:24:31] [f0e1dc59aca2fa8d78080b39899f316a] [Current]
Feedback Forum

Post a new message
Dataseries X:
54327
53476
52258
50156
47925
45844
47605
63617
67028
65845
60106
55317
53188
51010
49364
47616
45429
43480
44964
61008
64530
62960
57529
52954
51374
49211
47980
45575
44431
43596
45544
60109
63695
60819
54709
49357
46913
46728
44576
41988
40880
37860
38532
52713
56139
50939
46352
42169
42025
41713
40123
37737
36928
33812
36122
48823
51520
47090
42683
39947


Summary of computational transaction
Raw Inputview raw input (R code)
Raw Outputview raw output of R engine
Computing time1 seconds
R Server'George Udny Yule' @ 72.249.76.132

\begin{tabular}{lllllllll}
\hline
Summary of computational transaction \tabularnewline
Raw Input & view raw input (R code)  \tabularnewline
Raw Output & view raw output of R engine  \tabularnewline
Computing time & 1 seconds \tabularnewline
R Server & 'George Udny Yule' @ 72.249.76.132 \tabularnewline
\hline
\end{tabular}
%Source: https://freestatistics.org/blog/index.php?pk=36407&T=0

[TABLE]
[ROW][C]Summary of computational transaction[/C][/ROW]
[ROW][C]Raw Input[/C][C]view raw input (R code) [/C][/ROW]
[ROW][C]Raw Output[/C][C]view raw output of R engine [/C][/ROW]
[ROW][C]Computing time[/C][C]1 seconds[/C][/ROW]
[ROW][C]R Server[/C][C]'George Udny Yule' @ 72.249.76.132[/C][/ROW]
[/TABLE]
Source: https://freestatistics.org/blog/index.php?pk=36407&T=0

Globally Unique Identifier (entire table): ba.freestatistics.org/blog/index.php?pk=36407&T=0

As an alternative you can also use a QR Code:  

The GUIDs for individual cells are displayed in the table below:

Summary of computational transaction
Raw Inputview raw input (R code)
Raw Outputview raw output of R engine
Computing time1 seconds
R Server'George Udny Yule' @ 72.249.76.132


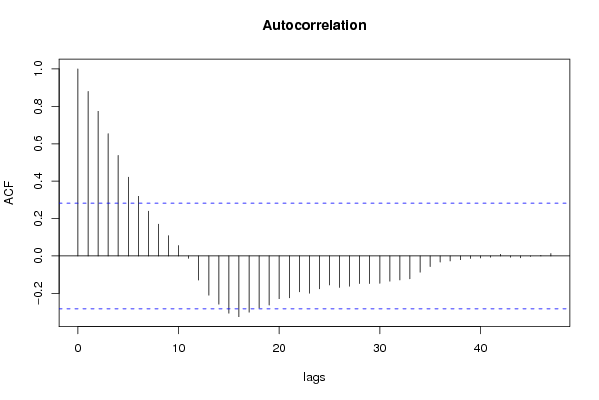
Autocorrelation Function
Time lag kACF(k)T-STATP-value
10.8796276.09420
20.7735165.35911e-06
30.653954.53072e-05
40.5376393.72490.000257
50.4214992.92020.002657
60.3189052.20940.015974
70.2396121.66010.051709
80.1700781.17830.122236
90.1087160.75320.227503
100.0553780.38370.351457
11-0.012854-0.08910.464705
12-0.12888-0.89290.188182
13-0.209954-1.45460.076144
14-0.258018-1.78760.040078
15-0.305703-2.1180.019691
16-0.324467-2.2480.014604
17-0.300891-2.08460.021223
18-0.278551-1.92990.029773
19-0.262366-1.81770.037675
20-0.228187-1.58090.060232
21-0.223977-1.55180.063645
22-0.191984-1.33010.094885
23-0.199258-1.38050.086914
24-0.175716-1.21740.114703
25-0.155098-1.07460.143974
26-0.168352-1.16640.124613
27-0.161637-1.11990.134175
28-0.147638-1.02290.15575
29-0.147303-1.02050.156293
30-0.1462-1.01290.158093
31-0.134885-0.93450.177359
32-0.128286-0.88880.189274
33-0.122324-0.84750.200464
34-0.086878-0.60190.275034
35-0.056892-0.39420.347606
36-0.032315-0.22390.411899
37-0.026474-0.18340.427621
38-0.019637-0.13610.446175
39-0.013031-0.09030.464219
40-0.010765-0.07460.47043
41-0.006309-0.04370.482658
420.0091080.06310.474973
43-0.006742-0.04670.481468
44-0.009825-0.06810.473005
45-0.002337-0.01620.493575
460.0029540.02050.491877
470.012750.08830.46499
48NANANA
49NANANA
50NANANA
51NANANA
52NANANA
53NANANA
54NANANA
55NANANA
56NANANA
57NANANA
58NANANA
59NANANA
60NANANA

\begin{tabular}{lllllllll}
\hline
Autocorrelation Function \tabularnewline
Time lag k & ACF(k) & T-STAT & P-value \tabularnewline
1 & 0.879627 & 6.0942 & 0 \tabularnewline
2 & 0.773516 & 5.3591 & 1e-06 \tabularnewline
3 & 0.65395 & 4.5307 & 2e-05 \tabularnewline
4 & 0.537639 & 3.7249 & 0.000257 \tabularnewline
5 & 0.421499 & 2.9202 & 0.002657 \tabularnewline
6 & 0.318905 & 2.2094 & 0.015974 \tabularnewline
7 & 0.239612 & 1.6601 & 0.051709 \tabularnewline
8 & 0.170078 & 1.1783 & 0.122236 \tabularnewline
9 & 0.108716 & 0.7532 & 0.227503 \tabularnewline
10 & 0.055378 & 0.3837 & 0.351457 \tabularnewline
11 & -0.012854 & -0.0891 & 0.464705 \tabularnewline
12 & -0.12888 & -0.8929 & 0.188182 \tabularnewline
13 & -0.209954 & -1.4546 & 0.076144 \tabularnewline
14 & -0.258018 & -1.7876 & 0.040078 \tabularnewline
15 & -0.305703 & -2.118 & 0.019691 \tabularnewline
16 & -0.324467 & -2.248 & 0.014604 \tabularnewline
17 & -0.300891 & -2.0846 & 0.021223 \tabularnewline
18 & -0.278551 & -1.9299 & 0.029773 \tabularnewline
19 & -0.262366 & -1.8177 & 0.037675 \tabularnewline
20 & -0.228187 & -1.5809 & 0.060232 \tabularnewline
21 & -0.223977 & -1.5518 & 0.063645 \tabularnewline
22 & -0.191984 & -1.3301 & 0.094885 \tabularnewline
23 & -0.199258 & -1.3805 & 0.086914 \tabularnewline
24 & -0.175716 & -1.2174 & 0.114703 \tabularnewline
25 & -0.155098 & -1.0746 & 0.143974 \tabularnewline
26 & -0.168352 & -1.1664 & 0.124613 \tabularnewline
27 & -0.161637 & -1.1199 & 0.134175 \tabularnewline
28 & -0.147638 & -1.0229 & 0.15575 \tabularnewline
29 & -0.147303 & -1.0205 & 0.156293 \tabularnewline
30 & -0.1462 & -1.0129 & 0.158093 \tabularnewline
31 & -0.134885 & -0.9345 & 0.177359 \tabularnewline
32 & -0.128286 & -0.8888 & 0.189274 \tabularnewline
33 & -0.122324 & -0.8475 & 0.200464 \tabularnewline
34 & -0.086878 & -0.6019 & 0.275034 \tabularnewline
35 & -0.056892 & -0.3942 & 0.347606 \tabularnewline
36 & -0.032315 & -0.2239 & 0.411899 \tabularnewline
37 & -0.026474 & -0.1834 & 0.427621 \tabularnewline
38 & -0.019637 & -0.1361 & 0.446175 \tabularnewline
39 & -0.013031 & -0.0903 & 0.464219 \tabularnewline
40 & -0.010765 & -0.0746 & 0.47043 \tabularnewline
41 & -0.006309 & -0.0437 & 0.482658 \tabularnewline
42 & 0.009108 & 0.0631 & 0.474973 \tabularnewline
43 & -0.006742 & -0.0467 & 0.481468 \tabularnewline
44 & -0.009825 & -0.0681 & 0.473005 \tabularnewline
45 & -0.002337 & -0.0162 & 0.493575 \tabularnewline
46 & 0.002954 & 0.0205 & 0.491877 \tabularnewline
47 & 0.01275 & 0.0883 & 0.46499 \tabularnewline
48 & NA & NA & NA \tabularnewline
49 & NA & NA & NA \tabularnewline
50 & NA & NA & NA \tabularnewline
51 & NA & NA & NA \tabularnewline
52 & NA & NA & NA \tabularnewline
53 & NA & NA & NA \tabularnewline
54 & NA & NA & NA \tabularnewline
55 & NA & NA & NA \tabularnewline
56 & NA & NA & NA \tabularnewline
57 & NA & NA & NA \tabularnewline
58 & NA & NA & NA \tabularnewline
59 & NA & NA & NA \tabularnewline
60 & NA & NA & NA \tabularnewline
\hline
\end{tabular}
%Source: https://freestatistics.org/blog/index.php?pk=36407&T=1

[TABLE]
[ROW][C]Autocorrelation Function[/C][/ROW]
[ROW][C]Time lag k[/C][C]ACF(k)[/C][C]T-STAT[/C][C]P-value[/C][/ROW]
[ROW][C]1[/C][C]0.879627[/C][C]6.0942[/C][C]0[/C][/ROW]
[ROW][C]2[/C][C]0.773516[/C][C]5.3591[/C][C]1e-06[/C][/ROW]
[ROW][C]3[/C][C]0.65395[/C][C]4.5307[/C][C]2e-05[/C][/ROW]
[ROW][C]4[/C][C]0.537639[/C][C]3.7249[/C][C]0.000257[/C][/ROW]
[ROW][C]5[/C][C]0.421499[/C][C]2.9202[/C][C]0.002657[/C][/ROW]
[ROW][C]6[/C][C]0.318905[/C][C]2.2094[/C][C]0.015974[/C][/ROW]
[ROW][C]7[/C][C]0.239612[/C][C]1.6601[/C][C]0.051709[/C][/ROW]
[ROW][C]8[/C][C]0.170078[/C][C]1.1783[/C][C]0.122236[/C][/ROW]
[ROW][C]9[/C][C]0.108716[/C][C]0.7532[/C][C]0.227503[/C][/ROW]
[ROW][C]10[/C][C]0.055378[/C][C]0.3837[/C][C]0.351457[/C][/ROW]
[ROW][C]11[/C][C]-0.012854[/C][C]-0.0891[/C][C]0.464705[/C][/ROW]
[ROW][C]12[/C][C]-0.12888[/C][C]-0.8929[/C][C]0.188182[/C][/ROW]
[ROW][C]13[/C][C]-0.209954[/C][C]-1.4546[/C][C]0.076144[/C][/ROW]
[ROW][C]14[/C][C]-0.258018[/C][C]-1.7876[/C][C]0.040078[/C][/ROW]
[ROW][C]15[/C][C]-0.305703[/C][C]-2.118[/C][C]0.019691[/C][/ROW]
[ROW][C]16[/C][C]-0.324467[/C][C]-2.248[/C][C]0.014604[/C][/ROW]
[ROW][C]17[/C][C]-0.300891[/C][C]-2.0846[/C][C]0.021223[/C][/ROW]
[ROW][C]18[/C][C]-0.278551[/C][C]-1.9299[/C][C]0.029773[/C][/ROW]
[ROW][C]19[/C][C]-0.262366[/C][C]-1.8177[/C][C]0.037675[/C][/ROW]
[ROW][C]20[/C][C]-0.228187[/C][C]-1.5809[/C][C]0.060232[/C][/ROW]
[ROW][C]21[/C][C]-0.223977[/C][C]-1.5518[/C][C]0.063645[/C][/ROW]
[ROW][C]22[/C][C]-0.191984[/C][C]-1.3301[/C][C]0.094885[/C][/ROW]
[ROW][C]23[/C][C]-0.199258[/C][C]-1.3805[/C][C]0.086914[/C][/ROW]
[ROW][C]24[/C][C]-0.175716[/C][C]-1.2174[/C][C]0.114703[/C][/ROW]
[ROW][C]25[/C][C]-0.155098[/C][C]-1.0746[/C][C]0.143974[/C][/ROW]
[ROW][C]26[/C][C]-0.168352[/C][C]-1.1664[/C][C]0.124613[/C][/ROW]
[ROW][C]27[/C][C]-0.161637[/C][C]-1.1199[/C][C]0.134175[/C][/ROW]
[ROW][C]28[/C][C]-0.147638[/C][C]-1.0229[/C][C]0.15575[/C][/ROW]
[ROW][C]29[/C][C]-0.147303[/C][C]-1.0205[/C][C]0.156293[/C][/ROW]
[ROW][C]30[/C][C]-0.1462[/C][C]-1.0129[/C][C]0.158093[/C][/ROW]
[ROW][C]31[/C][C]-0.134885[/C][C]-0.9345[/C][C]0.177359[/C][/ROW]
[ROW][C]32[/C][C]-0.128286[/C][C]-0.8888[/C][C]0.189274[/C][/ROW]
[ROW][C]33[/C][C]-0.122324[/C][C]-0.8475[/C][C]0.200464[/C][/ROW]
[ROW][C]34[/C][C]-0.086878[/C][C]-0.6019[/C][C]0.275034[/C][/ROW]
[ROW][C]35[/C][C]-0.056892[/C][C]-0.3942[/C][C]0.347606[/C][/ROW]
[ROW][C]36[/C][C]-0.032315[/C][C]-0.2239[/C][C]0.411899[/C][/ROW]
[ROW][C]37[/C][C]-0.026474[/C][C]-0.1834[/C][C]0.427621[/C][/ROW]
[ROW][C]38[/C][C]-0.019637[/C][C]-0.1361[/C][C]0.446175[/C][/ROW]
[ROW][C]39[/C][C]-0.013031[/C][C]-0.0903[/C][C]0.464219[/C][/ROW]
[ROW][C]40[/C][C]-0.010765[/C][C]-0.0746[/C][C]0.47043[/C][/ROW]
[ROW][C]41[/C][C]-0.006309[/C][C]-0.0437[/C][C]0.482658[/C][/ROW]
[ROW][C]42[/C][C]0.009108[/C][C]0.0631[/C][C]0.474973[/C][/ROW]
[ROW][C]43[/C][C]-0.006742[/C][C]-0.0467[/C][C]0.481468[/C][/ROW]
[ROW][C]44[/C][C]-0.009825[/C][C]-0.0681[/C][C]0.473005[/C][/ROW]
[ROW][C]45[/C][C]-0.002337[/C][C]-0.0162[/C][C]0.493575[/C][/ROW]
[ROW][C]46[/C][C]0.002954[/C][C]0.0205[/C][C]0.491877[/C][/ROW]
[ROW][C]47[/C][C]0.01275[/C][C]0.0883[/C][C]0.46499[/C][/ROW]
[ROW][C]48[/C][C]NA[/C][C]NA[/C][C]NA[/C][/ROW]
[ROW][C]49[/C][C]NA[/C][C]NA[/C][C]NA[/C][/ROW]
[ROW][C]50[/C][C]NA[/C][C]NA[/C][C]NA[/C][/ROW]
[ROW][C]51[/C][C]NA[/C][C]NA[/C][C]NA[/C][/ROW]
[ROW][C]52[/C][C]NA[/C][C]NA[/C][C]NA[/C][/ROW]
[ROW][C]53[/C][C]NA[/C][C]NA[/C][C]NA[/C][/ROW]
[ROW][C]54[/C][C]NA[/C][C]NA[/C][C]NA[/C][/ROW]
[ROW][C]55[/C][C]NA[/C][C]NA[/C][C]NA[/C][/ROW]
[ROW][C]56[/C][C]NA[/C][C]NA[/C][C]NA[/C][/ROW]
[ROW][C]57[/C][C]NA[/C][C]NA[/C][C]NA[/C][/ROW]
[ROW][C]58[/C][C]NA[/C][C]NA[/C][C]NA[/C][/ROW]
[ROW][C]59[/C][C]NA[/C][C]NA[/C][C]NA[/C][/ROW]
[ROW][C]60[/C][C]NA[/C][C]NA[/C][C]NA[/C][/ROW]
[/TABLE]
Source: https://freestatistics.org/blog/index.php?pk=36407&T=1

Globally Unique Identifier (entire table): ba.freestatistics.org/blog/index.php?pk=36407&T=1

As an alternative you can also use a QR Code:  

The GUIDs for individual cells are displayed in the table below:

Autocorrelation Function
Time lag kACF(k)T-STATP-value
10.8796276.09420
20.7735165.35911e-06
30.653954.53072e-05
40.5376393.72490.000257
50.4214992.92020.002657
60.3189052.20940.015974
70.2396121.66010.051709
80.1700781.17830.122236
90.1087160.75320.227503
100.0553780.38370.351457
11-0.012854-0.08910.464705
12-0.12888-0.89290.188182
13-0.209954-1.45460.076144
14-0.258018-1.78760.040078
15-0.305703-2.1180.019691
16-0.324467-2.2480.014604
17-0.300891-2.08460.021223
18-0.278551-1.92990.029773
19-0.262366-1.81770.037675
20-0.228187-1.58090.060232
21-0.223977-1.55180.063645
22-0.191984-1.33010.094885
23-0.199258-1.38050.086914
24-0.175716-1.21740.114703
25-0.155098-1.07460.143974
26-0.168352-1.16640.124613
27-0.161637-1.11990.134175
28-0.147638-1.02290.15575
29-0.147303-1.02050.156293
30-0.1462-1.01290.158093
31-0.134885-0.93450.177359
32-0.128286-0.88880.189274
33-0.122324-0.84750.200464
34-0.086878-0.60190.275034
35-0.056892-0.39420.347606
36-0.032315-0.22390.411899
37-0.026474-0.18340.427621
38-0.019637-0.13610.446175
39-0.013031-0.09030.464219
40-0.010765-0.07460.47043
41-0.006309-0.04370.482658
420.0091080.06310.474973
43-0.006742-0.04670.481468
44-0.009825-0.06810.473005
45-0.002337-0.01620.493575
460.0029540.02050.491877
470.012750.08830.46499
48NANANA
49NANANA
50NANANA
51NANANA
52NANANA
53NANANA
54NANANA
55NANANA
56NANANA
57NANANA
58NANANA
59NANANA
60NANANA


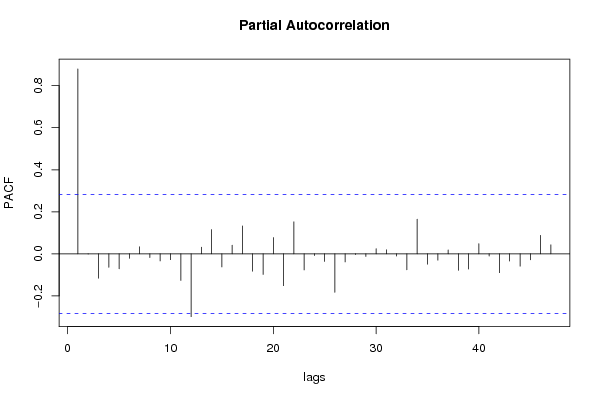
Partial Autocorrelation Function
Time lag kPACF(k)T-STATP-value
10.8796276.09420
2-0.001006-0.0070.497233
3-0.11604-0.80390.212695
4-0.063974-0.44320.329798
5-0.070943-0.49150.312654
6-0.021208-0.14690.4419
70.0332830.23060.409306
8-0.017679-0.12250.451513
9-0.033564-0.23250.408555
10-0.027974-0.19380.42357
11-0.126749-0.87810.19212
12-0.298761-2.06990.021934
130.0316110.2190.413787
140.1153370.79910.214091
15-0.062267-0.43140.334054
160.0409510.28370.388925
170.1326420.9190.181353
18-0.082612-0.57240.284877
19-0.098206-0.68040.249763
200.0777520.53870.296298
21-0.151202-1.04760.150045
220.1522511.05480.148393
23-0.076316-0.52870.299714
24-0.008084-0.0560.477784
25-0.036268-0.25130.401339
26-0.18275-1.26610.105788
27-0.038772-0.26860.394686
28-0.003394-0.02350.490667
29-0.012335-0.08550.466127
300.0244470.16940.433107
310.01920.1330.447366
32-0.010799-0.07480.470335
33-0.07616-0.52760.300087
340.1650771.14370.129213
35-0.049082-0.340.367652
36-0.029952-0.20750.418243
370.0185040.12820.449264
38-0.078077-0.54090.295529
39-0.072548-0.50260.308763
400.0485880.33660.368932
41-0.010409-0.07210.471404
42-0.089773-0.6220.268453
43-0.03404-0.23580.40728
44-0.058657-0.40640.343131
45-0.028594-0.19810.421899
460.0879220.60910.272651
470.042850.29690.383923
48NANANA
49NANANA
50NANANA
51NANANA
52NANANA
53NANANA
54NANANA
55NANANA
56NANANA
57NANANA
58NANANA
59NANANA
60NANANA

\begin{tabular}{lllllllll}
\hline
Partial Autocorrelation Function \tabularnewline
Time lag k & PACF(k) & T-STAT & P-value \tabularnewline
1 & 0.879627 & 6.0942 & 0 \tabularnewline
2 & -0.001006 & -0.007 & 0.497233 \tabularnewline
3 & -0.11604 & -0.8039 & 0.212695 \tabularnewline
4 & -0.063974 & -0.4432 & 0.329798 \tabularnewline
5 & -0.070943 & -0.4915 & 0.312654 \tabularnewline
6 & -0.021208 & -0.1469 & 0.4419 \tabularnewline
7 & 0.033283 & 0.2306 & 0.409306 \tabularnewline
8 & -0.017679 & -0.1225 & 0.451513 \tabularnewline
9 & -0.033564 & -0.2325 & 0.408555 \tabularnewline
10 & -0.027974 & -0.1938 & 0.42357 \tabularnewline
11 & -0.126749 & -0.8781 & 0.19212 \tabularnewline
12 & -0.298761 & -2.0699 & 0.021934 \tabularnewline
13 & 0.031611 & 0.219 & 0.413787 \tabularnewline
14 & 0.115337 & 0.7991 & 0.214091 \tabularnewline
15 & -0.062267 & -0.4314 & 0.334054 \tabularnewline
16 & 0.040951 & 0.2837 & 0.388925 \tabularnewline
17 & 0.132642 & 0.919 & 0.181353 \tabularnewline
18 & -0.082612 & -0.5724 & 0.284877 \tabularnewline
19 & -0.098206 & -0.6804 & 0.249763 \tabularnewline
20 & 0.077752 & 0.5387 & 0.296298 \tabularnewline
21 & -0.151202 & -1.0476 & 0.150045 \tabularnewline
22 & 0.152251 & 1.0548 & 0.148393 \tabularnewline
23 & -0.076316 & -0.5287 & 0.299714 \tabularnewline
24 & -0.008084 & -0.056 & 0.477784 \tabularnewline
25 & -0.036268 & -0.2513 & 0.401339 \tabularnewline
26 & -0.18275 & -1.2661 & 0.105788 \tabularnewline
27 & -0.038772 & -0.2686 & 0.394686 \tabularnewline
28 & -0.003394 & -0.0235 & 0.490667 \tabularnewline
29 & -0.012335 & -0.0855 & 0.466127 \tabularnewline
30 & 0.024447 & 0.1694 & 0.433107 \tabularnewline
31 & 0.0192 & 0.133 & 0.447366 \tabularnewline
32 & -0.010799 & -0.0748 & 0.470335 \tabularnewline
33 & -0.07616 & -0.5276 & 0.300087 \tabularnewline
34 & 0.165077 & 1.1437 & 0.129213 \tabularnewline
35 & -0.049082 & -0.34 & 0.367652 \tabularnewline
36 & -0.029952 & -0.2075 & 0.418243 \tabularnewline
37 & 0.018504 & 0.1282 & 0.449264 \tabularnewline
38 & -0.078077 & -0.5409 & 0.295529 \tabularnewline
39 & -0.072548 & -0.5026 & 0.308763 \tabularnewline
40 & 0.048588 & 0.3366 & 0.368932 \tabularnewline
41 & -0.010409 & -0.0721 & 0.471404 \tabularnewline
42 & -0.089773 & -0.622 & 0.268453 \tabularnewline
43 & -0.03404 & -0.2358 & 0.40728 \tabularnewline
44 & -0.058657 & -0.4064 & 0.343131 \tabularnewline
45 & -0.028594 & -0.1981 & 0.421899 \tabularnewline
46 & 0.087922 & 0.6091 & 0.272651 \tabularnewline
47 & 0.04285 & 0.2969 & 0.383923 \tabularnewline
48 & NA & NA & NA \tabularnewline
49 & NA & NA & NA \tabularnewline
50 & NA & NA & NA \tabularnewline
51 & NA & NA & NA \tabularnewline
52 & NA & NA & NA \tabularnewline
53 & NA & NA & NA \tabularnewline
54 & NA & NA & NA \tabularnewline
55 & NA & NA & NA \tabularnewline
56 & NA & NA & NA \tabularnewline
57 & NA & NA & NA \tabularnewline
58 & NA & NA & NA \tabularnewline
59 & NA & NA & NA \tabularnewline
60 & NA & NA & NA \tabularnewline
\hline
\end{tabular}
%Source: https://freestatistics.org/blog/index.php?pk=36407&T=2

[TABLE]
[ROW][C]Partial Autocorrelation Function[/C][/ROW]
[ROW][C]Time lag k[/C][C]PACF(k)[/C][C]T-STAT[/C][C]P-value[/C][/ROW]
[ROW][C]1[/C][C]0.879627[/C][C]6.0942[/C][C]0[/C][/ROW]
[ROW][C]2[/C][C]-0.001006[/C][C]-0.007[/C][C]0.497233[/C][/ROW]
[ROW][C]3[/C][C]-0.11604[/C][C]-0.8039[/C][C]0.212695[/C][/ROW]
[ROW][C]4[/C][C]-0.063974[/C][C]-0.4432[/C][C]0.329798[/C][/ROW]
[ROW][C]5[/C][C]-0.070943[/C][C]-0.4915[/C][C]0.312654[/C][/ROW]
[ROW][C]6[/C][C]-0.021208[/C][C]-0.1469[/C][C]0.4419[/C][/ROW]
[ROW][C]7[/C][C]0.033283[/C][C]0.2306[/C][C]0.409306[/C][/ROW]
[ROW][C]8[/C][C]-0.017679[/C][C]-0.1225[/C][C]0.451513[/C][/ROW]
[ROW][C]9[/C][C]-0.033564[/C][C]-0.2325[/C][C]0.408555[/C][/ROW]
[ROW][C]10[/C][C]-0.027974[/C][C]-0.1938[/C][C]0.42357[/C][/ROW]
[ROW][C]11[/C][C]-0.126749[/C][C]-0.8781[/C][C]0.19212[/C][/ROW]
[ROW][C]12[/C][C]-0.298761[/C][C]-2.0699[/C][C]0.021934[/C][/ROW]
[ROW][C]13[/C][C]0.031611[/C][C]0.219[/C][C]0.413787[/C][/ROW]
[ROW][C]14[/C][C]0.115337[/C][C]0.7991[/C][C]0.214091[/C][/ROW]
[ROW][C]15[/C][C]-0.062267[/C][C]-0.4314[/C][C]0.334054[/C][/ROW]
[ROW][C]16[/C][C]0.040951[/C][C]0.2837[/C][C]0.388925[/C][/ROW]
[ROW][C]17[/C][C]0.132642[/C][C]0.919[/C][C]0.181353[/C][/ROW]
[ROW][C]18[/C][C]-0.082612[/C][C]-0.5724[/C][C]0.284877[/C][/ROW]
[ROW][C]19[/C][C]-0.098206[/C][C]-0.6804[/C][C]0.249763[/C][/ROW]
[ROW][C]20[/C][C]0.077752[/C][C]0.5387[/C][C]0.296298[/C][/ROW]
[ROW][C]21[/C][C]-0.151202[/C][C]-1.0476[/C][C]0.150045[/C][/ROW]
[ROW][C]22[/C][C]0.152251[/C][C]1.0548[/C][C]0.148393[/C][/ROW]
[ROW][C]23[/C][C]-0.076316[/C][C]-0.5287[/C][C]0.299714[/C][/ROW]
[ROW][C]24[/C][C]-0.008084[/C][C]-0.056[/C][C]0.477784[/C][/ROW]
[ROW][C]25[/C][C]-0.036268[/C][C]-0.2513[/C][C]0.401339[/C][/ROW]
[ROW][C]26[/C][C]-0.18275[/C][C]-1.2661[/C][C]0.105788[/C][/ROW]
[ROW][C]27[/C][C]-0.038772[/C][C]-0.2686[/C][C]0.394686[/C][/ROW]
[ROW][C]28[/C][C]-0.003394[/C][C]-0.0235[/C][C]0.490667[/C][/ROW]
[ROW][C]29[/C][C]-0.012335[/C][C]-0.0855[/C][C]0.466127[/C][/ROW]
[ROW][C]30[/C][C]0.024447[/C][C]0.1694[/C][C]0.433107[/C][/ROW]
[ROW][C]31[/C][C]0.0192[/C][C]0.133[/C][C]0.447366[/C][/ROW]
[ROW][C]32[/C][C]-0.010799[/C][C]-0.0748[/C][C]0.470335[/C][/ROW]
[ROW][C]33[/C][C]-0.07616[/C][C]-0.5276[/C][C]0.300087[/C][/ROW]
[ROW][C]34[/C][C]0.165077[/C][C]1.1437[/C][C]0.129213[/C][/ROW]
[ROW][C]35[/C][C]-0.049082[/C][C]-0.34[/C][C]0.367652[/C][/ROW]
[ROW][C]36[/C][C]-0.029952[/C][C]-0.2075[/C][C]0.418243[/C][/ROW]
[ROW][C]37[/C][C]0.018504[/C][C]0.1282[/C][C]0.449264[/C][/ROW]
[ROW][C]38[/C][C]-0.078077[/C][C]-0.5409[/C][C]0.295529[/C][/ROW]
[ROW][C]39[/C][C]-0.072548[/C][C]-0.5026[/C][C]0.308763[/C][/ROW]
[ROW][C]40[/C][C]0.048588[/C][C]0.3366[/C][C]0.368932[/C][/ROW]
[ROW][C]41[/C][C]-0.010409[/C][C]-0.0721[/C][C]0.471404[/C][/ROW]
[ROW][C]42[/C][C]-0.089773[/C][C]-0.622[/C][C]0.268453[/C][/ROW]
[ROW][C]43[/C][C]-0.03404[/C][C]-0.2358[/C][C]0.40728[/C][/ROW]
[ROW][C]44[/C][C]-0.058657[/C][C]-0.4064[/C][C]0.343131[/C][/ROW]
[ROW][C]45[/C][C]-0.028594[/C][C]-0.1981[/C][C]0.421899[/C][/ROW]
[ROW][C]46[/C][C]0.087922[/C][C]0.6091[/C][C]0.272651[/C][/ROW]
[ROW][C]47[/C][C]0.04285[/C][C]0.2969[/C][C]0.383923[/C][/ROW]
[ROW][C]48[/C][C]NA[/C][C]NA[/C][C]NA[/C][/ROW]
[ROW][C]49[/C][C]NA[/C][C]NA[/C][C]NA[/C][/ROW]
[ROW][C]50[/C][C]NA[/C][C]NA[/C][C]NA[/C][/ROW]
[ROW][C]51[/C][C]NA[/C][C]NA[/C][C]NA[/C][/ROW]
[ROW][C]52[/C][C]NA[/C][C]NA[/C][C]NA[/C][/ROW]
[ROW][C]53[/C][C]NA[/C][C]NA[/C][C]NA[/C][/ROW]
[ROW][C]54[/C][C]NA[/C][C]NA[/C][C]NA[/C][/ROW]
[ROW][C]55[/C][C]NA[/C][C]NA[/C][C]NA[/C][/ROW]
[ROW][C]56[/C][C]NA[/C][C]NA[/C][C]NA[/C][/ROW]
[ROW][C]57[/C][C]NA[/C][C]NA[/C][C]NA[/C][/ROW]
[ROW][C]58[/C][C]NA[/C][C]NA[/C][C]NA[/C][/ROW]
[ROW][C]59[/C][C]NA[/C][C]NA[/C][C]NA[/C][/ROW]
[ROW][C]60[/C][C]NA[/C][C]NA[/C][C]NA[/C][/ROW]
[/TABLE]
Source: https://freestatistics.org/blog/index.php?pk=36407&T=2

Globally Unique Identifier (entire table): ba.freestatistics.org/blog/index.php?pk=36407&T=2

As an alternative you can also use a QR Code:  

The GUIDs for individual cells are displayed in the table below:

Partial Autocorrelation Function
Time lag kPACF(k)T-STATP-value
10.8796276.09420
2-0.001006-0.0070.497233
3-0.11604-0.80390.212695
4-0.063974-0.44320.329798
5-0.070943-0.49150.312654
6-0.021208-0.14690.4419
70.0332830.23060.409306
8-0.017679-0.12250.451513
9-0.033564-0.23250.408555
10-0.027974-0.19380.42357
11-0.126749-0.87810.19212
12-0.298761-2.06990.021934
130.0316110.2190.413787
140.1153370.79910.214091
15-0.062267-0.43140.334054
160.0409510.28370.388925
170.1326420.9190.181353
18-0.082612-0.57240.284877
19-0.098206-0.68040.249763
200.0777520.53870.296298
21-0.151202-1.04760.150045
220.1522511.05480.148393
23-0.076316-0.52870.299714
24-0.008084-0.0560.477784
25-0.036268-0.25130.401339
26-0.18275-1.26610.105788
27-0.038772-0.26860.394686
28-0.003394-0.02350.490667
29-0.012335-0.08550.466127
300.0244470.16940.433107
310.01920.1330.447366
32-0.010799-0.07480.470335
33-0.07616-0.52760.300087
340.1650771.14370.129213
35-0.049082-0.340.367652
36-0.029952-0.20750.418243
370.0185040.12820.449264
38-0.078077-0.54090.295529
39-0.072548-0.50260.308763
400.0485880.33660.368932
41-0.010409-0.07210.471404
42-0.089773-0.6220.268453
43-0.03404-0.23580.40728
44-0.058657-0.40640.343131
45-0.028594-0.19810.421899
460.0879220.60910.272651
470.042850.29690.383923
48NANANA
49NANANA
50NANANA
51NANANA
52NANANA
53NANANA
54NANANA
55NANANA
56NANANA
57NANANA
58NANANA
59NANANA
60NANANA


Parameters (Session):
par1 = 60 ; par2 = 1 ; par3 = 0 ; par4 = 1 ; par5 = 12 ;
Parameters (R input):
par1 = 60 ; par2 = 1 ; par3 = 0 ; par4 = 1 ; par5 = 12 ;
R code (references can be found in the software module):
if (par1 == 'Default') {
par1 = 10*log10(length(x))
} else {
par1 <- as.numeric(par1)
}
par2 <- as.numeric(par2)
par3 <- as.numeric(par3)
par4 <- as.numeric(par4)
par5 <- as.numeric(par5)
if (par2 == 0) {
x <- log(x)
} else {
x <- (x ^ par2 - 1) / par2
}
if (par3 > 0) x <- diff(x,lag=1,difference=par3)
if (par4 > 0) x <- diff(x,lag=par5,difference=par4)
bitmap(file='pic1.png')
racf <- acf(x,par1,main='Autocorrelation',xlab='lags',ylab='ACF')
dev.off()
bitmap(file='pic2.png')
rpacf <- pacf(x,par1,main='Partial Autocorrelation',xlab='lags',ylab='PACF')
dev.off()
(myacf <- c(racf$acf))
(mypacf <- c(rpacf$acf))
lengthx <- length(x)
sqrtn <- sqrt(lengthx)
load(file='createtable')
a<-table.start()
a<-table.row.start(a)
a<-table.element(a,'Autocorrelation Function',4,TRUE)
a<-table.row.end(a)
a<-table.row.start(a)
a<-table.element(a,'Time lag k',header=TRUE)
a<-table.element(a,hyperlink('basics.htm','ACF(k)','click here for more information about the Autocorrelation Function'),header=TRUE)
a<-table.element(a,'T-STAT',header=TRUE)
a<-table.element(a,'P-value',header=TRUE)
a<-table.row.end(a)
for (i in 2:(par1+1)) {
a<-table.row.start(a)
a<-table.element(a,i-1,header=TRUE)
a<-table.element(a,round(myacf[i],6))
mytstat <- myacf[i]*sqrtn
a<-table.element(a,round(mytstat,4))
a<-table.element(a,round(1-pt(abs(mytstat),lengthx),6))
a<-table.row.end(a)
}
a<-table.end(a)
table.save(a,file='mytable.tab')
a<-table.start()
a<-table.row.start(a)
a<-table.element(a,'Partial Autocorrelation Function',4,TRUE)
a<-table.row.end(a)
a<-table.row.start(a)
a<-table.element(a,'Time lag k',header=TRUE)
a<-table.element(a,hyperlink('basics.htm','PACF(k)','click here for more information about the Partial Autocorrelation Function'),header=TRUE)
a<-table.element(a,'T-STAT',header=TRUE)
a<-table.element(a,'P-value',header=TRUE)
a<-table.row.end(a)
for (i in 1:par1) {
a<-table.row.start(a)
a<-table.element(a,i,header=TRUE)
a<-table.element(a,round(mypacf[i],6))
mytstat <- mypacf[i]*sqrtn
a<-table.element(a,round(mytstat,4))
a<-table.element(a,round(1-pt(abs(mytstat),lengthx),6))
a<-table.row.end(a)
}
a<-table.end(a)
table.save(a,file='mytable1.tab')