Free Statistics
of Irreproducible Research!
Description of Statistical Computation | |||||||||||||||||||||||||||||||||||||||||||||||||||
|---|---|---|---|---|---|---|---|---|---|---|---|---|---|---|---|---|---|---|---|---|---|---|---|---|---|---|---|---|---|---|---|---|---|---|---|---|---|---|---|---|---|---|---|---|---|---|---|---|---|---|---|
| Author's title | |||||||||||||||||||||||||||||||||||||||||||||||||||
| Author | *Unverified author* | ||||||||||||||||||||||||||||||||||||||||||||||||||
| R Software Module | rwasp_pairs.wasp | ||||||||||||||||||||||||||||||||||||||||||||||||||
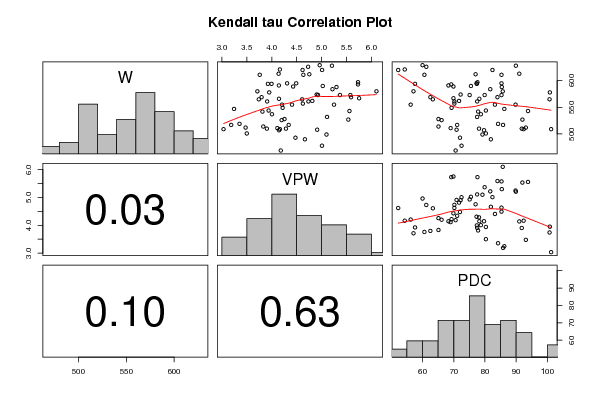
| Title produced by software | Kendall tau Correlation Matrix | ||||||||||||||||||||||||||||||||||||||||||||||||||
| Date of computation | Tue, 23 Dec 2008 05:22:38 -0700 | ||||||||||||||||||||||||||||||||||||||||||||||||||
| Cite this page as follows | Statistical Computations at FreeStatistics.org, Office for Research Development and Education, URL https://freestatistics.org/blog/index.php?v=date/2008/Dec/23/t1230035143saer4n6vium6i5x.htm/, Retrieved Fri, 17 May 2024 04:17:55 +0000 | ||||||||||||||||||||||||||||||||||||||||||||||||||
| Statistical Computations at FreeStatistics.org, Office for Research Development and Education, URL https://freestatistics.org/blog/index.php?pk=36279, Retrieved Fri, 17 May 2024 04:17:55 +0000 | |||||||||||||||||||||||||||||||||||||||||||||||||||
| QR Codes: | |||||||||||||||||||||||||||||||||||||||||||||||||||
|
| |||||||||||||||||||||||||||||||||||||||||||||||||||
| Original text written by user: | |||||||||||||||||||||||||||||||||||||||||||||||||||
| IsPrivate? | No (this computation is public) | ||||||||||||||||||||||||||||||||||||||||||||||||||
| User-defined keywords | |||||||||||||||||||||||||||||||||||||||||||||||||||
| Estimated Impact | 195 | ||||||||||||||||||||||||||||||||||||||||||||||||||
Tree of Dependent Computations | |||||||||||||||||||||||||||||||||||||||||||||||||||
| Family? (F = Feedback message, R = changed R code, M = changed R Module, P = changed Parameters, D = changed Data) | |||||||||||||||||||||||||||||||||||||||||||||||||||
| - [Kendall tau Correlation Matrix] [Paper25] [2008-12-23 12:22:38] [00d31cd882ff97e92e4adcac6f6719d5] [Current] - [Kendall tau Correlation Matrix] [Paper 25] [2008-12-24 12:25:59] [74be16979710d4c4e7c6647856088456] | |||||||||||||||||||||||||||||||||||||||||||||||||||
| Feedback Forum | |||||||||||||||||||||||||||||||||||||||||||||||||||
Post a new message | |||||||||||||||||||||||||||||||||||||||||||||||||||
Dataset | |||||||||||||||||||||||||||||||||||||||||||||||||||
| Dataseries X: | |||||||||||||||||||||||||||||||||||||||||||||||||||
528,00 4.256 65,1 478,00 5.008 72,5 469,00 4.181 70,6 490,00 4.666 81,9 493,00 4.476 72 508,00 4.912 70,9 517,00 4.340 71,1 514,00 3.830 65,1 510,00 4.285 78,1 527,00 5.537 92 542,00 3.813 77,8 565,00 4.610 63,3 555,00 4.207 56,2 499,00 5.099 79,2 511,00 4.112 69 526,00 4.199 66,1 532,00 5.110 77,5 549,00 4.218 69,3 561,00 4.736 70,2 557,00 4.624 70,2 566,00 4.145 78,2 588,00 5.299 85,4 620,00 5.011 82,4 626,00 4.730 61,2 620,00 4.619 52,2 573,00 5.578 85,3 573,00 5.369 79,9 574,00 4.902 72,2 580,00 6.102 85,7 590,00 5.024 75,5 593,00 5.731 69,2 597,00 5.732 77,6 595,00 4.491 85,3 612,00 4.755 77 628,00 5.208 89,9 629,00 4.962 60 621,00 4.163 54,3 569,00 5.592 84 567,00 5.754 69,9 573,00 4.929 75,1 584,00 5.219 81,7 589,00 4.429 69,9 591,00 4.143 68,3 595,00 4.308 77,3 594,00 3.996 77,4 611,00 4.634 85,3 613,00 4.138 91 611,00 3.759 60,6 594,00 3.922 57,6 543,00 5.560 93,8 537,00 4.004 78,7 544,00 3.937 80,3 555,00 5.250 89,8 561,00 3.908 77,5 562,00 4.814 71,7 555,00 4.407 83,2 547,00 3.243 86,2 565,00 3.740 100,7 578,00 3.949 100,8 580,00 3.711 57,1 569,00 3.796 62,5 507,00 4.145 79,7 501,00 3.499 80,3 509,00 4.164 92,4 510,00 3.902 91,8 517,00 3.186 85,8 519,00 3.353 84,2 512,00 3.475 93,1 509,00 3.032 101,2 | |||||||||||||||||||||||||||||||||||||||||||||||||||
Tables (Output of Computation) | |||||||||||||||||||||||||||||||||||||||||||||||||||
| |||||||||||||||||||||||||||||||||||||||||||||||||||
Figures (Output of Computation) | |||||||||||||||||||||||||||||||||||||||||||||||||||
Input Parameters & R Code | |||||||||||||||||||||||||||||||||||||||||||||||||||
| Parameters (Session): | |||||||||||||||||||||||||||||||||||||||||||||||||||
| Parameters (R input): | |||||||||||||||||||||||||||||||||||||||||||||||||||
| R code (references can be found in the software module): | |||||||||||||||||||||||||||||||||||||||||||||||||||
panel.tau <- function(x, y, digits=2, prefix='', cex.cor) | |||||||||||||||||||||||||||||||||||||||||||||||||||