Free Statistics

of Irreproducible Research!

Author's title

Author*The author of this computation has been verified*
R Software Modulerwasp_multipleregression.wasp
Title produced by softwareMultiple Regression
Date of computationMon, 22 Dec 2008 16:26:25 -0700
Cite this page as followsStatistical Computations at FreeStatistics.org, Office for Research Development and Education, URL https://freestatistics.org/blog/index.php?v=date/2008/Dec/23/t12299923384zsjre8j2jp5ysa.htm/, Retrieved Fri, 17 May 2024 07:00:59 +0000
Statistical Computations at FreeStatistics.org, Office for Research Development and Education, URL https://freestatistics.org/blog/index.php?pk=36258, Retrieved Fri, 17 May 2024 07:00:59 +0000
QR Codes:

Original text written by user:
IsPrivate?No (this computation is public)
User-defined keywords
Estimated Impact187
Family? (F = Feedback message, R = changed R code, M = changed R Module, P = changed Parameters, D = changed Data)
F       [Multiple Regression] [paper] [2008-12-22 23:26:25] [3452c99afdd85d4fde81272403cd85da] [Current]
Feedback Forum
2009-01-08 14:05:33 [Aurélie Van Impe] [reply
Je uitleg klopt niet helemaal. De maanden M1 tot M11 hebben niets te maken met de invoering van de dummy variabele. Deze zijn gewoon om te kunnen zien of er verschillen zijn in die maanden ten opzichte van de referentiemaand december. Het is wel correct dat er een negatief effect is op de werkloosheid. Dit is echter een vreemd verschijnsel. Je zou namelijk denken dat er meer werkloosheid is met de kredietcrisis. De bedrijven kunnen niet meer aan genoeg geld geraken en moeten mensen ontslaan. Hier blijkt dat er meer mensen werk vinden…

Je uitleg is ook onvolledig. Je had wat meer uitleg kunnen geven bij de tweede tabel. De SD staat voor hoeveel je kan afwijken naar boven of naar onder van je schatting. De T-stat staat voor significantie. Als de absolute waarde hiervan groter is dan 2, dan is het verschil tussen die maand en de maand december significant. Je ziet dat in het begin een groot aantal maanden niet significant verschilt in het aantal werklozen van de maand december. Maand 5, 6, 7 en 8 hebben wel een significant lager aantal werklozen dan in december. Zoals je ziet is ook de dalende trend in het algemeen niet echt significant. De daling na invoering van de dummy is echter wel significant. We kunnen ook naar de p-waarde kijken. Als deze groter is dan 0.05, dan is het verschil niet significant. Ik zou zeggen kijk naar de 1-zijdige test, omdat je ervan uitgaat dat er enkel meer werklozen kunnen zijn door de crisis, maar zoals je ondervonden hebt zijn er zelfs minder werklozen nu. Dus kijk toch maar naar de tweezijdige test dan. Je ziet dat een heleboel waarden boven de 0.05 komen, en dus niet significant zijn. De invoering van de kredietcrisis is echter wel significant van invloed.

Over de Adjusted R-Squared wil ik toch nog iets kwijt: je bent vergeten te kijken naar de p-waarde. Die zou kleiner moeten zijn dan 0.05 om zeker te zijn dat je je niet vergist. Hier is ze echter groter (7.93), waardoor het percentage dat je kan verklaren eigenlijk niet significant is. Het is niet betrouwbaar.

Je uitleg bij de actuals and interpolation is zeer kort. Je had nog kunnen zeggen dat de zwarte lijn staat voor de werkelijke waarden, en de bolletjes voor de voorspellingen. Je had nog kunnen zeggen welke de periode was waarin de crisis begon, en daaruit afleiden of er sindsdien een daling of een stijging van het aantal werklozen was, een niveauverschil. Je ziet ook dat in het begin van de tijdreeks de voorspellingen over het algemeen lager liggen dan de werkelijke waarden. Naar het einde toe liggen de voorspellingen dan weer hoger. Je zou hier een verklaring voor kunnen zoeken.

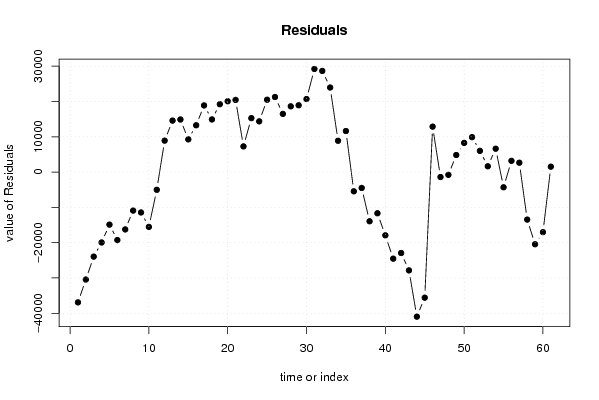
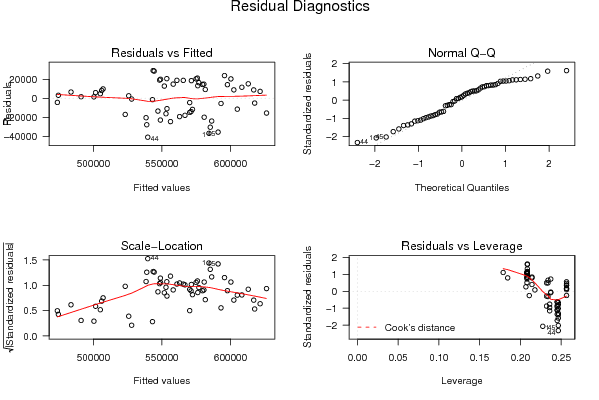
Je uitleg over de residuals is juist, maar kon uitgebreider. Je had nog iets kunnen zeggen over het verloop van de voorspellingsfouten. Je had kunnen verklaren waarom je vanaf periode 30 ongeveer een plotse enorme daling ziet, en hoe het komt dat die vanaf 43 ongeveer ineens weer stijgt.

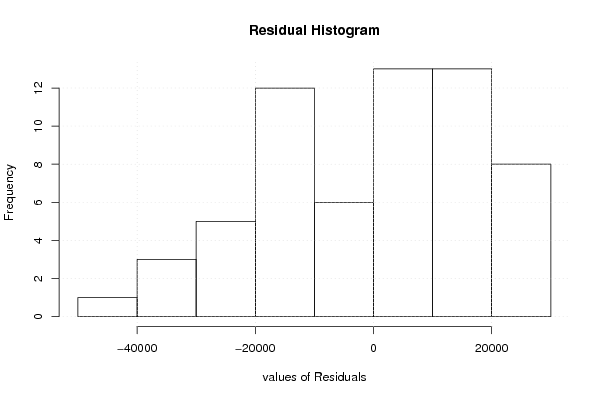
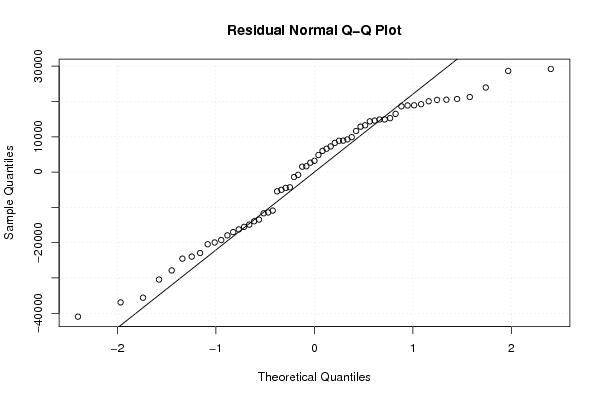
Het histogram en de density plot zijn inderdaad niet normaal verdeeld, maar ze komen wel overeen met de grafieken daarboven. Je ziet dat er meer positieve dan negatieve voorspellingsfouten gemaakt zijn.

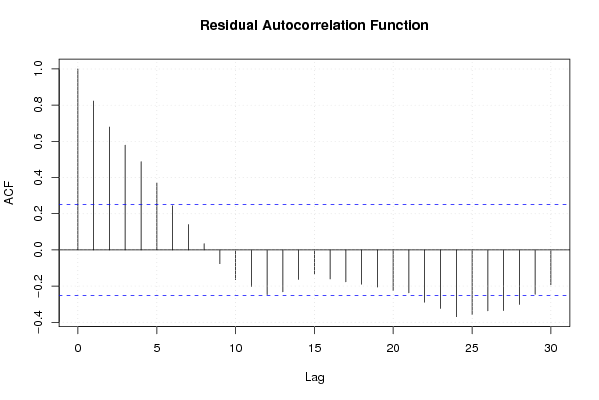
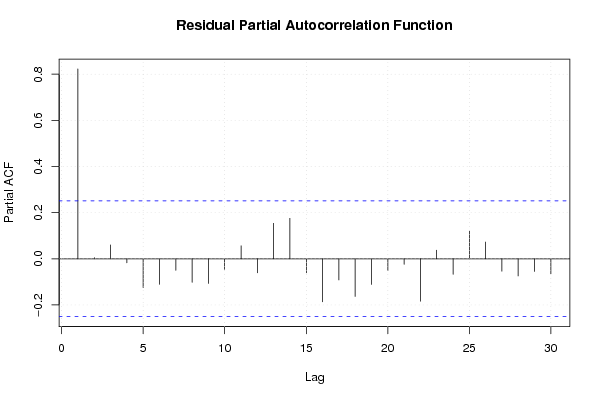
Je conclusie is niet juist. Ik zie nog een zeer grote autocorrelatie! Er is nog een duidelijke dalende trend aanwezig, en aan de onderkant ook nog duidelijk seizoenaliteit. En trouwens, om een verband te onderzoeken maakt het niet uit of er nog autocorrelatie is en een niet constante spreiding van de voorspellingsfouten, dat zijn criteria voor het stationair maken van je tijdreeks, maar dat ben je hier niet aan het doen.

Post a new message
Dataseries X:
547344	0
554788	0
562325	0
560854	0
555332	0
543599	0
536662	0
542722	0
593530	0
610763	0
612613	0
611324	0
594167	0
595454	0
590865	0
589379	0
584428	0
573100	0
567456	0
569028	0
620735	0
628884	0
628232	0
612117	0
595404	0
597141	0
593408	0
590072	0
579799	0
574205	0
572775	0
572942	0
619567	0
625809	0
619916	0
587625	0
565742	0
557274	0
560576	0
548854	0
531673	0
525919	0
511038	0
498662	0
555362	0
564591	1
541657	1
527070	1
509846	1
514258	1
516922	1
507561	1
492622	1
490243	1
469357	1
477580	1
528379	1
533590	1
517945	1
506174	1
501866	1


Summary of computational transaction
Raw Inputview raw input (R code)
Raw Outputview raw output of R engine
Computing time4 seconds
R Server'George Udny Yule' @ 72.249.76.132

\begin{tabular}{lllllllll}
\hline
Summary of computational transaction \tabularnewline
Raw Input & view raw input (R code)  \tabularnewline
Raw Output & view raw output of R engine  \tabularnewline
Computing time & 4 seconds \tabularnewline
R Server & 'George Udny Yule' @ 72.249.76.132 \tabularnewline
\hline
\end{tabular}
%Source: https://freestatistics.org/blog/index.php?pk=36258&T=0

[TABLE]
[ROW][C]Summary of computational transaction[/C][/ROW]
[ROW][C]Raw Input[/C][C]view raw input (R code) [/C][/ROW]
[ROW][C]Raw Output[/C][C]view raw output of R engine [/C][/ROW]
[ROW][C]Computing time[/C][C]4 seconds[/C][/ROW]
[ROW][C]R Server[/C][C]'George Udny Yule' @ 72.249.76.132[/C][/ROW]
[/TABLE]
Source: https://freestatistics.org/blog/index.php?pk=36258&T=0

Globally Unique Identifier (entire table): ba.freestatistics.org/blog/index.php?pk=36258&T=0

As an alternative you can also use a QR Code:  

The GUIDs for individual cells are displayed in the table below:

Summary of computational transaction
Raw Inputview raw input (R code)
Raw Outputview raw output of R engine
Computing time4 seconds
R Server'George Udny Yule' @ 72.249.76.132


Multiple Linear Regression - Estimated Regression Equation
Werkloosheid[t] = + 607102.02384106 -60547.5405629139Kredietcrisis[t] -22451.0315397349M1[t] -21083.2324503312M2[t] -19657.5600165564M3[t] -24743.2875827814M4[t] -34927.0151490066M5[t] -41895.1427152318M6[t] -51461.2702814569M7[t] -50342.5978476821M8[t] + 1374.67458609271M9[t] + 23086.4551324503M10[t] + 14821.1275662252M11[t] -389.472433774837t + e[t]

\begin{tabular}{lllllllll}
\hline
Multiple Linear Regression - Estimated Regression Equation \tabularnewline
Werkloosheid[t] =  +  607102.02384106 -60547.5405629139Kredietcrisis[t] -22451.0315397349M1[t] -21083.2324503312M2[t] -19657.5600165564M3[t] -24743.2875827814M4[t] -34927.0151490066M5[t] -41895.1427152318M6[t] -51461.2702814569M7[t] -50342.5978476821M8[t] +  1374.67458609271M9[t] +  23086.4551324503M10[t] +  14821.1275662252M11[t] -389.472433774837t  + e[t] \tabularnewline
\hline
\end{tabular}
%Source: https://freestatistics.org/blog/index.php?pk=36258&T=1

[TABLE]
[ROW][C]Multiple Linear Regression - Estimated Regression Equation[/C][/ROW]
[ROW][C]Werkloosheid[t] =  +  607102.02384106 -60547.5405629139Kredietcrisis[t] -22451.0315397349M1[t] -21083.2324503312M2[t] -19657.5600165564M3[t] -24743.2875827814M4[t] -34927.0151490066M5[t] -41895.1427152318M6[t] -51461.2702814569M7[t] -50342.5978476821M8[t] +  1374.67458609271M9[t] +  23086.4551324503M10[t] +  14821.1275662252M11[t] -389.472433774837t  + e[t][/C][/ROW]
[/TABLE]
Source: https://freestatistics.org/blog/index.php?pk=36258&T=1

Globally Unique Identifier (entire table): ba.freestatistics.org/blog/index.php?pk=36258&T=1

As an alternative you can also use a QR Code:  

The GUIDs for individual cells are displayed in the table below:

Multiple Linear Regression - Estimated Regression Equation
Werkloosheid[t] = + 607102.02384106 -60547.5405629139Kredietcrisis[t] -22451.0315397349M1[t] -21083.2324503312M2[t] -19657.5600165564M3[t] -24743.2875827814M4[t] -34927.0151490066M5[t] -41895.1427152318M6[t] -51461.2702814569M7[t] -50342.5978476821M8[t] + 1374.67458609271M9[t] + 23086.4551324503M10[t] + 14821.1275662252M11[t] -389.472433774837t + e[t]


Multiple Linear Regression - Ordinary Least Squares
VariableParameterS.D.T-STATH0: parameter = 02-tail p-value1-tail p-value
(Intercept)607102.0238410610870.39637355.849100
Kredietcrisis-60547.54056291399315.917037-6.499400
M1-22451.031539734912303.479968-1.82480.0743950.037198
M2-21083.232450331212911.247205-1.63290.1091650.054583
M3-19657.560016556412897.303127-1.52420.134170.067085
M4-24743.287582781412887.501508-1.91990.0609460.030473
M5-34927.015149006612881.851804-2.71130.0093290.004665
M6-41895.142715231812880.359477-3.25260.002120.00106
M7-51461.270281456912883.025972-3.99450.0002270.000113
M8-50342.597847682112889.848709-3.90560.0002990.00015
M91374.6745860927112900.8210930.10660.9155940.457797
M1023086.455132450312832.2186951.79910.0784250.039213
M1114821.127566225212825.9549831.15560.2537030.126852
t-389.472433774837231.45582-1.68270.0990640.049532

\begin{tabular}{lllllllll}
\hline
Multiple Linear Regression - Ordinary Least Squares \tabularnewline
Variable & Parameter & S.D. & T-STATH0: parameter = 0 & 2-tail p-value & 1-tail p-value \tabularnewline
(Intercept) & 607102.02384106 & 10870.396373 & 55.8491 & 0 & 0 \tabularnewline
Kredietcrisis & -60547.5405629139 & 9315.917037 & -6.4994 & 0 & 0 \tabularnewline
M1 & -22451.0315397349 & 12303.479968 & -1.8248 & 0.074395 & 0.037198 \tabularnewline
M2 & -21083.2324503312 & 12911.247205 & -1.6329 & 0.109165 & 0.054583 \tabularnewline
M3 & -19657.5600165564 & 12897.303127 & -1.5242 & 0.13417 & 0.067085 \tabularnewline
M4 & -24743.2875827814 & 12887.501508 & -1.9199 & 0.060946 & 0.030473 \tabularnewline
M5 & -34927.0151490066 & 12881.851804 & -2.7113 & 0.009329 & 0.004665 \tabularnewline
M6 & -41895.1427152318 & 12880.359477 & -3.2526 & 0.00212 & 0.00106 \tabularnewline
M7 & -51461.2702814569 & 12883.025972 & -3.9945 & 0.000227 & 0.000113 \tabularnewline
M8 & -50342.5978476821 & 12889.848709 & -3.9056 & 0.000299 & 0.00015 \tabularnewline
M9 & 1374.67458609271 & 12900.821093 & 0.1066 & 0.915594 & 0.457797 \tabularnewline
M10 & 23086.4551324503 & 12832.218695 & 1.7991 & 0.078425 & 0.039213 \tabularnewline
M11 & 14821.1275662252 & 12825.954983 & 1.1556 & 0.253703 & 0.126852 \tabularnewline
t & -389.472433774837 & 231.45582 & -1.6827 & 0.099064 & 0.049532 \tabularnewline
\hline
\end{tabular}
%Source: https://freestatistics.org/blog/index.php?pk=36258&T=2

[TABLE]
[ROW][C]Multiple Linear Regression - Ordinary Least Squares[/C][/ROW]
[ROW][C]Variable[/C][C]Parameter[/C][C]S.D.[/C][C]T-STATH0: parameter = 0[/C][C]2-tail p-value[/C][C]1-tail p-value[/C][/ROW]
[ROW][C](Intercept)[/C][C]607102.02384106[/C][C]10870.396373[/C][C]55.8491[/C][C]0[/C][C]0[/C][/ROW]
[ROW][C]Kredietcrisis[/C][C]-60547.5405629139[/C][C]9315.917037[/C][C]-6.4994[/C][C]0[/C][C]0[/C][/ROW]
[ROW][C]M1[/C][C]-22451.0315397349[/C][C]12303.479968[/C][C]-1.8248[/C][C]0.074395[/C][C]0.037198[/C][/ROW]
[ROW][C]M2[/C][C]-21083.2324503312[/C][C]12911.247205[/C][C]-1.6329[/C][C]0.109165[/C][C]0.054583[/C][/ROW]
[ROW][C]M3[/C][C]-19657.5600165564[/C][C]12897.303127[/C][C]-1.5242[/C][C]0.13417[/C][C]0.067085[/C][/ROW]
[ROW][C]M4[/C][C]-24743.2875827814[/C][C]12887.501508[/C][C]-1.9199[/C][C]0.060946[/C][C]0.030473[/C][/ROW]
[ROW][C]M5[/C][C]-34927.0151490066[/C][C]12881.851804[/C][C]-2.7113[/C][C]0.009329[/C][C]0.004665[/C][/ROW]
[ROW][C]M6[/C][C]-41895.1427152318[/C][C]12880.359477[/C][C]-3.2526[/C][C]0.00212[/C][C]0.00106[/C][/ROW]
[ROW][C]M7[/C][C]-51461.2702814569[/C][C]12883.025972[/C][C]-3.9945[/C][C]0.000227[/C][C]0.000113[/C][/ROW]
[ROW][C]M8[/C][C]-50342.5978476821[/C][C]12889.848709[/C][C]-3.9056[/C][C]0.000299[/C][C]0.00015[/C][/ROW]
[ROW][C]M9[/C][C]1374.67458609271[/C][C]12900.821093[/C][C]0.1066[/C][C]0.915594[/C][C]0.457797[/C][/ROW]
[ROW][C]M10[/C][C]23086.4551324503[/C][C]12832.218695[/C][C]1.7991[/C][C]0.078425[/C][C]0.039213[/C][/ROW]
[ROW][C]M11[/C][C]14821.1275662252[/C][C]12825.954983[/C][C]1.1556[/C][C]0.253703[/C][C]0.126852[/C][/ROW]
[ROW][C]t[/C][C]-389.472433774837[/C][C]231.45582[/C][C]-1.6827[/C][C]0.099064[/C][C]0.049532[/C][/ROW]
[/TABLE]
Source: https://freestatistics.org/blog/index.php?pk=36258&T=2

Globally Unique Identifier (entire table): ba.freestatistics.org/blog/index.php?pk=36258&T=2

As an alternative you can also use a QR Code:  

The GUIDs for individual cells are displayed in the table below:

Multiple Linear Regression - Ordinary Least Squares
VariableParameterS.D.T-STATH0: parameter = 02-tail p-value1-tail p-value
(Intercept)607102.0238410610870.39637355.849100
Kredietcrisis-60547.54056291399315.917037-6.499400
M1-22451.031539734912303.479968-1.82480.0743950.037198
M2-21083.232450331212911.247205-1.63290.1091650.054583
M3-19657.560016556412897.303127-1.52420.134170.067085
M4-24743.287582781412887.501508-1.91990.0609460.030473
M5-34927.015149006612881.851804-2.71130.0093290.004665
M6-41895.142715231812880.359477-3.25260.002120.00106
M7-51461.270281456912883.025972-3.99450.0002270.000113
M8-50342.597847682112889.848709-3.90560.0002990.00015
M91374.6745860927112900.8210930.10660.9155940.457797
M1023086.455132450312832.2186951.79910.0784250.039213
M1114821.127566225212825.9549831.15560.2537030.126852
t-389.472433774837231.45582-1.68270.0990640.049532


Multiple Linear Regression - Regression Statistics
Multiple R0.900632572216153
R-squared0.811139030136684
Adjusted R-squared0.758900889536192
F-TEST (value)15.5277163546102
F-TEST (DF numerator)13
F-TEST (DF denominator)47
p-value7.93143328792212e-13
Multiple Linear Regression - Residual Statistics
Residual Standard Deviation20276.3131165098
Sum Squared Residuals19323057059.1411

\begin{tabular}{lllllllll}
\hline
Multiple Linear Regression - Regression Statistics \tabularnewline
Multiple R & 0.900632572216153 \tabularnewline
R-squared & 0.811139030136684 \tabularnewline
Adjusted R-squared & 0.758900889536192 \tabularnewline
F-TEST (value) & 15.5277163546102 \tabularnewline
F-TEST (DF numerator) & 13 \tabularnewline
F-TEST (DF denominator) & 47 \tabularnewline
p-value & 7.93143328792212e-13 \tabularnewline
Multiple Linear Regression - Residual Statistics \tabularnewline
Residual Standard Deviation & 20276.3131165098 \tabularnewline
Sum Squared Residuals & 19323057059.1411 \tabularnewline
\hline
\end{tabular}
%Source: https://freestatistics.org/blog/index.php?pk=36258&T=3

[TABLE]
[ROW][C]Multiple Linear Regression - Regression Statistics[/C][/ROW]
[ROW][C]Multiple R[/C][C]0.900632572216153[/C][/ROW]
[ROW][C]R-squared[/C][C]0.811139030136684[/C][/ROW]
[ROW][C]Adjusted R-squared[/C][C]0.758900889536192[/C][/ROW]
[ROW][C]F-TEST (value)[/C][C]15.5277163546102[/C][/ROW]
[ROW][C]F-TEST (DF numerator)[/C][C]13[/C][/ROW]
[ROW][C]F-TEST (DF denominator)[/C][C]47[/C][/ROW]
[ROW][C]p-value[/C][C]7.93143328792212e-13[/C][/ROW]
[ROW][C]Multiple Linear Regression - Residual Statistics[/C][/ROW]
[ROW][C]Residual Standard Deviation[/C][C]20276.3131165098[/C][/ROW]
[ROW][C]Sum Squared Residuals[/C][C]19323057059.1411[/C][/ROW]
[/TABLE]
Source: https://freestatistics.org/blog/index.php?pk=36258&T=3

Globally Unique Identifier (entire table): ba.freestatistics.org/blog/index.php?pk=36258&T=3

As an alternative you can also use a QR Code:  

The GUIDs for individual cells are displayed in the table below:

Multiple Linear Regression - Regression Statistics
Multiple R0.900632572216153
R-squared0.811139030136684
Adjusted R-squared0.758900889536192
F-TEST (value)15.5277163546102
F-TEST (DF numerator)13
F-TEST (DF denominator)47
p-value7.93143328792212e-13
Multiple Linear Regression - Residual Statistics
Residual Standard Deviation20276.3131165098
Sum Squared Residuals19323057059.1411


Multiple Linear Regression - Actuals, Interpolation, and Residuals
Time or IndexActualsInterpolationForecastResidualsPrediction Error
1547344584261.519867549-36917.5198675488
2554788585239.846523179-30451.8465231788
3562325586276.046523179-23951.0465231789
4560854580800.846523179-19946.8465231789
5555332570227.646523179-14895.6465231788
6543599562870.046523179-19271.0465231789
7536662552914.446523179-16252.4465231788
8542722553643.646523179-10921.6465231789
9593530604971.446523179-11441.4465231789
10610763626293.754635762-15530.7546357616
11612613617638.954635762-5025.95463576164
12611324602428.3546357628895.64536423834
13594167579587.85066225214579.1493377481
14595454580566.17731788114887.8226821192
15590865581602.3773178819262.6226821192
16589379576127.17731788113251.8226821192
17584428565553.97731788118874.0226821192
18573100558196.37731788114903.6226821192
19567456548240.77731788119215.2226821192
20569028548969.97731788120058.0226821192
21620735600297.77731788120437.2226821192
22628884621620.0854304647263.91456953642
23628232612965.28543046415266.7145695364
24612117597754.68543046414362.3145695364
25595404574914.18145695420489.8185430462
26597141575892.50811258321248.4918874172
27593408576928.70811258316479.2918874172
28590072571453.50811258318618.4918874172
29579799560880.30811258318918.6918874172
30574205553522.70811258320682.2918874172
31572775543567.10811258329207.8918874172
32572942544296.30811258328645.6918874172
33619567595624.10811258323942.8918874172
34625809616946.4162251658862.58377483447
35619916608291.61622516611624.3837748345
36587625593081.016225166-5456.01622516555
37565742570240.512251656-4498.51225165578
38557274571218.838907285-13944.8389072847
39560576572255.038907285-11679.0389072847
40548854566779.838907285-17925.8389072847
41531673556206.638907285-24533.6389072847
42525919548849.038907285-22930.0389072847
43511038538893.438907285-27855.4389072847
44498662539622.638907285-40960.6389072847
45555362590950.438907285-35588.4389072847
46564591551725.20645695412865.7935430464
47541657543070.406456954-1413.40645695364
48527070527859.806456954-789.806456953648
49509846505019.3024834444826.69751655612
50514258505997.6291390738260.3708609272
51516922507033.8291390739888.1708609272
52507561501558.6291390736002.37086092718
53492622490985.4291390731636.57086092717
54490243483627.8291390736615.17086092718
55469357473672.229139073-4315.22913907285
56477580474401.4291390733178.57086092715
57528379525729.2291390732649.77086092719
58533590547051.537251656-13461.5372516556
59517945538396.737251656-20451.7372516556
60506174523186.137251656-17012.1372516556
61501866500345.6332781461520.36672185417

\begin{tabular}{lllllllll}
\hline
Multiple Linear Regression - Actuals, Interpolation, and Residuals \tabularnewline
Time or Index & Actuals & InterpolationForecast & ResidualsPrediction Error \tabularnewline
1 & 547344 & 584261.519867549 & -36917.5198675488 \tabularnewline
2 & 554788 & 585239.846523179 & -30451.8465231788 \tabularnewline
3 & 562325 & 586276.046523179 & -23951.0465231789 \tabularnewline
4 & 560854 & 580800.846523179 & -19946.8465231789 \tabularnewline
5 & 555332 & 570227.646523179 & -14895.6465231788 \tabularnewline
6 & 543599 & 562870.046523179 & -19271.0465231789 \tabularnewline
7 & 536662 & 552914.446523179 & -16252.4465231788 \tabularnewline
8 & 542722 & 553643.646523179 & -10921.6465231789 \tabularnewline
9 & 593530 & 604971.446523179 & -11441.4465231789 \tabularnewline
10 & 610763 & 626293.754635762 & -15530.7546357616 \tabularnewline
11 & 612613 & 617638.954635762 & -5025.95463576164 \tabularnewline
12 & 611324 & 602428.354635762 & 8895.64536423834 \tabularnewline
13 & 594167 & 579587.850662252 & 14579.1493377481 \tabularnewline
14 & 595454 & 580566.177317881 & 14887.8226821192 \tabularnewline
15 & 590865 & 581602.377317881 & 9262.6226821192 \tabularnewline
16 & 589379 & 576127.177317881 & 13251.8226821192 \tabularnewline
17 & 584428 & 565553.977317881 & 18874.0226821192 \tabularnewline
18 & 573100 & 558196.377317881 & 14903.6226821192 \tabularnewline
19 & 567456 & 548240.777317881 & 19215.2226821192 \tabularnewline
20 & 569028 & 548969.977317881 & 20058.0226821192 \tabularnewline
21 & 620735 & 600297.777317881 & 20437.2226821192 \tabularnewline
22 & 628884 & 621620.085430464 & 7263.91456953642 \tabularnewline
23 & 628232 & 612965.285430464 & 15266.7145695364 \tabularnewline
24 & 612117 & 597754.685430464 & 14362.3145695364 \tabularnewline
25 & 595404 & 574914.181456954 & 20489.8185430462 \tabularnewline
26 & 597141 & 575892.508112583 & 21248.4918874172 \tabularnewline
27 & 593408 & 576928.708112583 & 16479.2918874172 \tabularnewline
28 & 590072 & 571453.508112583 & 18618.4918874172 \tabularnewline
29 & 579799 & 560880.308112583 & 18918.6918874172 \tabularnewline
30 & 574205 & 553522.708112583 & 20682.2918874172 \tabularnewline
31 & 572775 & 543567.108112583 & 29207.8918874172 \tabularnewline
32 & 572942 & 544296.308112583 & 28645.6918874172 \tabularnewline
33 & 619567 & 595624.108112583 & 23942.8918874172 \tabularnewline
34 & 625809 & 616946.416225165 & 8862.58377483447 \tabularnewline
35 & 619916 & 608291.616225166 & 11624.3837748345 \tabularnewline
36 & 587625 & 593081.016225166 & -5456.01622516555 \tabularnewline
37 & 565742 & 570240.512251656 & -4498.51225165578 \tabularnewline
38 & 557274 & 571218.838907285 & -13944.8389072847 \tabularnewline
39 & 560576 & 572255.038907285 & -11679.0389072847 \tabularnewline
40 & 548854 & 566779.838907285 & -17925.8389072847 \tabularnewline
41 & 531673 & 556206.638907285 & -24533.6389072847 \tabularnewline
42 & 525919 & 548849.038907285 & -22930.0389072847 \tabularnewline
43 & 511038 & 538893.438907285 & -27855.4389072847 \tabularnewline
44 & 498662 & 539622.638907285 & -40960.6389072847 \tabularnewline
45 & 555362 & 590950.438907285 & -35588.4389072847 \tabularnewline
46 & 564591 & 551725.206456954 & 12865.7935430464 \tabularnewline
47 & 541657 & 543070.406456954 & -1413.40645695364 \tabularnewline
48 & 527070 & 527859.806456954 & -789.806456953648 \tabularnewline
49 & 509846 & 505019.302483444 & 4826.69751655612 \tabularnewline
50 & 514258 & 505997.629139073 & 8260.3708609272 \tabularnewline
51 & 516922 & 507033.829139073 & 9888.1708609272 \tabularnewline
52 & 507561 & 501558.629139073 & 6002.37086092718 \tabularnewline
53 & 492622 & 490985.429139073 & 1636.57086092717 \tabularnewline
54 & 490243 & 483627.829139073 & 6615.17086092718 \tabularnewline
55 & 469357 & 473672.229139073 & -4315.22913907285 \tabularnewline
56 & 477580 & 474401.429139073 & 3178.57086092715 \tabularnewline
57 & 528379 & 525729.229139073 & 2649.77086092719 \tabularnewline
58 & 533590 & 547051.537251656 & -13461.5372516556 \tabularnewline
59 & 517945 & 538396.737251656 & -20451.7372516556 \tabularnewline
60 & 506174 & 523186.137251656 & -17012.1372516556 \tabularnewline
61 & 501866 & 500345.633278146 & 1520.36672185417 \tabularnewline
\hline
\end{tabular}
%Source: https://freestatistics.org/blog/index.php?pk=36258&T=4

[TABLE]
[ROW][C]Multiple Linear Regression - Actuals, Interpolation, and Residuals[/C][/ROW]
[ROW][C]Time or Index[/C][C]Actuals[/C][C]InterpolationForecast[/C][C]ResidualsPrediction Error[/C][/ROW]
[ROW][C]1[/C][C]547344[/C][C]584261.519867549[/C][C]-36917.5198675488[/C][/ROW]
[ROW][C]2[/C][C]554788[/C][C]585239.846523179[/C][C]-30451.8465231788[/C][/ROW]
[ROW][C]3[/C][C]562325[/C][C]586276.046523179[/C][C]-23951.0465231789[/C][/ROW]
[ROW][C]4[/C][C]560854[/C][C]580800.846523179[/C][C]-19946.8465231789[/C][/ROW]
[ROW][C]5[/C][C]555332[/C][C]570227.646523179[/C][C]-14895.6465231788[/C][/ROW]
[ROW][C]6[/C][C]543599[/C][C]562870.046523179[/C][C]-19271.0465231789[/C][/ROW]
[ROW][C]7[/C][C]536662[/C][C]552914.446523179[/C][C]-16252.4465231788[/C][/ROW]
[ROW][C]8[/C][C]542722[/C][C]553643.646523179[/C][C]-10921.6465231789[/C][/ROW]
[ROW][C]9[/C][C]593530[/C][C]604971.446523179[/C][C]-11441.4465231789[/C][/ROW]
[ROW][C]10[/C][C]610763[/C][C]626293.754635762[/C][C]-15530.7546357616[/C][/ROW]
[ROW][C]11[/C][C]612613[/C][C]617638.954635762[/C][C]-5025.95463576164[/C][/ROW]
[ROW][C]12[/C][C]611324[/C][C]602428.354635762[/C][C]8895.64536423834[/C][/ROW]
[ROW][C]13[/C][C]594167[/C][C]579587.850662252[/C][C]14579.1493377481[/C][/ROW]
[ROW][C]14[/C][C]595454[/C][C]580566.177317881[/C][C]14887.8226821192[/C][/ROW]
[ROW][C]15[/C][C]590865[/C][C]581602.377317881[/C][C]9262.6226821192[/C][/ROW]
[ROW][C]16[/C][C]589379[/C][C]576127.177317881[/C][C]13251.8226821192[/C][/ROW]
[ROW][C]17[/C][C]584428[/C][C]565553.977317881[/C][C]18874.0226821192[/C][/ROW]
[ROW][C]18[/C][C]573100[/C][C]558196.377317881[/C][C]14903.6226821192[/C][/ROW]
[ROW][C]19[/C][C]567456[/C][C]548240.777317881[/C][C]19215.2226821192[/C][/ROW]
[ROW][C]20[/C][C]569028[/C][C]548969.977317881[/C][C]20058.0226821192[/C][/ROW]
[ROW][C]21[/C][C]620735[/C][C]600297.777317881[/C][C]20437.2226821192[/C][/ROW]
[ROW][C]22[/C][C]628884[/C][C]621620.085430464[/C][C]7263.91456953642[/C][/ROW]
[ROW][C]23[/C][C]628232[/C][C]612965.285430464[/C][C]15266.7145695364[/C][/ROW]
[ROW][C]24[/C][C]612117[/C][C]597754.685430464[/C][C]14362.3145695364[/C][/ROW]
[ROW][C]25[/C][C]595404[/C][C]574914.181456954[/C][C]20489.8185430462[/C][/ROW]
[ROW][C]26[/C][C]597141[/C][C]575892.508112583[/C][C]21248.4918874172[/C][/ROW]
[ROW][C]27[/C][C]593408[/C][C]576928.708112583[/C][C]16479.2918874172[/C][/ROW]
[ROW][C]28[/C][C]590072[/C][C]571453.508112583[/C][C]18618.4918874172[/C][/ROW]
[ROW][C]29[/C][C]579799[/C][C]560880.308112583[/C][C]18918.6918874172[/C][/ROW]
[ROW][C]30[/C][C]574205[/C][C]553522.708112583[/C][C]20682.2918874172[/C][/ROW]
[ROW][C]31[/C][C]572775[/C][C]543567.108112583[/C][C]29207.8918874172[/C][/ROW]
[ROW][C]32[/C][C]572942[/C][C]544296.308112583[/C][C]28645.6918874172[/C][/ROW]
[ROW][C]33[/C][C]619567[/C][C]595624.108112583[/C][C]23942.8918874172[/C][/ROW]
[ROW][C]34[/C][C]625809[/C][C]616946.416225165[/C][C]8862.58377483447[/C][/ROW]
[ROW][C]35[/C][C]619916[/C][C]608291.616225166[/C][C]11624.3837748345[/C][/ROW]
[ROW][C]36[/C][C]587625[/C][C]593081.016225166[/C][C]-5456.01622516555[/C][/ROW]
[ROW][C]37[/C][C]565742[/C][C]570240.512251656[/C][C]-4498.51225165578[/C][/ROW]
[ROW][C]38[/C][C]557274[/C][C]571218.838907285[/C][C]-13944.8389072847[/C][/ROW]
[ROW][C]39[/C][C]560576[/C][C]572255.038907285[/C][C]-11679.0389072847[/C][/ROW]
[ROW][C]40[/C][C]548854[/C][C]566779.838907285[/C][C]-17925.8389072847[/C][/ROW]
[ROW][C]41[/C][C]531673[/C][C]556206.638907285[/C][C]-24533.6389072847[/C][/ROW]
[ROW][C]42[/C][C]525919[/C][C]548849.038907285[/C][C]-22930.0389072847[/C][/ROW]
[ROW][C]43[/C][C]511038[/C][C]538893.438907285[/C][C]-27855.4389072847[/C][/ROW]
[ROW][C]44[/C][C]498662[/C][C]539622.638907285[/C][C]-40960.6389072847[/C][/ROW]
[ROW][C]45[/C][C]555362[/C][C]590950.438907285[/C][C]-35588.4389072847[/C][/ROW]
[ROW][C]46[/C][C]564591[/C][C]551725.206456954[/C][C]12865.7935430464[/C][/ROW]
[ROW][C]47[/C][C]541657[/C][C]543070.406456954[/C][C]-1413.40645695364[/C][/ROW]
[ROW][C]48[/C][C]527070[/C][C]527859.806456954[/C][C]-789.806456953648[/C][/ROW]
[ROW][C]49[/C][C]509846[/C][C]505019.302483444[/C][C]4826.69751655612[/C][/ROW]
[ROW][C]50[/C][C]514258[/C][C]505997.629139073[/C][C]8260.3708609272[/C][/ROW]
[ROW][C]51[/C][C]516922[/C][C]507033.829139073[/C][C]9888.1708609272[/C][/ROW]
[ROW][C]52[/C][C]507561[/C][C]501558.629139073[/C][C]6002.37086092718[/C][/ROW]
[ROW][C]53[/C][C]492622[/C][C]490985.429139073[/C][C]1636.57086092717[/C][/ROW]
[ROW][C]54[/C][C]490243[/C][C]483627.829139073[/C][C]6615.17086092718[/C][/ROW]
[ROW][C]55[/C][C]469357[/C][C]473672.229139073[/C][C]-4315.22913907285[/C][/ROW]
[ROW][C]56[/C][C]477580[/C][C]474401.429139073[/C][C]3178.57086092715[/C][/ROW]
[ROW][C]57[/C][C]528379[/C][C]525729.229139073[/C][C]2649.77086092719[/C][/ROW]
[ROW][C]58[/C][C]533590[/C][C]547051.537251656[/C][C]-13461.5372516556[/C][/ROW]
[ROW][C]59[/C][C]517945[/C][C]538396.737251656[/C][C]-20451.7372516556[/C][/ROW]
[ROW][C]60[/C][C]506174[/C][C]523186.137251656[/C][C]-17012.1372516556[/C][/ROW]
[ROW][C]61[/C][C]501866[/C][C]500345.633278146[/C][C]1520.36672185417[/C][/ROW]
[/TABLE]
Source: https://freestatistics.org/blog/index.php?pk=36258&T=4

Globally Unique Identifier (entire table): ba.freestatistics.org/blog/index.php?pk=36258&T=4

As an alternative you can also use a QR Code:  

The GUIDs for individual cells are displayed in the table below:

Multiple Linear Regression - Actuals, Interpolation, and Residuals
Time or IndexActualsInterpolationForecastResidualsPrediction Error
1547344584261.519867549-36917.5198675488
2554788585239.846523179-30451.8465231788
3562325586276.046523179-23951.0465231789
4560854580800.846523179-19946.8465231789
5555332570227.646523179-14895.6465231788
6543599562870.046523179-19271.0465231789
7536662552914.446523179-16252.4465231788
8542722553643.646523179-10921.6465231789
9593530604971.446523179-11441.4465231789
10610763626293.754635762-15530.7546357616
11612613617638.954635762-5025.95463576164
12611324602428.3546357628895.64536423834
13594167579587.85066225214579.1493377481
14595454580566.17731788114887.8226821192
15590865581602.3773178819262.6226821192
16589379576127.17731788113251.8226821192
17584428565553.97731788118874.0226821192
18573100558196.37731788114903.6226821192
19567456548240.77731788119215.2226821192
20569028548969.97731788120058.0226821192
21620735600297.77731788120437.2226821192
22628884621620.0854304647263.91456953642
23628232612965.28543046415266.7145695364
24612117597754.68543046414362.3145695364
25595404574914.18145695420489.8185430462
26597141575892.50811258321248.4918874172
27593408576928.70811258316479.2918874172
28590072571453.50811258318618.4918874172
29579799560880.30811258318918.6918874172
30574205553522.70811258320682.2918874172
31572775543567.10811258329207.8918874172
32572942544296.30811258328645.6918874172
33619567595624.10811258323942.8918874172
34625809616946.4162251658862.58377483447
35619916608291.61622516611624.3837748345
36587625593081.016225166-5456.01622516555
37565742570240.512251656-4498.51225165578
38557274571218.838907285-13944.8389072847
39560576572255.038907285-11679.0389072847
40548854566779.838907285-17925.8389072847
41531673556206.638907285-24533.6389072847
42525919548849.038907285-22930.0389072847
43511038538893.438907285-27855.4389072847
44498662539622.638907285-40960.6389072847
45555362590950.438907285-35588.4389072847
46564591551725.20645695412865.7935430464
47541657543070.406456954-1413.40645695364
48527070527859.806456954-789.806456953648
49509846505019.3024834444826.69751655612
50514258505997.6291390738260.3708609272
51516922507033.8291390739888.1708609272
52507561501558.6291390736002.37086092718
53492622490985.4291390731636.57086092717
54490243483627.8291390736615.17086092718
55469357473672.229139073-4315.22913907285
56477580474401.4291390733178.57086092715
57528379525729.2291390732649.77086092719
58533590547051.537251656-13461.5372516556
59517945538396.737251656-20451.7372516556
60506174523186.137251656-17012.1372516556
61501866500345.6332781461520.36672185417


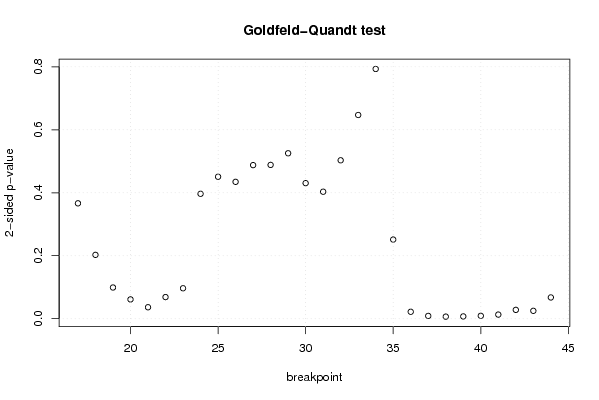
Goldfeld-Quandt test for Heteroskedasticity
p-valuesAlternative Hypothesis
breakpoint indexgreater2-sidedless
170.1832363784499720.3664727568999440.816763621550028
180.1014011174236820.2028022348473640.898598882576318
190.04953803385786380.09907606771572760.950461966142136
200.03064319395698220.06128638791396440.969356806043018
210.01819358819138190.03638717638276380.981806411808618
220.0343464544978680.0686929089957360.965653545502132
230.04834007799659890.09668015599319780.951659922003401
240.1983539916563420.3967079833126840.801646008343658
250.22540378558540.45080757117080.7745962144146
260.2173542778757660.4347085557515310.782645722124234
270.2438894947734580.4877789895469160.756110505226542
280.2442326608853810.4884653217707620.755767339114619
290.2626993601865250.5253987203730500.737300639813475
300.2152534053860460.4305068107720920.784746594613954
310.2016263687969470.4032527375938930.798373631203053
320.2515337767353270.5030675534706540.748466223264673
330.323468479950410.646936959900820.67653152004959
340.3966041542074280.7932083084148560.603395845792572
350.8743156130719070.2513687738561860.125684386928093
360.9890048028945180.02199039421096470.0109951971054823
370.9955740062909890.008851987418021850.00442599370901093
380.9967397968588820.006520406282236850.00326020314111843
390.9963486890407630.007302621918473470.00365131095923674
400.995426907137130.009146185725740240.00457309286287012
410.9934673658654860.01306526826902750.00653263413451375
420.9859473176037850.02810536479243040.0140526823962152
430.9874827330006220.02503453399875630.0125172669993782
440.9662266901072140.06754661978557120.0337733098927856

\begin{tabular}{lllllllll}
\hline
Goldfeld-Quandt test for Heteroskedasticity \tabularnewline
p-values & Alternative Hypothesis \tabularnewline
breakpoint index & greater & 2-sided & less \tabularnewline
17 & 0.183236378449972 & 0.366472756899944 & 0.816763621550028 \tabularnewline
18 & 0.101401117423682 & 0.202802234847364 & 0.898598882576318 \tabularnewline
19 & 0.0495380338578638 & 0.0990760677157276 & 0.950461966142136 \tabularnewline
20 & 0.0306431939569822 & 0.0612863879139644 & 0.969356806043018 \tabularnewline
21 & 0.0181935881913819 & 0.0363871763827638 & 0.981806411808618 \tabularnewline
22 & 0.034346454497868 & 0.068692908995736 & 0.965653545502132 \tabularnewline
23 & 0.0483400779965989 & 0.0966801559931978 & 0.951659922003401 \tabularnewline
24 & 0.198353991656342 & 0.396707983312684 & 0.801646008343658 \tabularnewline
25 & 0.2254037855854 & 0.4508075711708 & 0.7745962144146 \tabularnewline
26 & 0.217354277875766 & 0.434708555751531 & 0.782645722124234 \tabularnewline
27 & 0.243889494773458 & 0.487778989546916 & 0.756110505226542 \tabularnewline
28 & 0.244232660885381 & 0.488465321770762 & 0.755767339114619 \tabularnewline
29 & 0.262699360186525 & 0.525398720373050 & 0.737300639813475 \tabularnewline
30 & 0.215253405386046 & 0.430506810772092 & 0.784746594613954 \tabularnewline
31 & 0.201626368796947 & 0.403252737593893 & 0.798373631203053 \tabularnewline
32 & 0.251533776735327 & 0.503067553470654 & 0.748466223264673 \tabularnewline
33 & 0.32346847995041 & 0.64693695990082 & 0.67653152004959 \tabularnewline
34 & 0.396604154207428 & 0.793208308414856 & 0.603395845792572 \tabularnewline
35 & 0.874315613071907 & 0.251368773856186 & 0.125684386928093 \tabularnewline
36 & 0.989004802894518 & 0.0219903942109647 & 0.0109951971054823 \tabularnewline
37 & 0.995574006290989 & 0.00885198741802185 & 0.00442599370901093 \tabularnewline
38 & 0.996739796858882 & 0.00652040628223685 & 0.00326020314111843 \tabularnewline
39 & 0.996348689040763 & 0.00730262191847347 & 0.00365131095923674 \tabularnewline
40 & 0.99542690713713 & 0.00914618572574024 & 0.00457309286287012 \tabularnewline
41 & 0.993467365865486 & 0.0130652682690275 & 0.00653263413451375 \tabularnewline
42 & 0.985947317603785 & 0.0281053647924304 & 0.0140526823962152 \tabularnewline
43 & 0.987482733000622 & 0.0250345339987563 & 0.0125172669993782 \tabularnewline
44 & 0.966226690107214 & 0.0675466197855712 & 0.0337733098927856 \tabularnewline
\hline
\end{tabular}
%Source: https://freestatistics.org/blog/index.php?pk=36258&T=5

[TABLE]
[ROW][C]Goldfeld-Quandt test for Heteroskedasticity[/C][/ROW]
[ROW][C]p-values[/C][C]Alternative Hypothesis[/C][/ROW]
[ROW][C]breakpoint index[/C][C]greater[/C][C]2-sided[/C][C]less[/C][/ROW]
[ROW][C]17[/C][C]0.183236378449972[/C][C]0.366472756899944[/C][C]0.816763621550028[/C][/ROW]
[ROW][C]18[/C][C]0.101401117423682[/C][C]0.202802234847364[/C][C]0.898598882576318[/C][/ROW]
[ROW][C]19[/C][C]0.0495380338578638[/C][C]0.0990760677157276[/C][C]0.950461966142136[/C][/ROW]
[ROW][C]20[/C][C]0.0306431939569822[/C][C]0.0612863879139644[/C][C]0.969356806043018[/C][/ROW]
[ROW][C]21[/C][C]0.0181935881913819[/C][C]0.0363871763827638[/C][C]0.981806411808618[/C][/ROW]
[ROW][C]22[/C][C]0.034346454497868[/C][C]0.068692908995736[/C][C]0.965653545502132[/C][/ROW]
[ROW][C]23[/C][C]0.0483400779965989[/C][C]0.0966801559931978[/C][C]0.951659922003401[/C][/ROW]
[ROW][C]24[/C][C]0.198353991656342[/C][C]0.396707983312684[/C][C]0.801646008343658[/C][/ROW]
[ROW][C]25[/C][C]0.2254037855854[/C][C]0.4508075711708[/C][C]0.7745962144146[/C][/ROW]
[ROW][C]26[/C][C]0.217354277875766[/C][C]0.434708555751531[/C][C]0.782645722124234[/C][/ROW]
[ROW][C]27[/C][C]0.243889494773458[/C][C]0.487778989546916[/C][C]0.756110505226542[/C][/ROW]
[ROW][C]28[/C][C]0.244232660885381[/C][C]0.488465321770762[/C][C]0.755767339114619[/C][/ROW]
[ROW][C]29[/C][C]0.262699360186525[/C][C]0.525398720373050[/C][C]0.737300639813475[/C][/ROW]
[ROW][C]30[/C][C]0.215253405386046[/C][C]0.430506810772092[/C][C]0.784746594613954[/C][/ROW]
[ROW][C]31[/C][C]0.201626368796947[/C][C]0.403252737593893[/C][C]0.798373631203053[/C][/ROW]
[ROW][C]32[/C][C]0.251533776735327[/C][C]0.503067553470654[/C][C]0.748466223264673[/C][/ROW]
[ROW][C]33[/C][C]0.32346847995041[/C][C]0.64693695990082[/C][C]0.67653152004959[/C][/ROW]
[ROW][C]34[/C][C]0.396604154207428[/C][C]0.793208308414856[/C][C]0.603395845792572[/C][/ROW]
[ROW][C]35[/C][C]0.874315613071907[/C][C]0.251368773856186[/C][C]0.125684386928093[/C][/ROW]
[ROW][C]36[/C][C]0.989004802894518[/C][C]0.0219903942109647[/C][C]0.0109951971054823[/C][/ROW]
[ROW][C]37[/C][C]0.995574006290989[/C][C]0.00885198741802185[/C][C]0.00442599370901093[/C][/ROW]
[ROW][C]38[/C][C]0.996739796858882[/C][C]0.00652040628223685[/C][C]0.00326020314111843[/C][/ROW]
[ROW][C]39[/C][C]0.996348689040763[/C][C]0.00730262191847347[/C][C]0.00365131095923674[/C][/ROW]
[ROW][C]40[/C][C]0.99542690713713[/C][C]0.00914618572574024[/C][C]0.00457309286287012[/C][/ROW]
[ROW][C]41[/C][C]0.993467365865486[/C][C]0.0130652682690275[/C][C]0.00653263413451375[/C][/ROW]
[ROW][C]42[/C][C]0.985947317603785[/C][C]0.0281053647924304[/C][C]0.0140526823962152[/C][/ROW]
[ROW][C]43[/C][C]0.987482733000622[/C][C]0.0250345339987563[/C][C]0.0125172669993782[/C][/ROW]
[ROW][C]44[/C][C]0.966226690107214[/C][C]0.0675466197855712[/C][C]0.0337733098927856[/C][/ROW]
[/TABLE]
Source: https://freestatistics.org/blog/index.php?pk=36258&T=5

Globally Unique Identifier (entire table): ba.freestatistics.org/blog/index.php?pk=36258&T=5

As an alternative you can also use a QR Code:  

The GUIDs for individual cells are displayed in the table below:

Goldfeld-Quandt test for Heteroskedasticity
p-valuesAlternative Hypothesis
breakpoint indexgreater2-sidedless
170.1832363784499720.3664727568999440.816763621550028
180.1014011174236820.2028022348473640.898598882576318
190.04953803385786380.09907606771572760.950461966142136
200.03064319395698220.06128638791396440.969356806043018
210.01819358819138190.03638717638276380.981806411808618
220.0343464544978680.0686929089957360.965653545502132
230.04834007799659890.09668015599319780.951659922003401
240.1983539916563420.3967079833126840.801646008343658
250.22540378558540.45080757117080.7745962144146
260.2173542778757660.4347085557515310.782645722124234
270.2438894947734580.4877789895469160.756110505226542
280.2442326608853810.4884653217707620.755767339114619
290.2626993601865250.5253987203730500.737300639813475
300.2152534053860460.4305068107720920.784746594613954
310.2016263687969470.4032527375938930.798373631203053
320.2515337767353270.5030675534706540.748466223264673
330.323468479950410.646936959900820.67653152004959
340.3966041542074280.7932083084148560.603395845792572
350.8743156130719070.2513687738561860.125684386928093
360.9890048028945180.02199039421096470.0109951971054823
370.9955740062909890.008851987418021850.00442599370901093
380.9967397968588820.006520406282236850.00326020314111843
390.9963486890407630.007302621918473470.00365131095923674
400.995426907137130.009146185725740240.00457309286287012
410.9934673658654860.01306526826902750.00653263413451375
420.9859473176037850.02810536479243040.0140526823962152
430.9874827330006220.02503453399875630.0125172669993782
440.9662266901072140.06754661978557120.0337733098927856


Meta Analysis of Goldfeld-Quandt test for Heteroskedasticity
Description# significant tests% significant testsOK/NOK
1% type I error level40.142857142857143NOK
5% type I error level90.321428571428571NOK
10% type I error level140.5NOK

\begin{tabular}{lllllllll}
\hline
Meta Analysis of Goldfeld-Quandt test for Heteroskedasticity \tabularnewline
Description & # significant tests & % significant tests & OK/NOK \tabularnewline
1% type I error level & 4 & 0.142857142857143 & NOK \tabularnewline
5% type I error level & 9 & 0.321428571428571 & NOK \tabularnewline
10% type I error level & 14 & 0.5 & NOK \tabularnewline
\hline
\end{tabular}
%Source: https://freestatistics.org/blog/index.php?pk=36258&T=6

[TABLE]
[ROW][C]Meta Analysis of Goldfeld-Quandt test for Heteroskedasticity[/C][/ROW]
[ROW][C]Description[/C][C]# significant tests[/C][C]% significant tests[/C][C]OK/NOK[/C][/ROW]
[ROW][C]1% type I error level[/C][C]4[/C][C]0.142857142857143[/C][C]NOK[/C][/ROW]
[ROW][C]5% type I error level[/C][C]9[/C][C]0.321428571428571[/C][C]NOK[/C][/ROW]
[ROW][C]10% type I error level[/C][C]14[/C][C]0.5[/C][C]NOK[/C][/ROW]
[/TABLE]
Source: https://freestatistics.org/blog/index.php?pk=36258&T=6

Globally Unique Identifier (entire table): ba.freestatistics.org/blog/index.php?pk=36258&T=6

As an alternative you can also use a QR Code:  

The GUIDs for individual cells are displayed in the table below:

Meta Analysis of Goldfeld-Quandt test for Heteroskedasticity
Description# significant tests% significant testsOK/NOK
1% type I error level40.142857142857143NOK
5% type I error level90.321428571428571NOK
10% type I error level140.5NOK


Parameters (Session):
par1 = 1 ; par2 = Include Monthly Dummies ; par3 = Linear Trend ;
Parameters (R input):
par1 = 1 ; par2 = Include Monthly Dummies ; par3 = Linear Trend ;
R code (references can be found in the software module):
library(lattice)
library(lmtest)
n25 <- 25 #minimum number of obs. for Goldfeld-Quandt test
par1 <- as.numeric(par1)
x <- t(y)
k <- length(x[1,])
n <- length(x[,1])
x1 <- cbind(x[,par1], x[,1:k!=par1])
mycolnames <- c(colnames(x)[par1], colnames(x)[1:k!=par1])
colnames(x1) <- mycolnames #colnames(x)[par1]
x <- x1
if (par3 == 'First Differences'){
x2 <- array(0, dim=c(n-1,k), dimnames=list(1:(n-1), paste('(1-B)',colnames(x),sep='')))
for (i in 1:n-1) {
for (j in 1:k) {
x2[i,j] <- x[i+1,j] - x[i,j]
}
}
x <- x2
}
if (par2 == 'Include Monthly Dummies'){
x2 <- array(0, dim=c(n,11), dimnames=list(1:n, paste('M', seq(1:11), sep ='')))
for (i in 1:11){
x2[seq(i,n,12),i] <- 1
}
x <- cbind(x, x2)
}
if (par2 == 'Include Quarterly Dummies'){
x2 <- array(0, dim=c(n,3), dimnames=list(1:n, paste('Q', seq(1:3), sep ='')))
for (i in 1:3){
x2[seq(i,n,4),i] <- 1
}
x <- cbind(x, x2)
}
k <- length(x[1,])
if (par3 == 'Linear Trend'){
x <- cbind(x, c(1:n))
colnames(x)[k+1] <- 't'
}
x
k <- length(x[1,])
df <- as.data.frame(x)
(mylm <- lm(df))
(mysum <- summary(mylm))
if (n > n25) {
kp3 <- k + 3
nmkm3 <- n - k - 3
gqarr <- array(NA, dim=c(nmkm3-kp3+1,3))
numgqtests <- 0
numsignificant1 <- 0
numsignificant5 <- 0
numsignificant10 <- 0
for (mypoint in kp3:nmkm3) {
j <- 0
numgqtests <- numgqtests + 1
for (myalt in c('greater', 'two.sided', 'less')) {
j <- j + 1
gqarr[mypoint-kp3+1,j] <- gqtest(mylm, point=mypoint, alternative=myalt)$p.value
}
if (gqarr[mypoint-kp3+1,2] < 0.01) numsignificant1 <- numsignificant1 + 1
if (gqarr[mypoint-kp3+1,2] < 0.05) numsignificant5 <- numsignificant5 + 1
if (gqarr[mypoint-kp3+1,2] < 0.10) numsignificant10 <- numsignificant10 + 1
}
gqarr
}
bitmap(file='test0.png')
plot(x[,1], type='l', main='Actuals and Interpolation', ylab='value of Actuals and Interpolation (dots)', xlab='time or index')
points(x[,1]-mysum$resid)
grid()
dev.off()
bitmap(file='test1.png')
plot(mysum$resid, type='b', pch=19, main='Residuals', ylab='value of Residuals', xlab='time or index')
grid()
dev.off()
bitmap(file='test2.png')
hist(mysum$resid, main='Residual Histogram', xlab='values of Residuals')
grid()
dev.off()
bitmap(file='test3.png')
densityplot(~mysum$resid,col='black',main='Residual Density Plot', xlab='values of Residuals')
dev.off()
bitmap(file='test4.png')
qqnorm(mysum$resid, main='Residual Normal Q-Q Plot')
qqline(mysum$resid)
grid()
dev.off()
(myerror <- as.ts(mysum$resid))
bitmap(file='test5.png')
dum <- cbind(lag(myerror,k=1),myerror)
dum
dum1 <- dum[2:length(myerror),]
dum1
z <- as.data.frame(dum1)
z
plot(z,main=paste('Residual Lag plot, lowess, and regression line'), ylab='values of Residuals', xlab='lagged values of Residuals')
lines(lowess(z))
abline(lm(z))
grid()
dev.off()
bitmap(file='test6.png')
acf(mysum$resid, lag.max=length(mysum$resid)/2, main='Residual Autocorrelation Function')
grid()
dev.off()
bitmap(file='test7.png')
pacf(mysum$resid, lag.max=length(mysum$resid)/2, main='Residual Partial Autocorrelation Function')
grid()
dev.off()
bitmap(file='test8.png')
opar <- par(mfrow = c(2,2), oma = c(0, 0, 1.1, 0))
plot(mylm, las = 1, sub='Residual Diagnostics')
par(opar)
dev.off()
if (n > n25) {
bitmap(file='test9.png')
plot(kp3:nmkm3,gqarr[,2], main='Goldfeld-Quandt test',ylab='2-sided p-value',xlab='breakpoint')
grid()
dev.off()
}
load(file='createtable')
a<-table.start()
a<-table.row.start(a)
a<-table.element(a, 'Multiple Linear Regression - Estimated Regression Equation', 1, TRUE)
a<-table.row.end(a)
myeq <- colnames(x)[1]
myeq <- paste(myeq, '[t] = ', sep='')
for (i in 1:k){
if (mysum$coefficients[i,1] > 0) myeq <- paste(myeq, '+', '')
myeq <- paste(myeq, mysum$coefficients[i,1], sep=' ')
if (rownames(mysum$coefficients)[i] != '(Intercept)') {
myeq <- paste(myeq, rownames(mysum$coefficients)[i], sep='')
if (rownames(mysum$coefficients)[i] != 't') myeq <- paste(myeq, '[t]', sep='')
}
}
myeq <- paste(myeq, ' + e[t]')
a<-table.row.start(a)
a<-table.element(a, myeq)
a<-table.row.end(a)
a<-table.end(a)
table.save(a,file='mytable1.tab')
a<-table.start()
a<-table.row.start(a)
a<-table.element(a,hyperlink('ols1.htm','Multiple Linear Regression - Ordinary Least Squares',''), 6, TRUE)
a<-table.row.end(a)
a<-table.row.start(a)
a<-table.element(a,'Variable',header=TRUE)
a<-table.element(a,'Parameter',header=TRUE)
a<-table.element(a,'S.D.',header=TRUE)
a<-table.element(a,'T-STAT
H0: parameter = 0',header=TRUE)
a<-table.element(a,'2-tail p-value',header=TRUE)
a<-table.element(a,'1-tail p-value',header=TRUE)
a<-table.row.end(a)
for (i in 1:k){
a<-table.row.start(a)
a<-table.element(a,rownames(mysum$coefficients)[i],header=TRUE)
a<-table.element(a,mysum$coefficients[i,1])
a<-table.element(a, round(mysum$coefficients[i,2],6))
a<-table.element(a, round(mysum$coefficients[i,3],4))
a<-table.element(a, round(mysum$coefficients[i,4],6))
a<-table.element(a, round(mysum$coefficients[i,4]/2,6))
a<-table.row.end(a)
}
a<-table.end(a)
table.save(a,file='mytable2.tab')
a<-table.start()
a<-table.row.start(a)
a<-table.element(a, 'Multiple Linear Regression - Regression Statistics', 2, TRUE)
a<-table.row.end(a)
a<-table.row.start(a)
a<-table.element(a, 'Multiple R',1,TRUE)
a<-table.element(a, sqrt(mysum$r.squared))
a<-table.row.end(a)
a<-table.row.start(a)
a<-table.element(a, 'R-squared',1,TRUE)
a<-table.element(a, mysum$r.squared)
a<-table.row.end(a)
a<-table.row.start(a)
a<-table.element(a, 'Adjusted R-squared',1,TRUE)
a<-table.element(a, mysum$adj.r.squared)
a<-table.row.end(a)
a<-table.row.start(a)
a<-table.element(a, 'F-TEST (value)',1,TRUE)
a<-table.element(a, mysum$fstatistic[1])
a<-table.row.end(a)
a<-table.row.start(a)
a<-table.element(a, 'F-TEST (DF numerator)',1,TRUE)
a<-table.element(a, mysum$fstatistic[2])
a<-table.row.end(a)
a<-table.row.start(a)
a<-table.element(a, 'F-TEST (DF denominator)',1,TRUE)
a<-table.element(a, mysum$fstatistic[3])
a<-table.row.end(a)
a<-table.row.start(a)
a<-table.element(a, 'p-value',1,TRUE)
a<-table.element(a, 1-pf(mysum$fstatistic[1],mysum$fstatistic[2],mysum$fstatistic[3]))
a<-table.row.end(a)
a<-table.row.start(a)
a<-table.element(a, 'Multiple Linear Regression - Residual Statistics', 2, TRUE)
a<-table.row.end(a)
a<-table.row.start(a)
a<-table.element(a, 'Residual Standard Deviation',1,TRUE)
a<-table.element(a, mysum$sigma)
a<-table.row.end(a)
a<-table.row.start(a)
a<-table.element(a, 'Sum Squared Residuals',1,TRUE)
a<-table.element(a, sum(myerror*myerror))
a<-table.row.end(a)
a<-table.end(a)
table.save(a,file='mytable3.tab')
a<-table.start()
a<-table.row.start(a)
a<-table.element(a, 'Multiple Linear Regression - Actuals, Interpolation, and Residuals', 4, TRUE)
a<-table.row.end(a)
a<-table.row.start(a)
a<-table.element(a, 'Time or Index', 1, TRUE)
a<-table.element(a, 'Actuals', 1, TRUE)
a<-table.element(a, 'Interpolation
Forecast', 1, TRUE)
a<-table.element(a, 'Residuals
Prediction Error', 1, TRUE)
a<-table.row.end(a)
for (i in 1:n) {
a<-table.row.start(a)
a<-table.element(a,i, 1, TRUE)
a<-table.element(a,x[i])
a<-table.element(a,x[i]-mysum$resid[i])
a<-table.element(a,mysum$resid[i])
a<-table.row.end(a)
}
a<-table.end(a)
table.save(a,file='mytable4.tab')
if (n > n25) {
a<-table.start()
a<-table.row.start(a)
a<-table.element(a,'Goldfeld-Quandt test for Heteroskedasticity',4,TRUE)
a<-table.row.end(a)
a<-table.row.start(a)
a<-table.element(a,'p-values',header=TRUE)
a<-table.element(a,'Alternative Hypothesis',3,header=TRUE)
a<-table.row.end(a)
a<-table.row.start(a)
a<-table.element(a,'breakpoint index',header=TRUE)
a<-table.element(a,'greater',header=TRUE)
a<-table.element(a,'2-sided',header=TRUE)
a<-table.element(a,'less',header=TRUE)
a<-table.row.end(a)
for (mypoint in kp3:nmkm3) {
a<-table.row.start(a)
a<-table.element(a,mypoint,header=TRUE)
a<-table.element(a,gqarr[mypoint-kp3+1,1])
a<-table.element(a,gqarr[mypoint-kp3+1,2])
a<-table.element(a,gqarr[mypoint-kp3+1,3])
a<-table.row.end(a)
}
a<-table.end(a)
table.save(a,file='mytable5.tab')
a<-table.start()
a<-table.row.start(a)
a<-table.element(a,'Meta Analysis of Goldfeld-Quandt test for Heteroskedasticity',4,TRUE)
a<-table.row.end(a)
a<-table.row.start(a)
a<-table.element(a,'Description',header=TRUE)
a<-table.element(a,'# significant tests',header=TRUE)
a<-table.element(a,'% significant tests',header=TRUE)
a<-table.element(a,'OK/NOK',header=TRUE)
a<-table.row.end(a)
a<-table.row.start(a)
a<-table.element(a,'1% type I error level',header=TRUE)
a<-table.element(a,numsignificant1)
a<-table.element(a,numsignificant1/numgqtests)
if (numsignificant1/numgqtests < 0.01) dum <- 'OK' else dum <- 'NOK'
a<-table.element(a,dum)
a<-table.row.end(a)
a<-table.row.start(a)
a<-table.element(a,'5% type I error level',header=TRUE)
a<-table.element(a,numsignificant5)
a<-table.element(a,numsignificant5/numgqtests)
if (numsignificant5/numgqtests < 0.05) dum <- 'OK' else dum <- 'NOK'
a<-table.element(a,dum)
a<-table.row.end(a)
a<-table.row.start(a)
a<-table.element(a,'10% type I error level',header=TRUE)
a<-table.element(a,numsignificant10)
a<-table.element(a,numsignificant10/numgqtests)
if (numsignificant10/numgqtests < 0.1) dum <- 'OK' else dum <- 'NOK'
a<-table.element(a,dum)
a<-table.row.end(a)
a<-table.end(a)
table.save(a,file='mytable6.tab')
}