Free Statistics

of Irreproducible Research!

Author's title

Author*The author of this computation has been verified*
R Software Modulerwasp_arimaforecasting.wasp
Title produced by softwareARIMA Forecasting
Date of computationMon, 22 Dec 2008 14:38:56 -0700
Cite this page as followsStatistical Computations at FreeStatistics.org, Office for Research Development and Education, URL https://freestatistics.org/blog/index.php?v=date/2008/Dec/22/t1229981988dxxbgrlsiof4i9z.htm/, Retrieved Mon, 13 May 2024 15:30:30 +0000
Statistical Computations at FreeStatistics.org, Office for Research Development and Education, URL https://freestatistics.org/blog/index.php?pk=36231, Retrieved Mon, 13 May 2024 15:30:30 +0000
QR Codes:

Original text written by user:
IsPrivate?No (this computation is public)
User-defined keywords
Estimated Impact182
Family? (F = Feedback message, R = changed R code, M = changed R Module, P = changed Parameters, D = changed Data)
F     [Univariate Explorative Data Analysis] [Investigation Dis...] [2007-10-21 17:06:37] [b9964c45117f7aac638ab9056d451faa]
F    D  [Univariate Explorative Data Analysis] [Reproduce Q2] [2008-10-24 13:27:07] [deb3c14ac9e4607a6d84fc9d0e0e6cc2]
- RMPD    [(Partial) Autocorrelation Function] [Paper H5 Mannen (...] [2008-12-13 14:12:34] [deb3c14ac9e4607a6d84fc9d0e0e6cc2]
- RMP       [ARIMA Backward Selection] [Paper H6 Mannen A...] [2008-12-13 16:00:00] [deb3c14ac9e4607a6d84fc9d0e0e6cc2]
- RMPD          [ARIMA Forecasting] [Paper H6 Vrouwen ...] [2008-12-22 21:38:56] [5e9e099b83e50415d7642e10d74756e4] [Current]
Feedback Forum

Post a new message
Dataseries X:
308347
298427
289231
291975
294912
293488
290555
284736
281818
287854
316263
325412
326011
328282
317480
317539
313737
312276
309391
302950
300316
304035
333476
337698
335932
323931
313927
314485
313218
309664
302963
298989
298423
301631
329765
335083
327616
309119
295916
291413
291542
284678
276475
272566
264981
263290
296806
303598
286994
276427
266424
267153
268381
262522
255542
253158
243803
250741
280445
285257
270976
261076
255603


Summary of computational transaction
Raw Inputview raw input (R code)
Raw Outputview raw output of R engine
Computing time2 seconds
R Server'George Udny Yule' @ 72.249.76.132

\begin{tabular}{lllllllll}
\hline
Summary of computational transaction \tabularnewline
Raw Input & view raw input (R code)  \tabularnewline
Raw Output & view raw output of R engine  \tabularnewline
Computing time & 2 seconds \tabularnewline
R Server & 'George Udny Yule' @ 72.249.76.132 \tabularnewline
\hline
\end{tabular}
%Source: https://freestatistics.org/blog/index.php?pk=36231&T=0

[TABLE]
[ROW][C]Summary of computational transaction[/C][/ROW]
[ROW][C]Raw Input[/C][C]view raw input (R code) [/C][/ROW]
[ROW][C]Raw Output[/C][C]view raw output of R engine [/C][/ROW]
[ROW][C]Computing time[/C][C]2 seconds[/C][/ROW]
[ROW][C]R Server[/C][C]'George Udny Yule' @ 72.249.76.132[/C][/ROW]
[/TABLE]
Source: https://freestatistics.org/blog/index.php?pk=36231&T=0

Globally Unique Identifier (entire table): ba.freestatistics.org/blog/index.php?pk=36231&T=0

As an alternative you can also use a QR Code:  

The GUIDs for individual cells are displayed in the table below:

Summary of computational transaction
Raw Inputview raw input (R code)
Raw Outputview raw output of R engine
Computing time2 seconds
R Server'George Udny Yule' @ 72.249.76.132


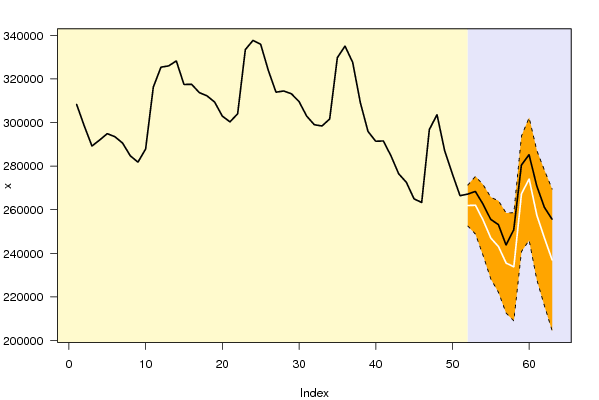
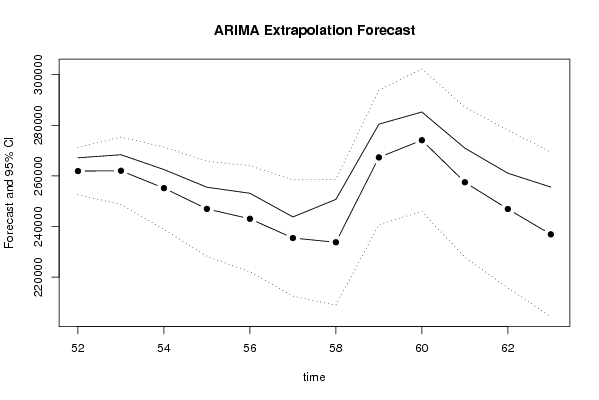
Univariate ARIMA Extrapolation Forecast
timeY[t]F[t]95% LB95% UBp-value(H0: Y[t] = F[t])P(F[t]>Y[t-1])P(F[t]>Y[t-s])P(F[t]>Y[51])
39295916-------
40291413-------
41291542-------
42284678-------
43276475-------
44272566-------
45264981-------
46263290-------
47296806-------
48303598-------
49286994-------
50276427-------
51266424-------
52267153261921252538.3892271303.61080.13720.173400.1734
53268381262050248780.9846275319.01540.17490.225500.2591
54262522255186238934.8414271437.15860.18810.05582e-040.0876
55255542246983228217.7784265748.22160.18570.05230.0010.0211
56253158243074222093.8444264054.15560.17310.12210.00290.0146
57243803235489212506.3911258471.60890.23920.06590.00590.0042
58250741233798208973.9452258622.05480.09050.21480.00990.005
59280445267314240775.9691293852.03090.16610.88950.01470.5262
60285257274106245958.1676302253.83240.21870.32950.020.7036
61270976257502227831.5795287172.42050.18670.03340.02570.2778
62261076246935215816.4004278053.59960.18660.0650.03160.1098
63255603236932204429.6828269434.31720.13010.07270.03770.0377

\begin{tabular}{lllllllll}
\hline
Univariate ARIMA Extrapolation Forecast \tabularnewline
time & Y[t] & F[t] & 95% LB & 95% UB & p-value(H0: Y[t] = F[t]) & P(F[t]>Y[t-1]) & P(F[t]>Y[t-s]) & P(F[t]>Y[51]) \tabularnewline
39 & 295916 & - & - & - & - & - & - & - \tabularnewline
40 & 291413 & - & - & - & - & - & - & - \tabularnewline
41 & 291542 & - & - & - & - & - & - & - \tabularnewline
42 & 284678 & - & - & - & - & - & - & - \tabularnewline
43 & 276475 & - & - & - & - & - & - & - \tabularnewline
44 & 272566 & - & - & - & - & - & - & - \tabularnewline
45 & 264981 & - & - & - & - & - & - & - \tabularnewline
46 & 263290 & - & - & - & - & - & - & - \tabularnewline
47 & 296806 & - & - & - & - & - & - & - \tabularnewline
48 & 303598 & - & - & - & - & - & - & - \tabularnewline
49 & 286994 & - & - & - & - & - & - & - \tabularnewline
50 & 276427 & - & - & - & - & - & - & - \tabularnewline
51 & 266424 & - & - & - & - & - & - & - \tabularnewline
52 & 267153 & 261921 & 252538.3892 & 271303.6108 & 0.1372 & 0.1734 & 0 & 0.1734 \tabularnewline
53 & 268381 & 262050 & 248780.9846 & 275319.0154 & 0.1749 & 0.2255 & 0 & 0.2591 \tabularnewline
54 & 262522 & 255186 & 238934.8414 & 271437.1586 & 0.1881 & 0.0558 & 2e-04 & 0.0876 \tabularnewline
55 & 255542 & 246983 & 228217.7784 & 265748.2216 & 0.1857 & 0.0523 & 0.001 & 0.0211 \tabularnewline
56 & 253158 & 243074 & 222093.8444 & 264054.1556 & 0.1731 & 0.1221 & 0.0029 & 0.0146 \tabularnewline
57 & 243803 & 235489 & 212506.3911 & 258471.6089 & 0.2392 & 0.0659 & 0.0059 & 0.0042 \tabularnewline
58 & 250741 & 233798 & 208973.9452 & 258622.0548 & 0.0905 & 0.2148 & 0.0099 & 0.005 \tabularnewline
59 & 280445 & 267314 & 240775.9691 & 293852.0309 & 0.1661 & 0.8895 & 0.0147 & 0.5262 \tabularnewline
60 & 285257 & 274106 & 245958.1676 & 302253.8324 & 0.2187 & 0.3295 & 0.02 & 0.7036 \tabularnewline
61 & 270976 & 257502 & 227831.5795 & 287172.4205 & 0.1867 & 0.0334 & 0.0257 & 0.2778 \tabularnewline
62 & 261076 & 246935 & 215816.4004 & 278053.5996 & 0.1866 & 0.065 & 0.0316 & 0.1098 \tabularnewline
63 & 255603 & 236932 & 204429.6828 & 269434.3172 & 0.1301 & 0.0727 & 0.0377 & 0.0377 \tabularnewline
\hline
\end{tabular}
%Source: https://freestatistics.org/blog/index.php?pk=36231&T=1

[TABLE]
[ROW][C]Univariate ARIMA Extrapolation Forecast[/C][/ROW]
[ROW][C]time[/C][C]Y[t][/C][C]F[t][/C][C]95% LB[/C][C]95% UB[/C][C]p-value(H0: Y[t] = F[t])[/C][C]P(F[t]>Y[t-1])[/C][C]P(F[t]>Y[t-s])[/C][C]P(F[t]>Y[51])[/C][/ROW]
[ROW][C]39[/C][C]295916[/C][C]-[/C][C]-[/C][C]-[/C][C]-[/C][C]-[/C][C]-[/C][C]-[/C][/ROW]
[ROW][C]40[/C][C]291413[/C][C]-[/C][C]-[/C][C]-[/C][C]-[/C][C]-[/C][C]-[/C][C]-[/C][/ROW]
[ROW][C]41[/C][C]291542[/C][C]-[/C][C]-[/C][C]-[/C][C]-[/C][C]-[/C][C]-[/C][C]-[/C][/ROW]
[ROW][C]42[/C][C]284678[/C][C]-[/C][C]-[/C][C]-[/C][C]-[/C][C]-[/C][C]-[/C][C]-[/C][/ROW]
[ROW][C]43[/C][C]276475[/C][C]-[/C][C]-[/C][C]-[/C][C]-[/C][C]-[/C][C]-[/C][C]-[/C][/ROW]
[ROW][C]44[/C][C]272566[/C][C]-[/C][C]-[/C][C]-[/C][C]-[/C][C]-[/C][C]-[/C][C]-[/C][/ROW]
[ROW][C]45[/C][C]264981[/C][C]-[/C][C]-[/C][C]-[/C][C]-[/C][C]-[/C][C]-[/C][C]-[/C][/ROW]
[ROW][C]46[/C][C]263290[/C][C]-[/C][C]-[/C][C]-[/C][C]-[/C][C]-[/C][C]-[/C][C]-[/C][/ROW]
[ROW][C]47[/C][C]296806[/C][C]-[/C][C]-[/C][C]-[/C][C]-[/C][C]-[/C][C]-[/C][C]-[/C][/ROW]
[ROW][C]48[/C][C]303598[/C][C]-[/C][C]-[/C][C]-[/C][C]-[/C][C]-[/C][C]-[/C][C]-[/C][/ROW]
[ROW][C]49[/C][C]286994[/C][C]-[/C][C]-[/C][C]-[/C][C]-[/C][C]-[/C][C]-[/C][C]-[/C][/ROW]
[ROW][C]50[/C][C]276427[/C][C]-[/C][C]-[/C][C]-[/C][C]-[/C][C]-[/C][C]-[/C][C]-[/C][/ROW]
[ROW][C]51[/C][C]266424[/C][C]-[/C][C]-[/C][C]-[/C][C]-[/C][C]-[/C][C]-[/C][C]-[/C][/ROW]
[ROW][C]52[/C][C]267153[/C][C]261921[/C][C]252538.3892[/C][C]271303.6108[/C][C]0.1372[/C][C]0.1734[/C][C]0[/C][C]0.1734[/C][/ROW]
[ROW][C]53[/C][C]268381[/C][C]262050[/C][C]248780.9846[/C][C]275319.0154[/C][C]0.1749[/C][C]0.2255[/C][C]0[/C][C]0.2591[/C][/ROW]
[ROW][C]54[/C][C]262522[/C][C]255186[/C][C]238934.8414[/C][C]271437.1586[/C][C]0.1881[/C][C]0.0558[/C][C]2e-04[/C][C]0.0876[/C][/ROW]
[ROW][C]55[/C][C]255542[/C][C]246983[/C][C]228217.7784[/C][C]265748.2216[/C][C]0.1857[/C][C]0.0523[/C][C]0.001[/C][C]0.0211[/C][/ROW]
[ROW][C]56[/C][C]253158[/C][C]243074[/C][C]222093.8444[/C][C]264054.1556[/C][C]0.1731[/C][C]0.1221[/C][C]0.0029[/C][C]0.0146[/C][/ROW]
[ROW][C]57[/C][C]243803[/C][C]235489[/C][C]212506.3911[/C][C]258471.6089[/C][C]0.2392[/C][C]0.0659[/C][C]0.0059[/C][C]0.0042[/C][/ROW]
[ROW][C]58[/C][C]250741[/C][C]233798[/C][C]208973.9452[/C][C]258622.0548[/C][C]0.0905[/C][C]0.2148[/C][C]0.0099[/C][C]0.005[/C][/ROW]
[ROW][C]59[/C][C]280445[/C][C]267314[/C][C]240775.9691[/C][C]293852.0309[/C][C]0.1661[/C][C]0.8895[/C][C]0.0147[/C][C]0.5262[/C][/ROW]
[ROW][C]60[/C][C]285257[/C][C]274106[/C][C]245958.1676[/C][C]302253.8324[/C][C]0.2187[/C][C]0.3295[/C][C]0.02[/C][C]0.7036[/C][/ROW]
[ROW][C]61[/C][C]270976[/C][C]257502[/C][C]227831.5795[/C][C]287172.4205[/C][C]0.1867[/C][C]0.0334[/C][C]0.0257[/C][C]0.2778[/C][/ROW]
[ROW][C]62[/C][C]261076[/C][C]246935[/C][C]215816.4004[/C][C]278053.5996[/C][C]0.1866[/C][C]0.065[/C][C]0.0316[/C][C]0.1098[/C][/ROW]
[ROW][C]63[/C][C]255603[/C][C]236932[/C][C]204429.6828[/C][C]269434.3172[/C][C]0.1301[/C][C]0.0727[/C][C]0.0377[/C][C]0.0377[/C][/ROW]
[/TABLE]
Source: https://freestatistics.org/blog/index.php?pk=36231&T=1

Globally Unique Identifier (entire table): ba.freestatistics.org/blog/index.php?pk=36231&T=1

As an alternative you can also use a QR Code:  

The GUIDs for individual cells are displayed in the table below:

Univariate ARIMA Extrapolation Forecast
timeY[t]F[t]95% LB95% UBp-value(H0: Y[t] = F[t])P(F[t]>Y[t-1])P(F[t]>Y[t-s])P(F[t]>Y[51])
39295916-------
40291413-------
41291542-------
42284678-------
43276475-------
44272566-------
45264981-------
46263290-------
47296806-------
48303598-------
49286994-------
50276427-------
51266424-------
52267153261921252538.3892271303.61080.13720.173400.1734
53268381262050248780.9846275319.01540.17490.225500.2591
54262522255186238934.8414271437.15860.18810.05582e-040.0876
55255542246983228217.7784265748.22160.18570.05230.0010.0211
56253158243074222093.8444264054.15560.17310.12210.00290.0146
57243803235489212506.3911258471.60890.23920.06590.00590.0042
58250741233798208973.9452258622.05480.09050.21480.00990.005
59280445267314240775.9691293852.03090.16610.88950.01470.5262
60285257274106245958.1676302253.83240.21870.32950.020.7036
61270976257502227831.5795287172.42050.18670.03340.02570.2778
62261076246935215816.4004278053.59960.18660.0650.03160.1098
63255603236932204429.6828269434.31720.13010.07270.03770.0377


Univariate ARIMA Extrapolation Forecast Performance
time% S.E.PEMAPESq.EMSERMSE
520.01830.020.00172737382422811521510.3483
530.02580.02420.002400815613340130.08331827.6023
540.03250.02870.0024538168964484741.33332117.7208
550.03880.03470.0029732564816104706.752470.7705
560.0440.04150.00351016870568473921.33332911.0001
570.04980.03530.0029691225965760216.33332400.0451
580.05420.07250.00628706524923922104.08334891.0228
590.05070.04910.004117242316114368596.753790.5932
600.05240.04070.003412434480110362066.753219.0164
610.05880.05230.004418154867615129056.33333889.6088
620.06430.05730.004819996788116663990.08334082.1551
630.070.07880.006634860624129050520.08335389.8534

\begin{tabular}{lllllllll}
\hline
Univariate ARIMA Extrapolation Forecast Performance \tabularnewline
time & % S.E. & PE & MAPE & Sq.E & MSE & RMSE \tabularnewline
52 & 0.0183 & 0.02 & 0.0017 & 27373824 & 2281152 & 1510.3483 \tabularnewline
53 & 0.0258 & 0.0242 & 0.002 & 40081561 & 3340130.0833 & 1827.6023 \tabularnewline
54 & 0.0325 & 0.0287 & 0.0024 & 53816896 & 4484741.3333 & 2117.7208 \tabularnewline
55 & 0.0388 & 0.0347 & 0.0029 & 73256481 & 6104706.75 & 2470.7705 \tabularnewline
56 & 0.044 & 0.0415 & 0.0035 & 101687056 & 8473921.3333 & 2911.0001 \tabularnewline
57 & 0.0498 & 0.0353 & 0.0029 & 69122596 & 5760216.3333 & 2400.0451 \tabularnewline
58 & 0.0542 & 0.0725 & 0.006 & 287065249 & 23922104.0833 & 4891.0228 \tabularnewline
59 & 0.0507 & 0.0491 & 0.0041 & 172423161 & 14368596.75 & 3790.5932 \tabularnewline
60 & 0.0524 & 0.0407 & 0.0034 & 124344801 & 10362066.75 & 3219.0164 \tabularnewline
61 & 0.0588 & 0.0523 & 0.0044 & 181548676 & 15129056.3333 & 3889.6088 \tabularnewline
62 & 0.0643 & 0.0573 & 0.0048 & 199967881 & 16663990.0833 & 4082.1551 \tabularnewline
63 & 0.07 & 0.0788 & 0.0066 & 348606241 & 29050520.0833 & 5389.8534 \tabularnewline
\hline
\end{tabular}
%Source: https://freestatistics.org/blog/index.php?pk=36231&T=2

[TABLE]
[ROW][C]Univariate ARIMA Extrapolation Forecast Performance[/C][/ROW]
[ROW][C]time[/C][C]% S.E.[/C][C]PE[/C][C]MAPE[/C][C]Sq.E[/C][C]MSE[/C][C]RMSE[/C][/ROW]
[ROW][C]52[/C][C]0.0183[/C][C]0.02[/C][C]0.0017[/C][C]27373824[/C][C]2281152[/C][C]1510.3483[/C][/ROW]
[ROW][C]53[/C][C]0.0258[/C][C]0.0242[/C][C]0.002[/C][C]40081561[/C][C]3340130.0833[/C][C]1827.6023[/C][/ROW]
[ROW][C]54[/C][C]0.0325[/C][C]0.0287[/C][C]0.0024[/C][C]53816896[/C][C]4484741.3333[/C][C]2117.7208[/C][/ROW]
[ROW][C]55[/C][C]0.0388[/C][C]0.0347[/C][C]0.0029[/C][C]73256481[/C][C]6104706.75[/C][C]2470.7705[/C][/ROW]
[ROW][C]56[/C][C]0.044[/C][C]0.0415[/C][C]0.0035[/C][C]101687056[/C][C]8473921.3333[/C][C]2911.0001[/C][/ROW]
[ROW][C]57[/C][C]0.0498[/C][C]0.0353[/C][C]0.0029[/C][C]69122596[/C][C]5760216.3333[/C][C]2400.0451[/C][/ROW]
[ROW][C]58[/C][C]0.0542[/C][C]0.0725[/C][C]0.006[/C][C]287065249[/C][C]23922104.0833[/C][C]4891.0228[/C][/ROW]
[ROW][C]59[/C][C]0.0507[/C][C]0.0491[/C][C]0.0041[/C][C]172423161[/C][C]14368596.75[/C][C]3790.5932[/C][/ROW]
[ROW][C]60[/C][C]0.0524[/C][C]0.0407[/C][C]0.0034[/C][C]124344801[/C][C]10362066.75[/C][C]3219.0164[/C][/ROW]
[ROW][C]61[/C][C]0.0588[/C][C]0.0523[/C][C]0.0044[/C][C]181548676[/C][C]15129056.3333[/C][C]3889.6088[/C][/ROW]
[ROW][C]62[/C][C]0.0643[/C][C]0.0573[/C][C]0.0048[/C][C]199967881[/C][C]16663990.0833[/C][C]4082.1551[/C][/ROW]
[ROW][C]63[/C][C]0.07[/C][C]0.0788[/C][C]0.0066[/C][C]348606241[/C][C]29050520.0833[/C][C]5389.8534[/C][/ROW]
[/TABLE]
Source: https://freestatistics.org/blog/index.php?pk=36231&T=2

Globally Unique Identifier (entire table): ba.freestatistics.org/blog/index.php?pk=36231&T=2

As an alternative you can also use a QR Code:  

The GUIDs for individual cells are displayed in the table below:

Univariate ARIMA Extrapolation Forecast Performance
time% S.E.PEMAPESq.EMSERMSE
520.01830.020.00172737382422811521510.3483
530.02580.02420.002400815613340130.08331827.6023
540.03250.02870.0024538168964484741.33332117.7208
550.03880.03470.0029732564816104706.752470.7705
560.0440.04150.00351016870568473921.33332911.0001
570.04980.03530.0029691225965760216.33332400.0451
580.05420.07250.00628706524923922104.08334891.0228
590.05070.04910.004117242316114368596.753790.5932
600.05240.04070.003412434480110362066.753219.0164
610.05880.05230.004418154867615129056.33333889.6088
620.06430.05730.004819996788116663990.08334082.1551
630.070.07880.006634860624129050520.08335389.8534


Parameters (Session):
par1 = 12 ; par2 = 1 ; par3 = 1 ; par4 = 1 ; par5 = 12 ; par6 = 1 ; par7 = 1 ; par8 = 2 ; par9 = 1 ; par10 = FALSE ;
Parameters (R input):
par1 = 12 ; par2 = 1 ; par3 = 1 ; par4 = 1 ; par5 = 12 ; par6 = 0 ; par7 = 0 ; par8 = 0 ; par9 = 0 ; par10 = FALSE ;
R code (references can be found in the software module):
par1 <- as.numeric(par1) #cut off periods
par2 <- as.numeric(par2) #lambda
par3 <- as.numeric(par3) #degree of non-seasonal differencing
par4 <- as.numeric(par4) #degree of seasonal differencing
par5 <- as.numeric(par5) #seasonal period
par6 <- as.numeric(par6) #p
par7 <- as.numeric(par7) #q
par8 <- as.numeric(par8) #P
par9 <- as.numeric(par9) #Q
if (par10 == 'TRUE') par10 <- TRUE
if (par10 == 'FALSE') par10 <- FALSE
if (par2 == 0) x <- log(x)
if (par2 != 0) x <- x^par2
lx <- length(x)
first <- lx - 2*par1
nx <- lx - par1
nx1 <- nx + 1
fx <- lx - nx
if (fx < 1) {
fx <- par5
nx1 <- lx + fx - 1
first <- lx - 2*fx
}
first <- 1
if (fx < 3) fx <- round(lx/10,0)
(arima.out <- arima(x[1:nx], order=c(par6,par3,par7), seasonal=list(order=c(par8,par4,par9), period=par5), include.mean=par10, method='ML'))
(forecast <- predict(arima.out,fx))
(lb <- forecast$pred - 1.96 * forecast$se)
(ub <- forecast$pred + 1.96 * forecast$se)
if (par2 == 0) {
x <- exp(x)
forecast$pred <- exp(forecast$pred)
lb <- exp(lb)
ub <- exp(ub)
}
if (par2 != 0) {
x <- x^(1/par2)
forecast$pred <- forecast$pred^(1/par2)
lb <- lb^(1/par2)
ub <- ub^(1/par2)
}
if (par2 < 0) {
olb <- lb
lb <- ub
ub <- olb
}
(actandfor <- c(x[1:nx], forecast$pred))
(perc.se <- (ub-forecast$pred)/1.96/forecast$pred)
bitmap(file='test1.png')
opar <- par(mar=c(4,4,2,2),las=1)
ylim <- c( min(x[first:nx],lb), max(x[first:nx],ub))
plot(x,ylim=ylim,type='n',xlim=c(first,lx))
usr <- par('usr')
rect(usr[1],usr[3],nx+1,usr[4],border=NA,col='lemonchiffon')
rect(nx1,usr[3],usr[2],usr[4],border=NA,col='lavender')
abline(h= (-3:3)*2 , col ='gray', lty =3)
polygon( c(nx1:lx,lx:nx1), c(lb,rev(ub)), col = 'orange', lty=2,border=NA)
lines(nx1:lx, lb , lty=2)
lines(nx1:lx, ub , lty=2)
lines(x, lwd=2)
lines(nx1:lx, forecast$pred , lwd=2 , col ='white')
box()
par(opar)
dev.off()
prob.dec <- array(NA, dim=fx)
prob.sdec <- array(NA, dim=fx)
prob.ldec <- array(NA, dim=fx)
prob.pval <- array(NA, dim=fx)
perf.pe <- array(0, dim=fx)
perf.mape <- array(0, dim=fx)
perf.se <- array(0, dim=fx)
perf.mse <- array(0, dim=fx)
perf.rmse <- array(0, dim=fx)
for (i in 1:fx) {
locSD <- (ub[i] - forecast$pred[i]) / 1.96
perf.pe[i] = (x[nx+i] - forecast$pred[i]) / forecast$pred[i]
perf.mape[i] = perf.mape[i] + abs(perf.pe[i])
perf.se[i] = (x[nx+i] - forecast$pred[i])^2
perf.mse[i] = perf.mse[i] + perf.se[i]
prob.dec[i] = pnorm((x[nx+i-1] - forecast$pred[i]) / locSD)
prob.sdec[i] = pnorm((x[nx+i-par5] - forecast$pred[i]) / locSD)
prob.ldec[i] = pnorm((x[nx] - forecast$pred[i]) / locSD)
prob.pval[i] = pnorm(abs(x[nx+i] - forecast$pred[i]) / locSD)
}
perf.mape = perf.mape / fx
perf.mse = perf.mse / fx
perf.rmse = sqrt(perf.mse)
bitmap(file='test2.png')
plot(forecast$pred, pch=19, type='b',main='ARIMA Extrapolation Forecast', ylab='Forecast and 95% CI', xlab='time',ylim=c(min(lb),max(ub)))
dum <- forecast$pred
dum[1:12] <- x[(nx+1):lx]
lines(dum, lty=1)
lines(ub,lty=3)
lines(lb,lty=3)
dev.off()
load(file='createtable')
a<-table.start()
a<-table.row.start(a)
a<-table.element(a,'Univariate ARIMA Extrapolation Forecast',9,TRUE)
a<-table.row.end(a)
a<-table.row.start(a)
a<-table.element(a,'time',1,header=TRUE)
a<-table.element(a,'Y[t]',1,header=TRUE)
a<-table.element(a,'F[t]',1,header=TRUE)
a<-table.element(a,'95% LB',1,header=TRUE)
a<-table.element(a,'95% UB',1,header=TRUE)
a<-table.element(a,'p-value
(H0: Y[t] = F[t])',1,header=TRUE)
a<-table.element(a,'P(F[t]>Y[t-1])',1,header=TRUE)
a<-table.element(a,'P(F[t]>Y[t-s])',1,header=TRUE)
mylab <- paste('P(F[t]>Y[',nx,sep='')
mylab <- paste(mylab,'])',sep='')
a<-table.element(a,mylab,1,header=TRUE)
a<-table.row.end(a)
for (i in (nx-par5):nx) {
a<-table.row.start(a)
a<-table.element(a,i,header=TRUE)
a<-table.element(a,x[i])
a<-table.element(a,'-')
a<-table.row.end(a)
}
for (i in 1:fx) {
a<-table.row.start(a)
a<-table.element(a,nx+i,header=TRUE)
a<-table.element(a,round(x[nx+i],4))
a<-table.element(a,round(forecast$pred[i],4))
a<-table.element(a,round(lb[i],4))
a<-table.element(a,round(ub[i],4))
a<-table.element(a,round((1-prob.pval[i]),4))
a<-table.element(a,round((1-prob.dec[i]),4))
a<-table.element(a,round((1-prob.sdec[i]),4))
a<-table.element(a,round((1-prob.ldec[i]),4))
a<-table.row.end(a)
}
a<-table.end(a)
table.save(a,file='mytable.tab')
a<-table.start()
a<-table.row.start(a)
a<-table.element(a,'Univariate ARIMA Extrapolation Forecast Performance',7,TRUE)
a<-table.row.end(a)
a<-table.row.start(a)
a<-table.element(a,'time',1,header=TRUE)
a<-table.element(a,'% S.E.',1,header=TRUE)
a<-table.element(a,'PE',1,header=TRUE)
a<-table.element(a,'MAPE',1,header=TRUE)
a<-table.element(a,'Sq.E',1,header=TRUE)
a<-table.element(a,'MSE',1,header=TRUE)
a<-table.element(a,'RMSE',1,header=TRUE)
a<-table.row.end(a)
for (i in 1:fx) {
a<-table.row.start(a)
a<-table.element(a,nx+i,header=TRUE)
a<-table.element(a,round(perc.se[i],4))
a<-table.element(a,round(perf.pe[i],4))
a<-table.element(a,round(perf.mape[i],4))
a<-table.element(a,round(perf.se[i],4))
a<-table.element(a,round(perf.mse[i],4))
a<-table.element(a,round(perf.rmse[i],4))
a<-table.row.end(a)
}
a<-table.end(a)
table.save(a,file='mytable1.tab')