Free Statistics

of Irreproducible Research!

Author's title

Author*Unverified author*
R Software Modulerwasp_arimaforecasting.wasp
Title produced by softwareARIMA Forecasting
Date of computationMon, 22 Dec 2008 12:26:08 -0700
Cite this page as followsStatistical Computations at FreeStatistics.org, Office for Research Development and Education, URL https://freestatistics.org/blog/index.php?v=date/2008/Dec/22/t1229974023ttrhijsy9q7wx9e.htm/, Retrieved Sun, 12 May 2024 13:07:10 +0000
Statistical Computations at FreeStatistics.org, Office for Research Development and Education, URL https://freestatistics.org/blog/index.php?pk=36187, Retrieved Sun, 12 May 2024 13:07:10 +0000
QR Codes:

Original text written by user:
IsPrivate?No (this computation is public)
User-defined keywords
Estimated Impact135
Family? (F = Feedback message, R = changed R code, M = changed R Module, P = changed Parameters, D = changed Data)
F       [ARIMA Forecasting] [] [2008-12-22 19:26:08] [d41d8cd98f00b204e9800998ecf8427e] [Current]
Feedback Forum
2009-01-08 13:12:32 [Aurélie Van Impe] [reply
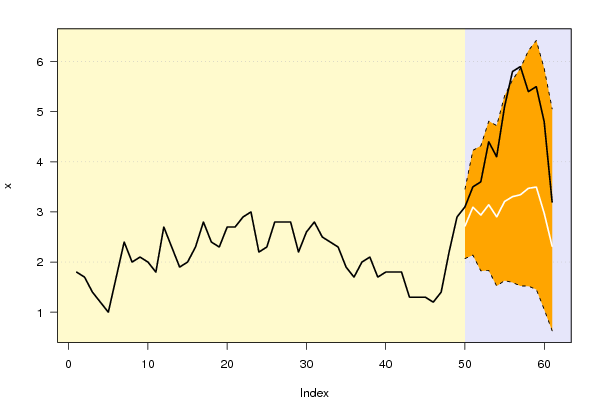
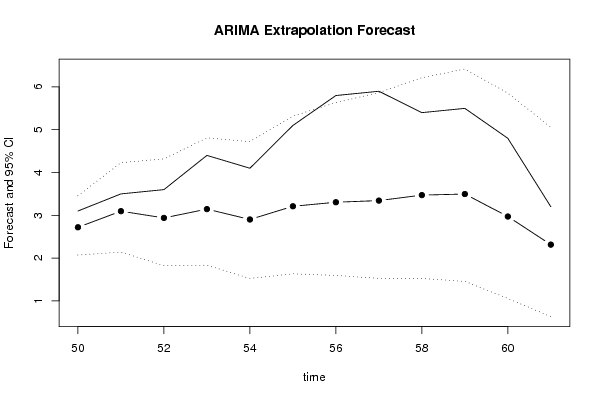
Het betrouwbaarheidsinterval is inderdaad opvallend groot. Wat me nog opvalt in de eerste grafiek, en wat je niet vermeld hebt, is dat de voorspellingslijn vanaf het begin al niet vertrekt vanuit de laatste gekende waarde, maar lager. Dit vind ik een zeer vreemd verschijnsel… Als je kijkt naar de voorgaande gegevens, is het ergens wel logisch dat je model niet kan voorzien dat de inflatie ineens zo enorm sterk gaat stijgen. Desondanks vind ik toch dat alle lijnen bijzonder goed binnen het betrouwbaarheidsinterval blijven. Je had ook nog kunnen vermelden dat tot ongeveer periode 58 de voorspelling en de werkelijke waarde zeer ver uit elkaar liggen. Vanaf daarna echter komen ze terug dichter bij elkaar. Volgens mij wijst dit er toch op dat dit niet zo’n heel goed model is, aangezien de lijnen exploderen. Maar het is inderdaad wel een beter model dan dat voor de werkloosheid. Bij de tweede tabel had je wat meer mogen uitleggen wat je werkelijk ziet in de tabel, in plaats van enkel uit te leggen waarvoor de gegevens staan, want dit wisten we al vanuit de vorige bespreking.

Post a new message
Dataseries X:
1,8
1,7
1,4
1,2
1
1,7
2,4
2
2,1
2
1,8
2,7
2,3
1,9
2
2,3
2,8
2,4
2,3
2,7
2,7
2,9
3
2,2
2,3
2,8
2,8
2,8
2,2
2,6
2,8
2,5
2,4
2,3
1,9
1,7
2
2,1
1,7
1,8
1,8
1,8
1,3
1,3
1,3
1,2
1,4
2,2
2,9
3,1
3,5
3,6
4,4
4,1
5,1
5,8
5,9
5,4
5,5
4,8
3,2


Summary of computational transaction
Raw Inputview raw input (R code)
Raw Outputview raw output of R engine
Computing time1 seconds
R Server'Gwilym Jenkins' @ 72.249.127.135

\begin{tabular}{lllllllll}
\hline
Summary of computational transaction \tabularnewline
Raw Input & view raw input (R code)  \tabularnewline
Raw Output & view raw output of R engine  \tabularnewline
Computing time & 1 seconds \tabularnewline
R Server & 'Gwilym Jenkins' @ 72.249.127.135 \tabularnewline
\hline
\end{tabular}
%Source: https://freestatistics.org/blog/index.php?pk=36187&T=0

[TABLE]
[ROW][C]Summary of computational transaction[/C][/ROW]
[ROW][C]Raw Input[/C][C]view raw input (R code) [/C][/ROW]
[ROW][C]Raw Output[/C][C]view raw output of R engine [/C][/ROW]
[ROW][C]Computing time[/C][C]1 seconds[/C][/ROW]
[ROW][C]R Server[/C][C]'Gwilym Jenkins' @ 72.249.127.135[/C][/ROW]
[/TABLE]
Source: https://freestatistics.org/blog/index.php?pk=36187&T=0

Globally Unique Identifier (entire table): ba.freestatistics.org/blog/index.php?pk=36187&T=0

As an alternative you can also use a QR Code:  

The GUIDs for individual cells are displayed in the table below:

Summary of computational transaction
Raw Inputview raw input (R code)
Raw Outputview raw output of R engine
Computing time1 seconds
R Server'Gwilym Jenkins' @ 72.249.127.135


Univariate ARIMA Extrapolation Forecast
timeY[t]F[t]95% LB95% UBp-value(H0: Y[t] = F[t])P(F[t]>Y[t-1])P(F[t]>Y[t-s])P(F[t]>Y[49])
372-------
382.1-------
391.7-------
401.8-------
411.8-------
421.8-------
431.3-------
441.3-------
451.3-------
461.2-------
471.4-------
482.2-------
492.9-------
503.12.71912.07053.45580.15540.31510.95020.3151
513.53.0962.1394.22950.24240.49720.99210.6327
523.62.93831.82354.31770.17360.21240.94710.5217
534.43.14471.83144.81090.06990.29610.94320.6133
544.12.90181.52244.72230.09850.05340.88220.5008
555.13.21021.63145.31830.03950.2040.96210.6135
565.83.3051.59345.63410.01790.06550.95420.6334
575.93.34331.52385.86860.02360.02830.94360.6346
585.43.47181.52086.21680.08430.04150.94760.6585
595.53.49661.45396.42150.08970.10110.920.6553
604.82.97131.05515.85790.10720.0430.69980.5193
613.22.31360.62975.05620.26320.03780.33760.3376

\begin{tabular}{lllllllll}
\hline
Univariate ARIMA Extrapolation Forecast \tabularnewline
time & Y[t] & F[t] & 95% LB & 95% UB & p-value(H0: Y[t] = F[t]) & P(F[t]>Y[t-1]) & P(F[t]>Y[t-s]) & P(F[t]>Y[49]) \tabularnewline
37 & 2 & - & - & - & - & - & - & - \tabularnewline
38 & 2.1 & - & - & - & - & - & - & - \tabularnewline
39 & 1.7 & - & - & - & - & - & - & - \tabularnewline
40 & 1.8 & - & - & - & - & - & - & - \tabularnewline
41 & 1.8 & - & - & - & - & - & - & - \tabularnewline
42 & 1.8 & - & - & - & - & - & - & - \tabularnewline
43 & 1.3 & - & - & - & - & - & - & - \tabularnewline
44 & 1.3 & - & - & - & - & - & - & - \tabularnewline
45 & 1.3 & - & - & - & - & - & - & - \tabularnewline
46 & 1.2 & - & - & - & - & - & - & - \tabularnewline
47 & 1.4 & - & - & - & - & - & - & - \tabularnewline
48 & 2.2 & - & - & - & - & - & - & - \tabularnewline
49 & 2.9 & - & - & - & - & - & - & - \tabularnewline
50 & 3.1 & 2.7191 & 2.0705 & 3.4558 & 0.1554 & 0.3151 & 0.9502 & 0.3151 \tabularnewline
51 & 3.5 & 3.096 & 2.139 & 4.2295 & 0.2424 & 0.4972 & 0.9921 & 0.6327 \tabularnewline
52 & 3.6 & 2.9383 & 1.8235 & 4.3177 & 0.1736 & 0.2124 & 0.9471 & 0.5217 \tabularnewline
53 & 4.4 & 3.1447 & 1.8314 & 4.8109 & 0.0699 & 0.2961 & 0.9432 & 0.6133 \tabularnewline
54 & 4.1 & 2.9018 & 1.5224 & 4.7223 & 0.0985 & 0.0534 & 0.8822 & 0.5008 \tabularnewline
55 & 5.1 & 3.2102 & 1.6314 & 5.3183 & 0.0395 & 0.204 & 0.9621 & 0.6135 \tabularnewline
56 & 5.8 & 3.305 & 1.5934 & 5.6341 & 0.0179 & 0.0655 & 0.9542 & 0.6334 \tabularnewline
57 & 5.9 & 3.3433 & 1.5238 & 5.8686 & 0.0236 & 0.0283 & 0.9436 & 0.6346 \tabularnewline
58 & 5.4 & 3.4718 & 1.5208 & 6.2168 & 0.0843 & 0.0415 & 0.9476 & 0.6585 \tabularnewline
59 & 5.5 & 3.4966 & 1.4539 & 6.4215 & 0.0897 & 0.1011 & 0.92 & 0.6553 \tabularnewline
60 & 4.8 & 2.9713 & 1.0551 & 5.8579 & 0.1072 & 0.043 & 0.6998 & 0.5193 \tabularnewline
61 & 3.2 & 2.3136 & 0.6297 & 5.0562 & 0.2632 & 0.0378 & 0.3376 & 0.3376 \tabularnewline
\hline
\end{tabular}
%Source: https://freestatistics.org/blog/index.php?pk=36187&T=1

[TABLE]
[ROW][C]Univariate ARIMA Extrapolation Forecast[/C][/ROW]
[ROW][C]time[/C][C]Y[t][/C][C]F[t][/C][C]95% LB[/C][C]95% UB[/C][C]p-value(H0: Y[t] = F[t])[/C][C]P(F[t]>Y[t-1])[/C][C]P(F[t]>Y[t-s])[/C][C]P(F[t]>Y[49])[/C][/ROW]
[ROW][C]37[/C][C]2[/C][C]-[/C][C]-[/C][C]-[/C][C]-[/C][C]-[/C][C]-[/C][C]-[/C][/ROW]
[ROW][C]38[/C][C]2.1[/C][C]-[/C][C]-[/C][C]-[/C][C]-[/C][C]-[/C][C]-[/C][C]-[/C][/ROW]
[ROW][C]39[/C][C]1.7[/C][C]-[/C][C]-[/C][C]-[/C][C]-[/C][C]-[/C][C]-[/C][C]-[/C][/ROW]
[ROW][C]40[/C][C]1.8[/C][C]-[/C][C]-[/C][C]-[/C][C]-[/C][C]-[/C][C]-[/C][C]-[/C][/ROW]
[ROW][C]41[/C][C]1.8[/C][C]-[/C][C]-[/C][C]-[/C][C]-[/C][C]-[/C][C]-[/C][C]-[/C][/ROW]
[ROW][C]42[/C][C]1.8[/C][C]-[/C][C]-[/C][C]-[/C][C]-[/C][C]-[/C][C]-[/C][C]-[/C][/ROW]
[ROW][C]43[/C][C]1.3[/C][C]-[/C][C]-[/C][C]-[/C][C]-[/C][C]-[/C][C]-[/C][C]-[/C][/ROW]
[ROW][C]44[/C][C]1.3[/C][C]-[/C][C]-[/C][C]-[/C][C]-[/C][C]-[/C][C]-[/C][C]-[/C][/ROW]
[ROW][C]45[/C][C]1.3[/C][C]-[/C][C]-[/C][C]-[/C][C]-[/C][C]-[/C][C]-[/C][C]-[/C][/ROW]
[ROW][C]46[/C][C]1.2[/C][C]-[/C][C]-[/C][C]-[/C][C]-[/C][C]-[/C][C]-[/C][C]-[/C][/ROW]
[ROW][C]47[/C][C]1.4[/C][C]-[/C][C]-[/C][C]-[/C][C]-[/C][C]-[/C][C]-[/C][C]-[/C][/ROW]
[ROW][C]48[/C][C]2.2[/C][C]-[/C][C]-[/C][C]-[/C][C]-[/C][C]-[/C][C]-[/C][C]-[/C][/ROW]
[ROW][C]49[/C][C]2.9[/C][C]-[/C][C]-[/C][C]-[/C][C]-[/C][C]-[/C][C]-[/C][C]-[/C][/ROW]
[ROW][C]50[/C][C]3.1[/C][C]2.7191[/C][C]2.0705[/C][C]3.4558[/C][C]0.1554[/C][C]0.3151[/C][C]0.9502[/C][C]0.3151[/C][/ROW]
[ROW][C]51[/C][C]3.5[/C][C]3.096[/C][C]2.139[/C][C]4.2295[/C][C]0.2424[/C][C]0.4972[/C][C]0.9921[/C][C]0.6327[/C][/ROW]
[ROW][C]52[/C][C]3.6[/C][C]2.9383[/C][C]1.8235[/C][C]4.3177[/C][C]0.1736[/C][C]0.2124[/C][C]0.9471[/C][C]0.5217[/C][/ROW]
[ROW][C]53[/C][C]4.4[/C][C]3.1447[/C][C]1.8314[/C][C]4.8109[/C][C]0.0699[/C][C]0.2961[/C][C]0.9432[/C][C]0.6133[/C][/ROW]
[ROW][C]54[/C][C]4.1[/C][C]2.9018[/C][C]1.5224[/C][C]4.7223[/C][C]0.0985[/C][C]0.0534[/C][C]0.8822[/C][C]0.5008[/C][/ROW]
[ROW][C]55[/C][C]5.1[/C][C]3.2102[/C][C]1.6314[/C][C]5.3183[/C][C]0.0395[/C][C]0.204[/C][C]0.9621[/C][C]0.6135[/C][/ROW]
[ROW][C]56[/C][C]5.8[/C][C]3.305[/C][C]1.5934[/C][C]5.6341[/C][C]0.0179[/C][C]0.0655[/C][C]0.9542[/C][C]0.6334[/C][/ROW]
[ROW][C]57[/C][C]5.9[/C][C]3.3433[/C][C]1.5238[/C][C]5.8686[/C][C]0.0236[/C][C]0.0283[/C][C]0.9436[/C][C]0.6346[/C][/ROW]
[ROW][C]58[/C][C]5.4[/C][C]3.4718[/C][C]1.5208[/C][C]6.2168[/C][C]0.0843[/C][C]0.0415[/C][C]0.9476[/C][C]0.6585[/C][/ROW]
[ROW][C]59[/C][C]5.5[/C][C]3.4966[/C][C]1.4539[/C][C]6.4215[/C][C]0.0897[/C][C]0.1011[/C][C]0.92[/C][C]0.6553[/C][/ROW]
[ROW][C]60[/C][C]4.8[/C][C]2.9713[/C][C]1.0551[/C][C]5.8579[/C][C]0.1072[/C][C]0.043[/C][C]0.6998[/C][C]0.5193[/C][/ROW]
[ROW][C]61[/C][C]3.2[/C][C]2.3136[/C][C]0.6297[/C][C]5.0562[/C][C]0.2632[/C][C]0.0378[/C][C]0.3376[/C][C]0.3376[/C][/ROW]
[/TABLE]
Source: https://freestatistics.org/blog/index.php?pk=36187&T=1

Globally Unique Identifier (entire table): ba.freestatistics.org/blog/index.php?pk=36187&T=1

As an alternative you can also use a QR Code:  

The GUIDs for individual cells are displayed in the table below:

Univariate ARIMA Extrapolation Forecast
timeY[t]F[t]95% LB95% UBp-value(H0: Y[t] = F[t])P(F[t]>Y[t-1])P(F[t]>Y[t-s])P(F[t]>Y[49])
372-------
382.1-------
391.7-------
401.8-------
411.8-------
421.8-------
431.3-------
441.3-------
451.3-------
461.2-------
471.4-------
482.2-------
492.9-------
503.12.71912.07053.45580.15540.31510.95020.3151
513.53.0962.1394.22950.24240.49720.99210.6327
523.62.93831.82354.31770.17360.21240.94710.5217
534.43.14471.83144.81090.06990.29610.94320.6133
544.12.90181.52244.72230.09850.05340.88220.5008
555.13.21021.63145.31830.03950.2040.96210.6135
565.83.3051.59345.63410.01790.06550.95420.6334
575.93.34331.52385.86860.02360.02830.94360.6346
585.43.47181.52086.21680.08430.04150.94760.6585
595.53.49661.45396.42150.08970.10110.920.6553
604.82.97131.05515.85790.10720.0430.69980.5193
613.22.31360.62975.05620.26320.03780.33760.3376


Univariate ARIMA Extrapolation Forecast Performance
time% S.E.PEMAPESq.EMSERMSE
500.13820.14010.01170.14510.01210.11
510.18680.13050.01090.16320.01360.1166
520.23950.22520.01880.43790.03650.191
530.27030.39920.03331.57580.13130.3624
540.32010.41290.03441.43570.11960.3459
550.33510.58870.04913.57140.29760.5455
560.35960.75490.06296.22520.51880.7203
570.38540.76470.06376.53660.54470.7381
580.40340.55540.04633.71780.30980.5566
590.42680.5730.04774.01360.33450.5783
600.49570.61550.05133.34420.27870.5279
610.60480.38310.03190.78570.06550.2559

\begin{tabular}{lllllllll}
\hline
Univariate ARIMA Extrapolation Forecast Performance \tabularnewline
time & % S.E. & PE & MAPE & Sq.E & MSE & RMSE \tabularnewline
50 & 0.1382 & 0.1401 & 0.0117 & 0.1451 & 0.0121 & 0.11 \tabularnewline
51 & 0.1868 & 0.1305 & 0.0109 & 0.1632 & 0.0136 & 0.1166 \tabularnewline
52 & 0.2395 & 0.2252 & 0.0188 & 0.4379 & 0.0365 & 0.191 \tabularnewline
53 & 0.2703 & 0.3992 & 0.0333 & 1.5758 & 0.1313 & 0.3624 \tabularnewline
54 & 0.3201 & 0.4129 & 0.0344 & 1.4357 & 0.1196 & 0.3459 \tabularnewline
55 & 0.3351 & 0.5887 & 0.0491 & 3.5714 & 0.2976 & 0.5455 \tabularnewline
56 & 0.3596 & 0.7549 & 0.0629 & 6.2252 & 0.5188 & 0.7203 \tabularnewline
57 & 0.3854 & 0.7647 & 0.0637 & 6.5366 & 0.5447 & 0.7381 \tabularnewline
58 & 0.4034 & 0.5554 & 0.0463 & 3.7178 & 0.3098 & 0.5566 \tabularnewline
59 & 0.4268 & 0.573 & 0.0477 & 4.0136 & 0.3345 & 0.5783 \tabularnewline
60 & 0.4957 & 0.6155 & 0.0513 & 3.3442 & 0.2787 & 0.5279 \tabularnewline
61 & 0.6048 & 0.3831 & 0.0319 & 0.7857 & 0.0655 & 0.2559 \tabularnewline
\hline
\end{tabular}
%Source: https://freestatistics.org/blog/index.php?pk=36187&T=2

[TABLE]
[ROW][C]Univariate ARIMA Extrapolation Forecast Performance[/C][/ROW]
[ROW][C]time[/C][C]% S.E.[/C][C]PE[/C][C]MAPE[/C][C]Sq.E[/C][C]MSE[/C][C]RMSE[/C][/ROW]
[ROW][C]50[/C][C]0.1382[/C][C]0.1401[/C][C]0.0117[/C][C]0.1451[/C][C]0.0121[/C][C]0.11[/C][/ROW]
[ROW][C]51[/C][C]0.1868[/C][C]0.1305[/C][C]0.0109[/C][C]0.1632[/C][C]0.0136[/C][C]0.1166[/C][/ROW]
[ROW][C]52[/C][C]0.2395[/C][C]0.2252[/C][C]0.0188[/C][C]0.4379[/C][C]0.0365[/C][C]0.191[/C][/ROW]
[ROW][C]53[/C][C]0.2703[/C][C]0.3992[/C][C]0.0333[/C][C]1.5758[/C][C]0.1313[/C][C]0.3624[/C][/ROW]
[ROW][C]54[/C][C]0.3201[/C][C]0.4129[/C][C]0.0344[/C][C]1.4357[/C][C]0.1196[/C][C]0.3459[/C][/ROW]
[ROW][C]55[/C][C]0.3351[/C][C]0.5887[/C][C]0.0491[/C][C]3.5714[/C][C]0.2976[/C][C]0.5455[/C][/ROW]
[ROW][C]56[/C][C]0.3596[/C][C]0.7549[/C][C]0.0629[/C][C]6.2252[/C][C]0.5188[/C][C]0.7203[/C][/ROW]
[ROW][C]57[/C][C]0.3854[/C][C]0.7647[/C][C]0.0637[/C][C]6.5366[/C][C]0.5447[/C][C]0.7381[/C][/ROW]
[ROW][C]58[/C][C]0.4034[/C][C]0.5554[/C][C]0.0463[/C][C]3.7178[/C][C]0.3098[/C][C]0.5566[/C][/ROW]
[ROW][C]59[/C][C]0.4268[/C][C]0.573[/C][C]0.0477[/C][C]4.0136[/C][C]0.3345[/C][C]0.5783[/C][/ROW]
[ROW][C]60[/C][C]0.4957[/C][C]0.6155[/C][C]0.0513[/C][C]3.3442[/C][C]0.2787[/C][C]0.5279[/C][/ROW]
[ROW][C]61[/C][C]0.6048[/C][C]0.3831[/C][C]0.0319[/C][C]0.7857[/C][C]0.0655[/C][C]0.2559[/C][/ROW]
[/TABLE]
Source: https://freestatistics.org/blog/index.php?pk=36187&T=2

Globally Unique Identifier (entire table): ba.freestatistics.org/blog/index.php?pk=36187&T=2

As an alternative you can also use a QR Code:  

The GUIDs for individual cells are displayed in the table below:

Univariate ARIMA Extrapolation Forecast Performance
time% S.E.PEMAPESq.EMSERMSE
500.13820.14010.01170.14510.01210.11
510.18680.13050.01090.16320.01360.1166
520.23950.22520.01880.43790.03650.191
530.27030.39920.03331.57580.13130.3624
540.32010.41290.03441.43570.11960.3459
550.33510.58870.04913.57140.29760.5455
560.35960.75490.06296.22520.51880.7203
570.38540.76470.06376.53660.54470.7381
580.40340.55540.04633.71780.30980.5566
590.42680.5730.04774.01360.33450.5783
600.49570.61550.05133.34420.27870.5279
610.60480.38310.03190.78570.06550.2559


Parameters (Session):
par1 = 12 ; par2 = 0.5 ; par3 = 1 ; par4 = 0 ; par5 = 12 ; par6 = 0 ; par7 = 0 ; par8 = 0 ; par9 = 1 ; par10 = FALSE ;
Parameters (R input):
par1 = 12 ; par2 = 0.5 ; par3 = 1 ; par4 = 0 ; par5 = 12 ; par6 = 0 ; par7 = 0 ; par8 = 0 ; par9 = 1 ; par10 = FALSE ;
R code (references can be found in the software module):
par1 <- as.numeric(par1) #cut off periods
par2 <- as.numeric(par2) #lambda
par3 <- as.numeric(par3) #degree of non-seasonal differencing
par4 <- as.numeric(par4) #degree of seasonal differencing
par5 <- as.numeric(par5) #seasonal period
par6 <- as.numeric(par6) #p
par7 <- as.numeric(par7) #q
par8 <- as.numeric(par8) #P
par9 <- as.numeric(par9) #Q
if (par10 == 'TRUE') par10 <- TRUE
if (par10 == 'FALSE') par10 <- FALSE
if (par2 == 0) x <- log(x)
if (par2 != 0) x <- x^par2
lx <- length(x)
first <- lx - 2*par1
nx <- lx - par1
nx1 <- nx + 1
fx <- lx - nx
if (fx < 1) {
fx <- par5
nx1 <- lx + fx - 1
first <- lx - 2*fx
}
first <- 1
if (fx < 3) fx <- round(lx/10,0)
(arima.out <- arima(x[1:nx], order=c(par6,par3,par7), seasonal=list(order=c(par8,par4,par9), period=par5), include.mean=par10, method='ML'))
(forecast <- predict(arima.out,fx))
(lb <- forecast$pred - 1.96 * forecast$se)
(ub <- forecast$pred + 1.96 * forecast$se)
if (par2 == 0) {
x <- exp(x)
forecast$pred <- exp(forecast$pred)
lb <- exp(lb)
ub <- exp(ub)
}
if (par2 != 0) {
x <- x^(1/par2)
forecast$pred <- forecast$pred^(1/par2)
lb <- lb^(1/par2)
ub <- ub^(1/par2)
}
if (par2 < 0) {
olb <- lb
lb <- ub
ub <- olb
}
(actandfor <- c(x[1:nx], forecast$pred))
(perc.se <- (ub-forecast$pred)/1.96/forecast$pred)
bitmap(file='test1.png')
opar <- par(mar=c(4,4,2,2),las=1)
ylim <- c( min(x[first:nx],lb), max(x[first:nx],ub))
plot(x,ylim=ylim,type='n',xlim=c(first,lx))
usr <- par('usr')
rect(usr[1],usr[3],nx+1,usr[4],border=NA,col='lemonchiffon')
rect(nx1,usr[3],usr[2],usr[4],border=NA,col='lavender')
abline(h= (-3:3)*2 , col ='gray', lty =3)
polygon( c(nx1:lx,lx:nx1), c(lb,rev(ub)), col = 'orange', lty=2,border=NA)
lines(nx1:lx, lb , lty=2)
lines(nx1:lx, ub , lty=2)
lines(x, lwd=2)
lines(nx1:lx, forecast$pred , lwd=2 , col ='white')
box()
par(opar)
dev.off()
prob.dec <- array(NA, dim=fx)
prob.sdec <- array(NA, dim=fx)
prob.ldec <- array(NA, dim=fx)
prob.pval <- array(NA, dim=fx)
perf.pe <- array(0, dim=fx)
perf.mape <- array(0, dim=fx)
perf.se <- array(0, dim=fx)
perf.mse <- array(0, dim=fx)
perf.rmse <- array(0, dim=fx)
for (i in 1:fx) {
locSD <- (ub[i] - forecast$pred[i]) / 1.96
perf.pe[i] = (x[nx+i] - forecast$pred[i]) / forecast$pred[i]
perf.mape[i] = perf.mape[i] + abs(perf.pe[i])
perf.se[i] = (x[nx+i] - forecast$pred[i])^2
perf.mse[i] = perf.mse[i] + perf.se[i]
prob.dec[i] = pnorm((x[nx+i-1] - forecast$pred[i]) / locSD)
prob.sdec[i] = pnorm((x[nx+i-par5] - forecast$pred[i]) / locSD)
prob.ldec[i] = pnorm((x[nx] - forecast$pred[i]) / locSD)
prob.pval[i] = pnorm(abs(x[nx+i] - forecast$pred[i]) / locSD)
}
perf.mape = perf.mape / fx
perf.mse = perf.mse / fx
perf.rmse = sqrt(perf.mse)
bitmap(file='test2.png')
plot(forecast$pred, pch=19, type='b',main='ARIMA Extrapolation Forecast', ylab='Forecast and 95% CI', xlab='time',ylim=c(min(lb),max(ub)))
dum <- forecast$pred
dum[1:12] <- x[(nx+1):lx]
lines(dum, lty=1)
lines(ub,lty=3)
lines(lb,lty=3)
dev.off()
load(file='createtable')
a<-table.start()
a<-table.row.start(a)
a<-table.element(a,'Univariate ARIMA Extrapolation Forecast',9,TRUE)
a<-table.row.end(a)
a<-table.row.start(a)
a<-table.element(a,'time',1,header=TRUE)
a<-table.element(a,'Y[t]',1,header=TRUE)
a<-table.element(a,'F[t]',1,header=TRUE)
a<-table.element(a,'95% LB',1,header=TRUE)
a<-table.element(a,'95% UB',1,header=TRUE)
a<-table.element(a,'p-value
(H0: Y[t] = F[t])',1,header=TRUE)
a<-table.element(a,'P(F[t]>Y[t-1])',1,header=TRUE)
a<-table.element(a,'P(F[t]>Y[t-s])',1,header=TRUE)
mylab <- paste('P(F[t]>Y[',nx,sep='')
mylab <- paste(mylab,'])',sep='')
a<-table.element(a,mylab,1,header=TRUE)
a<-table.row.end(a)
for (i in (nx-par5):nx) {
a<-table.row.start(a)
a<-table.element(a,i,header=TRUE)
a<-table.element(a,x[i])
a<-table.element(a,'-')
a<-table.row.end(a)
}
for (i in 1:fx) {
a<-table.row.start(a)
a<-table.element(a,nx+i,header=TRUE)
a<-table.element(a,round(x[nx+i],4))
a<-table.element(a,round(forecast$pred[i],4))
a<-table.element(a,round(lb[i],4))
a<-table.element(a,round(ub[i],4))
a<-table.element(a,round((1-prob.pval[i]),4))
a<-table.element(a,round((1-prob.dec[i]),4))
a<-table.element(a,round((1-prob.sdec[i]),4))
a<-table.element(a,round((1-prob.ldec[i]),4))
a<-table.row.end(a)
}
a<-table.end(a)
table.save(a,file='mytable.tab')
a<-table.start()
a<-table.row.start(a)
a<-table.element(a,'Univariate ARIMA Extrapolation Forecast Performance',7,TRUE)
a<-table.row.end(a)
a<-table.row.start(a)
a<-table.element(a,'time',1,header=TRUE)
a<-table.element(a,'% S.E.',1,header=TRUE)
a<-table.element(a,'PE',1,header=TRUE)
a<-table.element(a,'MAPE',1,header=TRUE)
a<-table.element(a,'Sq.E',1,header=TRUE)
a<-table.element(a,'MSE',1,header=TRUE)
a<-table.element(a,'RMSE',1,header=TRUE)
a<-table.row.end(a)
for (i in 1:fx) {
a<-table.row.start(a)
a<-table.element(a,nx+i,header=TRUE)
a<-table.element(a,round(perc.se[i],4))
a<-table.element(a,round(perf.pe[i],4))
a<-table.element(a,round(perf.mape[i],4))
a<-table.element(a,round(perf.se[i],4))
a<-table.element(a,round(perf.mse[i],4))
a<-table.element(a,round(perf.rmse[i],4))
a<-table.row.end(a)
}
a<-table.end(a)
table.save(a,file='mytable1.tab')