Free Statistics

of Irreproducible Research!

Author's title

Author*The author of this computation has been verified*
R Software Modulerwasp_correlation.wasp
Title produced by softwarePearson Correlation
Date of computationMon, 22 Dec 2008 12:24:38 -0700
Cite this page as followsStatistical Computations at FreeStatistics.org, Office for Research Development and Education, URL https://freestatistics.org/blog/index.php?v=date/2008/Dec/22/t122997392678hj4za1exoe3zv.htm/, Retrieved Sun, 12 May 2024 12:56:25 +0000
Statistical Computations at FreeStatistics.org, Office for Research Development and Education, URL https://freestatistics.org/blog/index.php?pk=36185, Retrieved Sun, 12 May 2024 12:56:25 +0000
QR Codes:

Original text written by user:
IsPrivate?No (this computation is public)
User-defined keywords
Estimated Impact138
Family? (F = Feedback message, R = changed R code, M = changed R Module, P = changed Parameters, D = changed Data)
-     [Pearson Correlation] [Pearson Correlation] [2008-12-12 13:54:29] [76963dc1903f0f612b6153510a3818cf]
-    D  [Pearson Correlation] [Correlatie residu...] [2008-12-18 14:31:12] [76963dc1903f0f612b6153510a3818cf]
-           [Pearson Correlation] [Pearson Correlati...] [2008-12-22 19:24:38] [8758b22b4a10c08c31202f233362e983] [Current]
Feedback Forum

Post a new message
Dataseries X:
-1756.606034
4515.24258
6350.757752
187.6662664
7179.987129
-1766.376102
3341.770864
-6153.4031
20418.81063
5825.391929
-10079.64907
3756.072201
-1726.742767
7013.734425
10008.75491
-3889.520808
2853.072056
4867.000198
9517.403357
-19081.5299
2090.060331
7667.210345
18234.87677
4200.880538
1264.162256
2584.899596
1795.964144
6713.258676
-0.068849117
7108.528605
5387.158619
-6468.095299
2883.307014
-4432.345942
-1782.780676
6472.577676
1013.79339
2177.704119
2867.612346
-8285.22375
1348.880462
3408.921922
-8620.730165
2859.197602
4446.042697
9696.016672
1717.131294
-3150.034481
-11543.52083
884.4316352
1621.208212
-2631.418695
1761.402548
-2649.643223
-2776.023462
-7699.097349
-533.0422272
-11156.45315
595.2518785
-619.038755
-4126.313963
-1418.221331
-4510.069121
Dataseries Y:
9.251916481
22.28951742
-37.15509397
34.22187354
-175.779264
104.9707065
-61.23944789
-396.7006521
-396.4104855
-259.9810144
127.9713638
-36.01972185
204.1305246
44.23781198
-159.6936733
203.1240259
121.7477886
-16.20225966
-243.8846
391.6693185
-164.2219687
293.7998866
150.1830112
-191.0192529
251.8229631
-153.3772568
8.18066887
276.1462458
7.505698792
290.2551301
154.6986628
-344.4860962
-268.7252068
308.7804581
53.41379783
309.7151277
86.25318818
-34.86211092
196.5575758
226.4231797
-187.9949744
-58.58222587
209.148432
145.9303467
129.4478425
-33.08964353
-386.0328906
144.2386434
117.0703219
129.9208501
-152.2074543
-55.09481442
144.0193516
-16.89369247
144.6275477
-160.1503109
329.6155122
138.2292641
9.036902416
50.52401291
313.8066156
236.8949084
110.0260622


Summary of computational transaction
Raw Inputview raw input (R code)
Raw Outputview raw output of R engine
Computing time0 seconds
R Server'Gwilym Jenkins' @ 72.249.127.135

\begin{tabular}{lllllllll}
\hline
Summary of computational transaction \tabularnewline
Raw Input & view raw input (R code)  \tabularnewline
Raw Output & view raw output of R engine  \tabularnewline
Computing time & 0 seconds \tabularnewline
R Server & 'Gwilym Jenkins' @ 72.249.127.135 \tabularnewline
\hline
\end{tabular}
%Source: https://freestatistics.org/blog/index.php?pk=36185&T=0

[TABLE]
[ROW][C]Summary of computational transaction[/C][/ROW]
[ROW][C]Raw Input[/C][C]view raw input (R code) [/C][/ROW]
[ROW][C]Raw Output[/C][C]view raw output of R engine [/C][/ROW]
[ROW][C]Computing time[/C][C]0 seconds[/C][/ROW]
[ROW][C]R Server[/C][C]'Gwilym Jenkins' @ 72.249.127.135[/C][/ROW]
[/TABLE]
Source: https://freestatistics.org/blog/index.php?pk=36185&T=0

Globally Unique Identifier (entire table): ba.freestatistics.org/blog/index.php?pk=36185&T=0

As an alternative you can also use a QR Code:  

The GUIDs for individual cells are displayed in the table below:

Summary of computational transaction
Raw Inputview raw input (R code)
Raw Outputview raw output of R engine
Computing time0 seconds
R Server'Gwilym Jenkins' @ 72.249.127.135


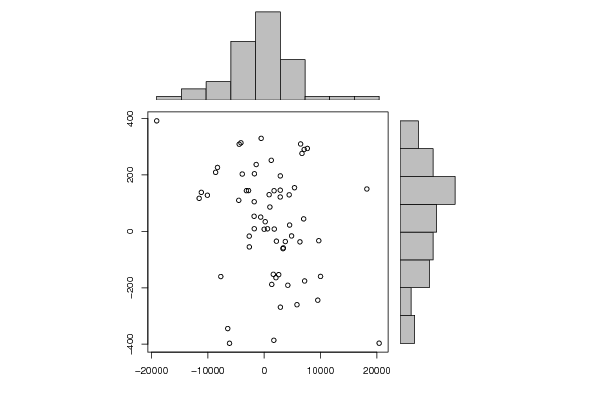
Pearson Product Moment Correlation - Ungrouped Data
StatisticVariable XVariable Y
Mean948.89197771084135.5568721291905
Biased Variance42642369.780896337264.0617889692
Biased Standard Deviation6530.1125396808193.039016234981
Covariance-355280.780933963
Correlation-0.277368471478871
Determination0.0769332689705252
T-Test-2.25478668456635
p-value (2 sided)0.027747554678161
p-value (1 sided)0.0138737773390805
Degrees of Freedom61
Number of Observations63

\begin{tabular}{lllllllll}
\hline
Pearson Product Moment Correlation - Ungrouped Data \tabularnewline
Statistic & Variable X & Variable Y \tabularnewline
Mean & 948.891977710841 & 35.5568721291905 \tabularnewline
Biased Variance & 42642369.7808963 & 37264.0617889692 \tabularnewline
Biased Standard Deviation & 6530.1125396808 & 193.039016234981 \tabularnewline
Covariance & -355280.780933963 \tabularnewline
Correlation & -0.277368471478871 \tabularnewline
Determination & 0.0769332689705252 \tabularnewline
T-Test & -2.25478668456635 \tabularnewline
p-value (2 sided) & 0.027747554678161 \tabularnewline
p-value (1 sided) & 0.0138737773390805 \tabularnewline
Degrees of Freedom & 61 \tabularnewline
Number of Observations & 63 \tabularnewline
\hline
\end{tabular}
%Source: https://freestatistics.org/blog/index.php?pk=36185&T=1

[TABLE]
[ROW][C]Pearson Product Moment Correlation - Ungrouped Data[/C][/ROW]
[ROW][C]Statistic[/C][C]Variable X[/C][C]Variable Y[/C][/ROW]
[ROW][C]Mean[/C][C]948.891977710841[/C][C]35.5568721291905[/C][/ROW]
[ROW][C]Biased Variance[/C][C]42642369.7808963[/C][C]37264.0617889692[/C][/ROW]
[ROW][C]Biased Standard Deviation[/C][C]6530.1125396808[/C][C]193.039016234981[/C][/ROW]
[ROW][C]Covariance[/C][C]-355280.780933963[/C][/ROW]
[ROW][C]Correlation[/C][C]-0.277368471478871[/C][/ROW]
[ROW][C]Determination[/C][C]0.0769332689705252[/C][/ROW]
[ROW][C]T-Test[/C][C]-2.25478668456635[/C][/ROW]
[ROW][C]p-value (2 sided)[/C][C]0.027747554678161[/C][/ROW]
[ROW][C]p-value (1 sided)[/C][C]0.0138737773390805[/C][/ROW]
[ROW][C]Degrees of Freedom[/C][C]61[/C][/ROW]
[ROW][C]Number of Observations[/C][C]63[/C][/ROW]
[/TABLE]
Source: https://freestatistics.org/blog/index.php?pk=36185&T=1

Globally Unique Identifier (entire table): ba.freestatistics.org/blog/index.php?pk=36185&T=1

As an alternative you can also use a QR Code:  

The GUIDs for individual cells are displayed in the table below:

Pearson Product Moment Correlation - Ungrouped Data
StatisticVariable XVariable Y
Mean948.89197771084135.5568721291905
Biased Variance42642369.780896337264.0617889692
Biased Standard Deviation6530.1125396808193.039016234981
Covariance-355280.780933963
Correlation-0.277368471478871
Determination0.0769332689705252
T-Test-2.25478668456635
p-value (2 sided)0.027747554678161
p-value (1 sided)0.0138737773390805
Degrees of Freedom61
Number of Observations63


Parameters (Session):
Parameters (R input):
par1 = ; par2 = ; par3 = ; par4 = ; par5 = ; par6 = ; par7 = ; par8 = ; par9 = ; par10 = ; par11 = ; par12 = ; par13 = ; par14 = ; par15 = ; par16 = ; par17 = ; par18 = ; par19 = ; par20 = ;
R code (references can be found in the software module):
bitmap(file='test1.png')
histx <- hist(x, plot=FALSE)
histy <- hist(y, plot=FALSE)
maxcounts <- max(c(histx$counts, histx$counts))
xrange <- c(min(x),max(x))
yrange <- c(min(y),max(y))
nf <- layout(matrix(c(2,0,1,3),2,2,byrow=TRUE), c(3,1), c(1,3), TRUE)
par(mar=c(4,4,1,1))
plot(x, y, xlim=xrange, ylim=yrange, xlab=xlab, ylab=ylab)
par(mar=c(0,4,1,1))
barplot(histx$counts, axes=FALSE, ylim=c(0, maxcounts), space=0)
par(mar=c(4,0,1,1))
barplot(histy$counts, axes=FALSE, xlim=c(0, maxcounts), space=0, horiz=TRUE)
dev.off()
lx = length(x)
makebiased = (lx-1)/lx
varx = var(x)*makebiased
vary = var(y)*makebiased
corxy <- cor.test(x,y,method='pearson')
cxy <- as.matrix(corxy$estimate)[1,1]
load(file='createtable')
a<-table.start()
a<-table.row.start(a)
a<-table.element(a,'Pearson Product Moment Correlation - Ungrouped Data',3,TRUE)
a<-table.row.end(a)
a<-table.row.start(a)
a<-table.element(a,'Statistic',1,TRUE)
a<-table.element(a,'Variable X',1,TRUE)
a<-table.element(a,'Variable Y',1,TRUE)
a<-table.row.end(a)
a<-table.row.start(a)
a<-table.element(a,hyperlink('arithmetic_mean.htm','Mean',''),header=TRUE)
a<-table.element(a,mean(x))
a<-table.element(a,mean(y))
a<-table.row.end(a)
a<-table.row.start(a)
a<-table.element(a,hyperlink('biased.htm','Biased Variance',''),header=TRUE)
a<-table.element(a,varx)
a<-table.element(a,vary)
a<-table.row.end(a)
a<-table.row.start(a)
a<-table.element(a,hyperlink('biased1.htm','Biased Standard Deviation',''),header=TRUE)
a<-table.element(a,sqrt(varx))
a<-table.element(a,sqrt(vary))
a<-table.row.end(a)
a<-table.row.start(a)
a<-table.element(a,hyperlink('covariance.htm','Covariance',''),header=TRUE)
a<-table.element(a,cov(x,y),2)
a<-table.row.end(a)
a<-table.row.start(a)
a<-table.element(a,hyperlink('pearson_correlation.htm','Correlation',''),header=TRUE)
a<-table.element(a,cxy,2)
a<-table.row.end(a)
a<-table.row.start(a)
a<-table.element(a,hyperlink('coeff_of_determination.htm','Determination',''),header=TRUE)
a<-table.element(a,cxy*cxy,2)
a<-table.row.end(a)
a<-table.row.start(a)
a<-table.element(a,hyperlink('ttest_statistic.htm','T-Test',''),header=TRUE)
a<-table.element(a,as.matrix(corxy$statistic)[1,1],2)
a<-table.row.end(a)
a<-table.row.start(a)
a<-table.element(a,'p-value (2 sided)',header=TRUE)
a<-table.element(a,(p2 <- as.matrix(corxy$p.value)[1,1]),2)
a<-table.row.end(a)
a<-table.row.start(a)
a<-table.element(a,'p-value (1 sided)',header=TRUE)
a<-table.element(a,p2/2,2)
a<-table.row.end(a)
a<-table.row.start(a)
a<-table.element(a,'Degrees of Freedom',header=TRUE)
a<-table.element(a,lx-2,2)
a<-table.row.end(a)
a<-table.row.start(a)
a<-table.element(a,'Number of Observations',header=TRUE)
a<-table.element(a,lx,2)
a<-table.row.end(a)
a<-table.end(a)
table.save(a,file='mytable.tab')