Free Statistics

of Irreproducible Research!

Author's title

Author*Unverified author*
R Software Modulerwasp_autocorrelation.wasp
Title produced by software(Partial) Autocorrelation Function
Date of computationMon, 22 Dec 2008 08:22:12 -0700
Cite this page as followsStatistical Computations at FreeStatistics.org, Office for Research Development and Education, URL https://freestatistics.org/blog/index.php?v=date/2008/Dec/22/t1229959446v5d4zd3ts1y0p7f.htm/, Retrieved Sun, 12 May 2024 19:31:26 +0000
Statistical Computations at FreeStatistics.org, Office for Research Development and Education, URL https://freestatistics.org/blog/index.php?pk=36100, Retrieved Sun, 12 May 2024 19:31:26 +0000
QR Codes:

Original text written by user:
IsPrivate?No (this computation is public)
User-defined keywords
Estimated Impact161
Family? (F = Feedback message, R = changed R code, M = changed R Module, P = changed Parameters, D = changed Data)
-       [(Partial) Autocorrelation Function] [] [2008-12-22 15:22:12] [d41d8cd98f00b204e9800998ecf8427e] [Current]
Feedback Forum

Post a new message
Dataseries X:
9.2
9.1
9.1
9.1
9.1
9.2
9.3
9.3
9.3
9.3
9.3
9.4
9.4
9.4
9.5
9.5
9.4
9.4
9.3
9.4
9.4
9.2
9.1
9.1
9.1
9.1
9
8.9
8.8
8.7
8.5
8.3
8.1
7.8
7.6
7.5
7.4
7.3
7.1
6.9
6.8
6.8
6.8
6.9
6.7
6.6
6.5
6.4
6.3
6.3
6.3
6.5
6.6
6.5
6.4
6.5
6.7
7.1
7.1
7.2
7.2
7.3
7.3
7.3
7.4
7.4
7.6
7.6
7.6
7.7
7.8
7.9
8.1
8.1
8.1
8.2
8.2
8.2
8.2
8.2
8.2
8.3
8.3
8.4
8.4
8.4
8.3
8
8
8.2
8.6
8.7
8.7
8.5
8.4
8.4
8.4
8.5
8.5
8.5
8.5
8.5
8.4
8.4
8.4
8.5
8.5
8.6
8.6
8.6
8.5
8.4
8.4
8.3
8.2
8.1
8.2
8.1
8
7.9
7.8
7.7
7.7
7.9
7.8
7.6
7.4
7.3
7.1
7.1
7
7


Summary of computational transaction
Raw Inputview raw input (R code)
Raw Outputview raw output of R engine
Computing time7 seconds
R Server'George Udny Yule' @ 72.249.76.132

\begin{tabular}{lllllllll}
\hline
Summary of computational transaction \tabularnewline
Raw Input & view raw input (R code)  \tabularnewline
Raw Output & view raw output of R engine  \tabularnewline
Computing time & 7 seconds \tabularnewline
R Server & 'George Udny Yule' @ 72.249.76.132 \tabularnewline
\hline
\end{tabular}
%Source: https://freestatistics.org/blog/index.php?pk=36100&T=0

[TABLE]
[ROW][C]Summary of computational transaction[/C][/ROW]
[ROW][C]Raw Input[/C][C]view raw input (R code) [/C][/ROW]
[ROW][C]Raw Output[/C][C]view raw output of R engine [/C][/ROW]
[ROW][C]Computing time[/C][C]7 seconds[/C][/ROW]
[ROW][C]R Server[/C][C]'George Udny Yule' @ 72.249.76.132[/C][/ROW]
[/TABLE]
Source: https://freestatistics.org/blog/index.php?pk=36100&T=0

Globally Unique Identifier (entire table): ba.freestatistics.org/blog/index.php?pk=36100&T=0

As an alternative you can also use a QR Code:  

The GUIDs for individual cells are displayed in the table below:

Summary of computational transaction
Raw Inputview raw input (R code)
Raw Outputview raw output of R engine
Computing time7 seconds
R Server'George Udny Yule' @ 72.249.76.132


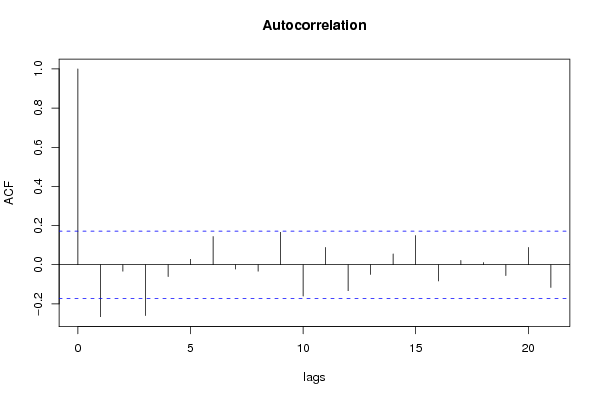
Autocorrelation Function
Time lag kACF(k)T-STATP-value
1-0.265162-3.02330.001506
2-0.033151-0.3780.35303
3-0.259596-2.95980.001829
4-0.060692-0.6920.245086
50.0277510.31640.376098
60.1437361.63880.051833
7-0.02206-0.25150.400903
8-0.033238-0.3790.352663
90.165751.88980.030503
10-0.160146-1.82590.035077
110.088441.00840.157574
12-0.132564-1.51150.066549
13-0.049645-0.5660.286171
140.0552890.63040.264773
150.1490881.69990.045774
16-0.082839-0.94450.17333
170.0220950.25190.40075
180.0111290.12690.44961
19-0.055257-0.630.264891
200.0883531.00740.157813
21-0.116034-1.3230.094081

\begin{tabular}{lllllllll}
\hline
Autocorrelation Function \tabularnewline
Time lag k & ACF(k) & T-STAT & P-value \tabularnewline
1 & -0.265162 & -3.0233 & 0.001506 \tabularnewline
2 & -0.033151 & -0.378 & 0.35303 \tabularnewline
3 & -0.259596 & -2.9598 & 0.001829 \tabularnewline
4 & -0.060692 & -0.692 & 0.245086 \tabularnewline
5 & 0.027751 & 0.3164 & 0.376098 \tabularnewline
6 & 0.143736 & 1.6388 & 0.051833 \tabularnewline
7 & -0.02206 & -0.2515 & 0.400903 \tabularnewline
8 & -0.033238 & -0.379 & 0.352663 \tabularnewline
9 & 0.16575 & 1.8898 & 0.030503 \tabularnewline
10 & -0.160146 & -1.8259 & 0.035077 \tabularnewline
11 & 0.08844 & 1.0084 & 0.157574 \tabularnewline
12 & -0.132564 & -1.5115 & 0.066549 \tabularnewline
13 & -0.049645 & -0.566 & 0.286171 \tabularnewline
14 & 0.055289 & 0.6304 & 0.264773 \tabularnewline
15 & 0.149088 & 1.6999 & 0.045774 \tabularnewline
16 & -0.082839 & -0.9445 & 0.17333 \tabularnewline
17 & 0.022095 & 0.2519 & 0.40075 \tabularnewline
18 & 0.011129 & 0.1269 & 0.44961 \tabularnewline
19 & -0.055257 & -0.63 & 0.264891 \tabularnewline
20 & 0.088353 & 1.0074 & 0.157813 \tabularnewline
21 & -0.116034 & -1.323 & 0.094081 \tabularnewline
\hline
\end{tabular}
%Source: https://freestatistics.org/blog/index.php?pk=36100&T=1

[TABLE]
[ROW][C]Autocorrelation Function[/C][/ROW]
[ROW][C]Time lag k[/C][C]ACF(k)[/C][C]T-STAT[/C][C]P-value[/C][/ROW]
[ROW][C]1[/C][C]-0.265162[/C][C]-3.0233[/C][C]0.001506[/C][/ROW]
[ROW][C]2[/C][C]-0.033151[/C][C]-0.378[/C][C]0.35303[/C][/ROW]
[ROW][C]3[/C][C]-0.259596[/C][C]-2.9598[/C][C]0.001829[/C][/ROW]
[ROW][C]4[/C][C]-0.060692[/C][C]-0.692[/C][C]0.245086[/C][/ROW]
[ROW][C]5[/C][C]0.027751[/C][C]0.3164[/C][C]0.376098[/C][/ROW]
[ROW][C]6[/C][C]0.143736[/C][C]1.6388[/C][C]0.051833[/C][/ROW]
[ROW][C]7[/C][C]-0.02206[/C][C]-0.2515[/C][C]0.400903[/C][/ROW]
[ROW][C]8[/C][C]-0.033238[/C][C]-0.379[/C][C]0.352663[/C][/ROW]
[ROW][C]9[/C][C]0.16575[/C][C]1.8898[/C][C]0.030503[/C][/ROW]
[ROW][C]10[/C][C]-0.160146[/C][C]-1.8259[/C][C]0.035077[/C][/ROW]
[ROW][C]11[/C][C]0.08844[/C][C]1.0084[/C][C]0.157574[/C][/ROW]
[ROW][C]12[/C][C]-0.132564[/C][C]-1.5115[/C][C]0.066549[/C][/ROW]
[ROW][C]13[/C][C]-0.049645[/C][C]-0.566[/C][C]0.286171[/C][/ROW]
[ROW][C]14[/C][C]0.055289[/C][C]0.6304[/C][C]0.264773[/C][/ROW]
[ROW][C]15[/C][C]0.149088[/C][C]1.6999[/C][C]0.045774[/C][/ROW]
[ROW][C]16[/C][C]-0.082839[/C][C]-0.9445[/C][C]0.17333[/C][/ROW]
[ROW][C]17[/C][C]0.022095[/C][C]0.2519[/C][C]0.40075[/C][/ROW]
[ROW][C]18[/C][C]0.011129[/C][C]0.1269[/C][C]0.44961[/C][/ROW]
[ROW][C]19[/C][C]-0.055257[/C][C]-0.63[/C][C]0.264891[/C][/ROW]
[ROW][C]20[/C][C]0.088353[/C][C]1.0074[/C][C]0.157813[/C][/ROW]
[ROW][C]21[/C][C]-0.116034[/C][C]-1.323[/C][C]0.094081[/C][/ROW]
[/TABLE]
Source: https://freestatistics.org/blog/index.php?pk=36100&T=1

Globally Unique Identifier (entire table): ba.freestatistics.org/blog/index.php?pk=36100&T=1

As an alternative you can also use a QR Code:  

The GUIDs for individual cells are displayed in the table below:

Autocorrelation Function
Time lag kACF(k)T-STATP-value
1-0.265162-3.02330.001506
2-0.033151-0.3780.35303
3-0.259596-2.95980.001829
4-0.060692-0.6920.245086
50.0277510.31640.376098
60.1437361.63880.051833
7-0.02206-0.25150.400903
8-0.033238-0.3790.352663
90.165751.88980.030503
10-0.160146-1.82590.035077
110.088441.00840.157574
12-0.132564-1.51150.066549
13-0.049645-0.5660.286171
140.0552890.63040.264773
150.1490881.69990.045774
16-0.082839-0.94450.17333
170.0220950.25190.40075
180.0111290.12690.44961
19-0.055257-0.630.264891
200.0883531.00740.157813
21-0.116034-1.3230.094081


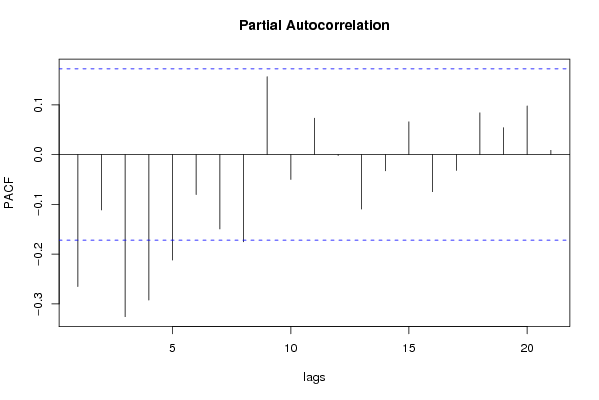
Partial Autocorrelation Function
Time lag kPACF(k)T-STATP-value
1-0.265162-3.02330.001506
2-0.111287-1.26890.103378
3-0.325508-3.71140.000152
4-0.29209-3.33030.000565
5-0.211825-2.41520.008559
6-0.080257-0.91510.180924
7-0.149353-1.70290.045489
8-0.17517-1.99720.023943
90.1563011.78210.038533
10-0.04997-0.56970.284918
110.0731490.8340.202899
12-0.002047-0.02330.490707
13-0.109385-1.24720.107286
14-0.03275-0.37340.354728
150.0657080.74920.22755
16-0.074538-0.84990.198481
17-0.031927-0.3640.358214
180.0839390.95710.170157
190.054020.61590.269511
200.0976371.11320.13383
210.008390.09570.461967

\begin{tabular}{lllllllll}
\hline
Partial Autocorrelation Function \tabularnewline
Time lag k & PACF(k) & T-STAT & P-value \tabularnewline
1 & -0.265162 & -3.0233 & 0.001506 \tabularnewline
2 & -0.111287 & -1.2689 & 0.103378 \tabularnewline
3 & -0.325508 & -3.7114 & 0.000152 \tabularnewline
4 & -0.29209 & -3.3303 & 0.000565 \tabularnewline
5 & -0.211825 & -2.4152 & 0.008559 \tabularnewline
6 & -0.080257 & -0.9151 & 0.180924 \tabularnewline
7 & -0.149353 & -1.7029 & 0.045489 \tabularnewline
8 & -0.17517 & -1.9972 & 0.023943 \tabularnewline
9 & 0.156301 & 1.7821 & 0.038533 \tabularnewline
10 & -0.04997 & -0.5697 & 0.284918 \tabularnewline
11 & 0.073149 & 0.834 & 0.202899 \tabularnewline
12 & -0.002047 & -0.0233 & 0.490707 \tabularnewline
13 & -0.109385 & -1.2472 & 0.107286 \tabularnewline
14 & -0.03275 & -0.3734 & 0.354728 \tabularnewline
15 & 0.065708 & 0.7492 & 0.22755 \tabularnewline
16 & -0.074538 & -0.8499 & 0.198481 \tabularnewline
17 & -0.031927 & -0.364 & 0.358214 \tabularnewline
18 & 0.083939 & 0.9571 & 0.170157 \tabularnewline
19 & 0.05402 & 0.6159 & 0.269511 \tabularnewline
20 & 0.097637 & 1.1132 & 0.13383 \tabularnewline
21 & 0.00839 & 0.0957 & 0.461967 \tabularnewline
\hline
\end{tabular}
%Source: https://freestatistics.org/blog/index.php?pk=36100&T=2

[TABLE]
[ROW][C]Partial Autocorrelation Function[/C][/ROW]
[ROW][C]Time lag k[/C][C]PACF(k)[/C][C]T-STAT[/C][C]P-value[/C][/ROW]
[ROW][C]1[/C][C]-0.265162[/C][C]-3.0233[/C][C]0.001506[/C][/ROW]
[ROW][C]2[/C][C]-0.111287[/C][C]-1.2689[/C][C]0.103378[/C][/ROW]
[ROW][C]3[/C][C]-0.325508[/C][C]-3.7114[/C][C]0.000152[/C][/ROW]
[ROW][C]4[/C][C]-0.29209[/C][C]-3.3303[/C][C]0.000565[/C][/ROW]
[ROW][C]5[/C][C]-0.211825[/C][C]-2.4152[/C][C]0.008559[/C][/ROW]
[ROW][C]6[/C][C]-0.080257[/C][C]-0.9151[/C][C]0.180924[/C][/ROW]
[ROW][C]7[/C][C]-0.149353[/C][C]-1.7029[/C][C]0.045489[/C][/ROW]
[ROW][C]8[/C][C]-0.17517[/C][C]-1.9972[/C][C]0.023943[/C][/ROW]
[ROW][C]9[/C][C]0.156301[/C][C]1.7821[/C][C]0.038533[/C][/ROW]
[ROW][C]10[/C][C]-0.04997[/C][C]-0.5697[/C][C]0.284918[/C][/ROW]
[ROW][C]11[/C][C]0.073149[/C][C]0.834[/C][C]0.202899[/C][/ROW]
[ROW][C]12[/C][C]-0.002047[/C][C]-0.0233[/C][C]0.490707[/C][/ROW]
[ROW][C]13[/C][C]-0.109385[/C][C]-1.2472[/C][C]0.107286[/C][/ROW]
[ROW][C]14[/C][C]-0.03275[/C][C]-0.3734[/C][C]0.354728[/C][/ROW]
[ROW][C]15[/C][C]0.065708[/C][C]0.7492[/C][C]0.22755[/C][/ROW]
[ROW][C]16[/C][C]-0.074538[/C][C]-0.8499[/C][C]0.198481[/C][/ROW]
[ROW][C]17[/C][C]-0.031927[/C][C]-0.364[/C][C]0.358214[/C][/ROW]
[ROW][C]18[/C][C]0.083939[/C][C]0.9571[/C][C]0.170157[/C][/ROW]
[ROW][C]19[/C][C]0.05402[/C][C]0.6159[/C][C]0.269511[/C][/ROW]
[ROW][C]20[/C][C]0.097637[/C][C]1.1132[/C][C]0.13383[/C][/ROW]
[ROW][C]21[/C][C]0.00839[/C][C]0.0957[/C][C]0.461967[/C][/ROW]
[/TABLE]
Source: https://freestatistics.org/blog/index.php?pk=36100&T=2

Globally Unique Identifier (entire table): ba.freestatistics.org/blog/index.php?pk=36100&T=2

As an alternative you can also use a QR Code:  

The GUIDs for individual cells are displayed in the table below:

Partial Autocorrelation Function
Time lag kPACF(k)T-STATP-value
1-0.265162-3.02330.001506
2-0.111287-1.26890.103378
3-0.325508-3.71140.000152
4-0.29209-3.33030.000565
5-0.211825-2.41520.008559
6-0.080257-0.91510.180924
7-0.149353-1.70290.045489
8-0.17517-1.99720.023943
90.1563011.78210.038533
10-0.04997-0.56970.284918
110.0731490.8340.202899
12-0.002047-0.02330.490707
13-0.109385-1.24720.107286
14-0.03275-0.37340.354728
150.0657080.74920.22755
16-0.074538-0.84990.198481
17-0.031927-0.3640.358214
180.0839390.95710.170157
190.054020.61590.269511
200.0976371.11320.13383
210.008390.09570.461967


Parameters (Session):
par1 = Default ; par2 = 1 ; par3 = 2 ; par4 = 0 ; par5 = 12 ;
Parameters (R input):
par1 = Default ; par2 = 1 ; par3 = 2 ; par4 = 0 ; par5 = 12 ;
R code (references can be found in the software module):
if (par1 == 'Default') {
par1 = 10*log10(length(x))
} else {
par1 <- as.numeric(par1)
}
par2 <- as.numeric(par2)
par3 <- as.numeric(par3)
par4 <- as.numeric(par4)
par5 <- as.numeric(par5)
if (par2 == 0) {
x <- log(x)
} else {
x <- (x ^ par2 - 1) / par2
}
if (par3 > 0) x <- diff(x,lag=1,difference=par3)
if (par4 > 0) x <- diff(x,lag=par5,difference=par4)
bitmap(file='pic1.png')
racf <- acf(x,par1,main='Autocorrelation',xlab='lags',ylab='ACF')
dev.off()
bitmap(file='pic2.png')
rpacf <- pacf(x,par1,main='Partial Autocorrelation',xlab='lags',ylab='PACF')
dev.off()
(myacf <- c(racf$acf))
(mypacf <- c(rpacf$acf))
lengthx <- length(x)
sqrtn <- sqrt(lengthx)
load(file='createtable')
a<-table.start()
a<-table.row.start(a)
a<-table.element(a,'Autocorrelation Function',4,TRUE)
a<-table.row.end(a)
a<-table.row.start(a)
a<-table.element(a,'Time lag k',header=TRUE)
a<-table.element(a,hyperlink('basics.htm','ACF(k)','click here for more information about the Autocorrelation Function'),header=TRUE)
a<-table.element(a,'T-STAT',header=TRUE)
a<-table.element(a,'P-value',header=TRUE)
a<-table.row.end(a)
for (i in 2:(par1+1)) {
a<-table.row.start(a)
a<-table.element(a,i-1,header=TRUE)
a<-table.element(a,round(myacf[i],6))
mytstat <- myacf[i]*sqrtn
a<-table.element(a,round(mytstat,4))
a<-table.element(a,round(1-pt(abs(mytstat),lengthx),6))
a<-table.row.end(a)
}
a<-table.end(a)
table.save(a,file='mytable.tab')
a<-table.start()
a<-table.row.start(a)
a<-table.element(a,'Partial Autocorrelation Function',4,TRUE)
a<-table.row.end(a)
a<-table.row.start(a)
a<-table.element(a,'Time lag k',header=TRUE)
a<-table.element(a,hyperlink('basics.htm','PACF(k)','click here for more information about the Partial Autocorrelation Function'),header=TRUE)
a<-table.element(a,'T-STAT',header=TRUE)
a<-table.element(a,'P-value',header=TRUE)
a<-table.row.end(a)
for (i in 1:par1) {
a<-table.row.start(a)
a<-table.element(a,i,header=TRUE)
a<-table.element(a,round(mypacf[i],6))
mytstat <- mypacf[i]*sqrtn
a<-table.element(a,round(mytstat,4))
a<-table.element(a,round(1-pt(abs(mytstat),lengthx),6))
a<-table.row.end(a)
}
a<-table.end(a)
table.save(a,file='mytable1.tab')