Free Statistics

of Irreproducible Research!

Author's title

Author*Unverified author*
R Software Modulerwasp_autocorrelation.wasp
Title produced by software(Partial) Autocorrelation Function
Date of computationMon, 22 Dec 2008 08:14:47 -0700
Cite this page as followsStatistical Computations at FreeStatistics.org, Office for Research Development and Education, URL https://freestatistics.org/blog/index.php?v=date/2008/Dec/22/t12299592853mvweuu269hai62.htm/, Retrieved Mon, 13 May 2024 12:23:11 +0000
Statistical Computations at FreeStatistics.org, Office for Research Development and Education, URL https://freestatistics.org/blog/index.php?pk=36098, Retrieved Mon, 13 May 2024 12:23:11 +0000
QR Codes:

Original text written by user:
IsPrivate?No (this computation is public)
User-defined keywords
Estimated Impact157
Family? (F = Feedback message, R = changed R code, M = changed R Module, P = changed Parameters, D = changed Data)
-       [(Partial) Autocorrelation Function] [] [2008-12-22 15:14:47] [d41d8cd98f00b204e9800998ecf8427e] [Current]
Feedback Forum

Post a new message
Dataseries X:
9.2
9.1
9.1
9.1
9.1
9.2
9.3
9.3
9.3
9.3
9.3
9.4
9.4
9.4
9.5
9.5
9.4
9.4
9.3
9.4
9.4
9.2
9.1
9.1
9.1
9.1
9
8.9
8.8
8.7
8.5
8.3
8.1
7.8
7.6
7.5
7.4
7.3
7.1
6.9
6.8
6.8
6.8
6.9
6.7
6.6
6.5
6.4
6.3
6.3
6.3
6.5
6.6
6.5
6.4
6.5
6.7
7.1
7.1
7.2
7.2
7.3
7.3
7.3
7.4
7.4
7.6
7.6
7.6
7.7
7.8
7.9
8.1
8.1
8.1
8.2
8.2
8.2
8.2
8.2
8.2
8.3
8.3
8.4
8.4
8.4
8.3
8
8
8.2
8.6
8.7
8.7
8.5
8.4
8.4
8.4
8.5
8.5
8.5
8.5
8.5
8.4
8.4
8.4
8.5
8.5
8.6
8.6
8.6
8.5
8.4
8.4
8.3
8.2
8.1
8.2
8.1
8
7.9
7.8
7.7
7.7
7.9
7.8
7.6
7.4
7.3
7.1
7.1
7
7


Summary of computational transaction
Raw Inputview raw input (R code)
Raw Outputview raw output of R engine
Computing time2 seconds
R Server'Sir Ronald Aylmer Fisher' @ 193.190.124.24

\begin{tabular}{lllllllll}
\hline
Summary of computational transaction \tabularnewline
Raw Input & view raw input (R code)  \tabularnewline
Raw Output & view raw output of R engine  \tabularnewline
Computing time & 2 seconds \tabularnewline
R Server & 'Sir Ronald Aylmer Fisher' @ 193.190.124.24 \tabularnewline
\hline
\end{tabular}
%Source: https://freestatistics.org/blog/index.php?pk=36098&T=0

[TABLE]
[ROW][C]Summary of computational transaction[/C][/ROW]
[ROW][C]Raw Input[/C][C]view raw input (R code) [/C][/ROW]
[ROW][C]Raw Output[/C][C]view raw output of R engine [/C][/ROW]
[ROW][C]Computing time[/C][C]2 seconds[/C][/ROW]
[ROW][C]R Server[/C][C]'Sir Ronald Aylmer Fisher' @ 193.190.124.24[/C][/ROW]
[/TABLE]
Source: https://freestatistics.org/blog/index.php?pk=36098&T=0

Globally Unique Identifier (entire table): ba.freestatistics.org/blog/index.php?pk=36098&T=0

As an alternative you can also use a QR Code:  

The GUIDs for individual cells are displayed in the table below:

Summary of computational transaction
Raw Inputview raw input (R code)
Raw Outputview raw output of R engine
Computing time2 seconds
R Server'Sir Ronald Aylmer Fisher' @ 193.190.124.24


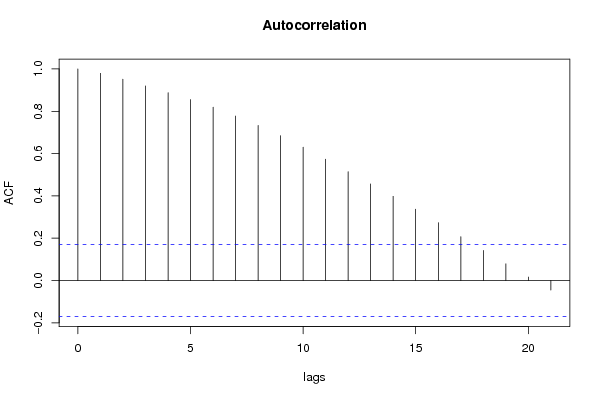
Autocorrelation Function
Time lag kACF(k)T-STATP-value
10.97934911.25190
20.95125410.92910
30.91978910.56760
40.8874410.19590
50.8552329.82590
60.8187429.40660
70.7772548.930
80.7327628.41880
90.6847037.86660
100.6298197.23610
110.5730666.5840
120.5142935.90880
130.456185.24110
140.3979414.5725e-06
150.3366983.86848.6e-05
160.2728713.13510.001059
170.2075272.38430.009267
180.1421551.63320.052401
190.0788480.90590.183321
200.016370.18810.425552
21-0.045125-0.51840.302509

\begin{tabular}{lllllllll}
\hline
Autocorrelation Function \tabularnewline
Time lag k & ACF(k) & T-STAT & P-value \tabularnewline
1 & 0.979349 & 11.2519 & 0 \tabularnewline
2 & 0.951254 & 10.9291 & 0 \tabularnewline
3 & 0.919789 & 10.5676 & 0 \tabularnewline
4 & 0.88744 & 10.1959 & 0 \tabularnewline
5 & 0.855232 & 9.8259 & 0 \tabularnewline
6 & 0.818742 & 9.4066 & 0 \tabularnewline
7 & 0.777254 & 8.93 & 0 \tabularnewline
8 & 0.732762 & 8.4188 & 0 \tabularnewline
9 & 0.684703 & 7.8666 & 0 \tabularnewline
10 & 0.629819 & 7.2361 & 0 \tabularnewline
11 & 0.573066 & 6.584 & 0 \tabularnewline
12 & 0.514293 & 5.9088 & 0 \tabularnewline
13 & 0.45618 & 5.2411 & 0 \tabularnewline
14 & 0.397941 & 4.572 & 5e-06 \tabularnewline
15 & 0.336698 & 3.8684 & 8.6e-05 \tabularnewline
16 & 0.272871 & 3.1351 & 0.001059 \tabularnewline
17 & 0.207527 & 2.3843 & 0.009267 \tabularnewline
18 & 0.142155 & 1.6332 & 0.052401 \tabularnewline
19 & 0.078848 & 0.9059 & 0.183321 \tabularnewline
20 & 0.01637 & 0.1881 & 0.425552 \tabularnewline
21 & -0.045125 & -0.5184 & 0.302509 \tabularnewline
\hline
\end{tabular}
%Source: https://freestatistics.org/blog/index.php?pk=36098&T=1

[TABLE]
[ROW][C]Autocorrelation Function[/C][/ROW]
[ROW][C]Time lag k[/C][C]ACF(k)[/C][C]T-STAT[/C][C]P-value[/C][/ROW]
[ROW][C]1[/C][C]0.979349[/C][C]11.2519[/C][C]0[/C][/ROW]
[ROW][C]2[/C][C]0.951254[/C][C]10.9291[/C][C]0[/C][/ROW]
[ROW][C]3[/C][C]0.919789[/C][C]10.5676[/C][C]0[/C][/ROW]
[ROW][C]4[/C][C]0.88744[/C][C]10.1959[/C][C]0[/C][/ROW]
[ROW][C]5[/C][C]0.855232[/C][C]9.8259[/C][C]0[/C][/ROW]
[ROW][C]6[/C][C]0.818742[/C][C]9.4066[/C][C]0[/C][/ROW]
[ROW][C]7[/C][C]0.777254[/C][C]8.93[/C][C]0[/C][/ROW]
[ROW][C]8[/C][C]0.732762[/C][C]8.4188[/C][C]0[/C][/ROW]
[ROW][C]9[/C][C]0.684703[/C][C]7.8666[/C][C]0[/C][/ROW]
[ROW][C]10[/C][C]0.629819[/C][C]7.2361[/C][C]0[/C][/ROW]
[ROW][C]11[/C][C]0.573066[/C][C]6.584[/C][C]0[/C][/ROW]
[ROW][C]12[/C][C]0.514293[/C][C]5.9088[/C][C]0[/C][/ROW]
[ROW][C]13[/C][C]0.45618[/C][C]5.2411[/C][C]0[/C][/ROW]
[ROW][C]14[/C][C]0.397941[/C][C]4.572[/C][C]5e-06[/C][/ROW]
[ROW][C]15[/C][C]0.336698[/C][C]3.8684[/C][C]8.6e-05[/C][/ROW]
[ROW][C]16[/C][C]0.272871[/C][C]3.1351[/C][C]0.001059[/C][/ROW]
[ROW][C]17[/C][C]0.207527[/C][C]2.3843[/C][C]0.009267[/C][/ROW]
[ROW][C]18[/C][C]0.142155[/C][C]1.6332[/C][C]0.052401[/C][/ROW]
[ROW][C]19[/C][C]0.078848[/C][C]0.9059[/C][C]0.183321[/C][/ROW]
[ROW][C]20[/C][C]0.01637[/C][C]0.1881[/C][C]0.425552[/C][/ROW]
[ROW][C]21[/C][C]-0.045125[/C][C]-0.5184[/C][C]0.302509[/C][/ROW]
[/TABLE]
Source: https://freestatistics.org/blog/index.php?pk=36098&T=1

Globally Unique Identifier (entire table): ba.freestatistics.org/blog/index.php?pk=36098&T=1

As an alternative you can also use a QR Code:  

The GUIDs for individual cells are displayed in the table below:

Autocorrelation Function
Time lag kACF(k)T-STATP-value
10.97934911.25190
20.95125410.92910
30.91978910.56760
40.8874410.19590
50.8552329.82590
60.8187429.40660
70.7772548.930
80.7327628.41880
90.6847037.86660
100.6298197.23610
110.5730666.5840
120.5142935.90880
130.456185.24110
140.3979414.5725e-06
150.3366983.86848.6e-05
160.2728713.13510.001059
170.2075272.38430.009267
180.1421551.63320.052401
190.0788480.90590.183321
200.016370.18810.425552
21-0.045125-0.51840.302509


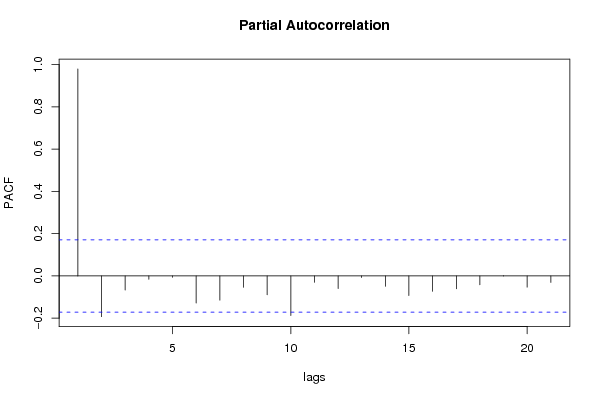
Partial Autocorrelation Function
Time lag kPACF(k)T-STATP-value
10.97934911.25190
2-0.192531-2.2120.014343
3-0.066783-0.76730.222142
4-0.015395-0.17690.429939
5-0.005871-0.06750.473161
6-0.128211-1.4730.071561
7-0.114455-1.3150.095397
8-0.053451-0.61410.2701
9-0.089388-1.0270.153152
10-0.18718-2.15050.016667
11-0.030324-0.34840.364049
12-0.059283-0.68110.248496
13-0.007415-0.08520.46612
14-0.04898-0.56270.287286
15-0.092911-1.06750.143855
16-0.072603-0.83410.202853
17-0.06038-0.69370.244542
18-0.041588-0.47780.316787
190.0014670.01690.493289
20-0.052995-0.60890.271831
21-0.03052-0.35070.363204

\begin{tabular}{lllllllll}
\hline
Partial Autocorrelation Function \tabularnewline
Time lag k & PACF(k) & T-STAT & P-value \tabularnewline
1 & 0.979349 & 11.2519 & 0 \tabularnewline
2 & -0.192531 & -2.212 & 0.014343 \tabularnewline
3 & -0.066783 & -0.7673 & 0.222142 \tabularnewline
4 & -0.015395 & -0.1769 & 0.429939 \tabularnewline
5 & -0.005871 & -0.0675 & 0.473161 \tabularnewline
6 & -0.128211 & -1.473 & 0.071561 \tabularnewline
7 & -0.114455 & -1.315 & 0.095397 \tabularnewline
8 & -0.053451 & -0.6141 & 0.2701 \tabularnewline
9 & -0.089388 & -1.027 & 0.153152 \tabularnewline
10 & -0.18718 & -2.1505 & 0.016667 \tabularnewline
11 & -0.030324 & -0.3484 & 0.364049 \tabularnewline
12 & -0.059283 & -0.6811 & 0.248496 \tabularnewline
13 & -0.007415 & -0.0852 & 0.46612 \tabularnewline
14 & -0.04898 & -0.5627 & 0.287286 \tabularnewline
15 & -0.092911 & -1.0675 & 0.143855 \tabularnewline
16 & -0.072603 & -0.8341 & 0.202853 \tabularnewline
17 & -0.06038 & -0.6937 & 0.244542 \tabularnewline
18 & -0.041588 & -0.4778 & 0.316787 \tabularnewline
19 & 0.001467 & 0.0169 & 0.493289 \tabularnewline
20 & -0.052995 & -0.6089 & 0.271831 \tabularnewline
21 & -0.03052 & -0.3507 & 0.363204 \tabularnewline
\hline
\end{tabular}
%Source: https://freestatistics.org/blog/index.php?pk=36098&T=2

[TABLE]
[ROW][C]Partial Autocorrelation Function[/C][/ROW]
[ROW][C]Time lag k[/C][C]PACF(k)[/C][C]T-STAT[/C][C]P-value[/C][/ROW]
[ROW][C]1[/C][C]0.979349[/C][C]11.2519[/C][C]0[/C][/ROW]
[ROW][C]2[/C][C]-0.192531[/C][C]-2.212[/C][C]0.014343[/C][/ROW]
[ROW][C]3[/C][C]-0.066783[/C][C]-0.7673[/C][C]0.222142[/C][/ROW]
[ROW][C]4[/C][C]-0.015395[/C][C]-0.1769[/C][C]0.429939[/C][/ROW]
[ROW][C]5[/C][C]-0.005871[/C][C]-0.0675[/C][C]0.473161[/C][/ROW]
[ROW][C]6[/C][C]-0.128211[/C][C]-1.473[/C][C]0.071561[/C][/ROW]
[ROW][C]7[/C][C]-0.114455[/C][C]-1.315[/C][C]0.095397[/C][/ROW]
[ROW][C]8[/C][C]-0.053451[/C][C]-0.6141[/C][C]0.2701[/C][/ROW]
[ROW][C]9[/C][C]-0.089388[/C][C]-1.027[/C][C]0.153152[/C][/ROW]
[ROW][C]10[/C][C]-0.18718[/C][C]-2.1505[/C][C]0.016667[/C][/ROW]
[ROW][C]11[/C][C]-0.030324[/C][C]-0.3484[/C][C]0.364049[/C][/ROW]
[ROW][C]12[/C][C]-0.059283[/C][C]-0.6811[/C][C]0.248496[/C][/ROW]
[ROW][C]13[/C][C]-0.007415[/C][C]-0.0852[/C][C]0.46612[/C][/ROW]
[ROW][C]14[/C][C]-0.04898[/C][C]-0.5627[/C][C]0.287286[/C][/ROW]
[ROW][C]15[/C][C]-0.092911[/C][C]-1.0675[/C][C]0.143855[/C][/ROW]
[ROW][C]16[/C][C]-0.072603[/C][C]-0.8341[/C][C]0.202853[/C][/ROW]
[ROW][C]17[/C][C]-0.06038[/C][C]-0.6937[/C][C]0.244542[/C][/ROW]
[ROW][C]18[/C][C]-0.041588[/C][C]-0.4778[/C][C]0.316787[/C][/ROW]
[ROW][C]19[/C][C]0.001467[/C][C]0.0169[/C][C]0.493289[/C][/ROW]
[ROW][C]20[/C][C]-0.052995[/C][C]-0.6089[/C][C]0.271831[/C][/ROW]
[ROW][C]21[/C][C]-0.03052[/C][C]-0.3507[/C][C]0.363204[/C][/ROW]
[/TABLE]
Source: https://freestatistics.org/blog/index.php?pk=36098&T=2

Globally Unique Identifier (entire table): ba.freestatistics.org/blog/index.php?pk=36098&T=2

As an alternative you can also use a QR Code:  

The GUIDs for individual cells are displayed in the table below:

Partial Autocorrelation Function
Time lag kPACF(k)T-STATP-value
10.97934911.25190
2-0.192531-2.2120.014343
3-0.066783-0.76730.222142
4-0.015395-0.17690.429939
5-0.005871-0.06750.473161
6-0.128211-1.4730.071561
7-0.114455-1.3150.095397
8-0.053451-0.61410.2701
9-0.089388-1.0270.153152
10-0.18718-2.15050.016667
11-0.030324-0.34840.364049
12-0.059283-0.68110.248496
13-0.007415-0.08520.46612
14-0.04898-0.56270.287286
15-0.092911-1.06750.143855
16-0.072603-0.83410.202853
17-0.06038-0.69370.244542
18-0.041588-0.47780.316787
190.0014670.01690.493289
20-0.052995-0.60890.271831
21-0.03052-0.35070.363204


Parameters (Session):
par1 = Default ; par2 = 1 ; par3 = 0 ; par4 = 0 ; par5 = 12 ;
Parameters (R input):
par1 = Default ; par2 = 1 ; par3 = 0 ; par4 = 0 ; par5 = 12 ;
R code (references can be found in the software module):
if (par1 == 'Default') {
par1 = 10*log10(length(x))
} else {
par1 <- as.numeric(par1)
}
par2 <- as.numeric(par2)
par3 <- as.numeric(par3)
par4 <- as.numeric(par4)
par5 <- as.numeric(par5)
if (par2 == 0) {
x <- log(x)
} else {
x <- (x ^ par2 - 1) / par2
}
if (par3 > 0) x <- diff(x,lag=1,difference=par3)
if (par4 > 0) x <- diff(x,lag=par5,difference=par4)
bitmap(file='pic1.png')
racf <- acf(x,par1,main='Autocorrelation',xlab='lags',ylab='ACF')
dev.off()
bitmap(file='pic2.png')
rpacf <- pacf(x,par1,main='Partial Autocorrelation',xlab='lags',ylab='PACF')
dev.off()
(myacf <- c(racf$acf))
(mypacf <- c(rpacf$acf))
lengthx <- length(x)
sqrtn <- sqrt(lengthx)
load(file='createtable')
a<-table.start()
a<-table.row.start(a)
a<-table.element(a,'Autocorrelation Function',4,TRUE)
a<-table.row.end(a)
a<-table.row.start(a)
a<-table.element(a,'Time lag k',header=TRUE)
a<-table.element(a,hyperlink('basics.htm','ACF(k)','click here for more information about the Autocorrelation Function'),header=TRUE)
a<-table.element(a,'T-STAT',header=TRUE)
a<-table.element(a,'P-value',header=TRUE)
a<-table.row.end(a)
for (i in 2:(par1+1)) {
a<-table.row.start(a)
a<-table.element(a,i-1,header=TRUE)
a<-table.element(a,round(myacf[i],6))
mytstat <- myacf[i]*sqrtn
a<-table.element(a,round(mytstat,4))
a<-table.element(a,round(1-pt(abs(mytstat),lengthx),6))
a<-table.row.end(a)
}
a<-table.end(a)
table.save(a,file='mytable.tab')
a<-table.start()
a<-table.row.start(a)
a<-table.element(a,'Partial Autocorrelation Function',4,TRUE)
a<-table.row.end(a)
a<-table.row.start(a)
a<-table.element(a,'Time lag k',header=TRUE)
a<-table.element(a,hyperlink('basics.htm','PACF(k)','click here for more information about the Partial Autocorrelation Function'),header=TRUE)
a<-table.element(a,'T-STAT',header=TRUE)
a<-table.element(a,'P-value',header=TRUE)
a<-table.row.end(a)
for (i in 1:par1) {
a<-table.row.start(a)
a<-table.element(a,i,header=TRUE)
a<-table.element(a,round(mypacf[i],6))
mytstat <- mypacf[i]*sqrtn
a<-table.element(a,round(mytstat,4))
a<-table.element(a,round(1-pt(abs(mytstat),lengthx),6))
a<-table.row.end(a)
}
a<-table.end(a)
table.save(a,file='mytable1.tab')