Free Statistics

of Irreproducible Research!

Author's title

Author*The author of this computation has been verified*
R Software Modulerwasp_autocorrelation.wasp
Title produced by software(Partial) Autocorrelation Function
Date of computationMon, 22 Dec 2008 08:15:00 -0700
Cite this page as followsStatistical Computations at FreeStatistics.org, Office for Research Development and Education, URL https://freestatistics.org/blog/index.php?v=date/2008/Dec/22/t1229958973u32ra2vd8fi5q6r.htm/, Retrieved Sun, 12 May 2024 19:34:44 +0000
Statistical Computations at FreeStatistics.org, Office for Research Development and Education, URL https://freestatistics.org/blog/index.php?pk=36094, Retrieved Sun, 12 May 2024 19:34:44 +0000
QR Codes:

Original text written by user:
IsPrivate?No (this computation is public)
User-defined keywords
Estimated Impact183
Family? (F = Feedback message, R = changed R code, M = changed R Module, P = changed Parameters, D = changed Data)
-     [(Partial) Autocorrelation Function] [(P)ACF werkloosheid] [2008-12-21 22:54:14] [7a4703cb85a198d9845d72899eff0288]
-   PD  [(Partial) Autocorrelation Function] [(P)ACF Duurzame c...] [2008-12-21 23:35:20] [7a4703cb85a198d9845d72899eff0288]
-   PD      [(Partial) Autocorrelation Function] [(P)ACF duurzame c...] [2008-12-22 15:15:00] [9f72e095d5529918bf5b0810c01bf6ce] [Current]
Feedback Forum

Post a new message
Dataseries X:
98.1
101.1
111.1
93.3
100
108
70.4
75.4
105.5
112.3
102.5
93.5
86.7
95.2
103.8
97
95.5
101
67.5
64
106.7
100.6
101.2
93.1
84.2
85.8
91.8
92.4
80.3
79.7
62.5
57.1
100.8
100.7
86.2
83.2


Summary of computational transaction
Raw Inputview raw input (R code)
Raw Outputview raw output of R engine
Computing time3 seconds
R Server'Sir Ronald Aylmer Fisher' @ 193.190.124.24

\begin{tabular}{lllllllll}
\hline
Summary of computational transaction \tabularnewline
Raw Input & view raw input (R code)  \tabularnewline
Raw Output & view raw output of R engine  \tabularnewline
Computing time & 3 seconds \tabularnewline
R Server & 'Sir Ronald Aylmer Fisher' @ 193.190.124.24 \tabularnewline
\hline
\end{tabular}
%Source: https://freestatistics.org/blog/index.php?pk=36094&T=0

[TABLE]
[ROW][C]Summary of computational transaction[/C][/ROW]
[ROW][C]Raw Input[/C][C]view raw input (R code) [/C][/ROW]
[ROW][C]Raw Output[/C][C]view raw output of R engine [/C][/ROW]
[ROW][C]Computing time[/C][C]3 seconds[/C][/ROW]
[ROW][C]R Server[/C][C]'Sir Ronald Aylmer Fisher' @ 193.190.124.24[/C][/ROW]
[/TABLE]
Source: https://freestatistics.org/blog/index.php?pk=36094&T=0

Globally Unique Identifier (entire table): ba.freestatistics.org/blog/index.php?pk=36094&T=0

As an alternative you can also use a QR Code:  

The GUIDs for individual cells are displayed in the table below:

Summary of computational transaction
Raw Inputview raw input (R code)
Raw Outputview raw output of R engine
Computing time3 seconds
R Server'Sir Ronald Aylmer Fisher' @ 193.190.124.24


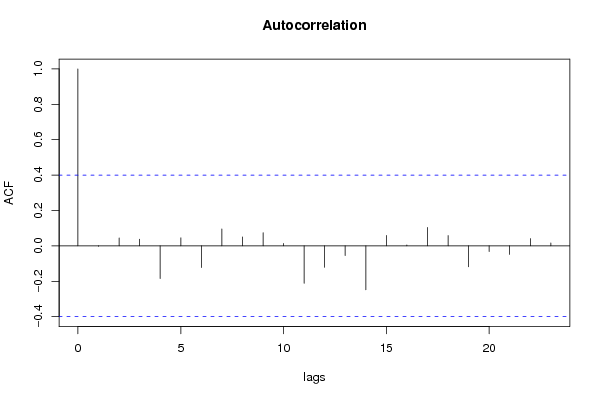
Autocorrelation Function
Time lag kACF(k)T-STATP-value
1-0.002019-0.00990.496095
20.044460.21780.41471
30.0379690.1860.427001
4-0.185108-0.90680.186754
50.0452270.22160.413263
6-0.122536-0.60030.276966
70.0951270.4660.3227
80.0498410.24420.404588
90.074470.36480.359218
100.0137990.06760.473331
11-0.211118-1.03430.155662
12-0.121513-0.59530.278611
13-0.0546-0.26750.395691
14-0.248644-1.21810.117513
150.0589510.28880.387607
160.0055340.02710.489298
170.1036060.50760.308196
180.0580570.28440.389263
19-0.118374-0.57990.283689
20-0.032424-0.15880.437561
21-0.048406-0.23710.40728
220.0411630.20170.420943
230.0165380.0810.46805
24NANANA
25NANANA
26NANANA
27NANANA
28NANANA
29NANANA
30NANANA
31NANANA
32NANANA
33NANANA
34NANANA
35NANANA
36NANANA

\begin{tabular}{lllllllll}
\hline
Autocorrelation Function \tabularnewline
Time lag k & ACF(k) & T-STAT & P-value \tabularnewline
1 & -0.002019 & -0.0099 & 0.496095 \tabularnewline
2 & 0.04446 & 0.2178 & 0.41471 \tabularnewline
3 & 0.037969 & 0.186 & 0.427001 \tabularnewline
4 & -0.185108 & -0.9068 & 0.186754 \tabularnewline
5 & 0.045227 & 0.2216 & 0.413263 \tabularnewline
6 & -0.122536 & -0.6003 & 0.276966 \tabularnewline
7 & 0.095127 & 0.466 & 0.3227 \tabularnewline
8 & 0.049841 & 0.2442 & 0.404588 \tabularnewline
9 & 0.07447 & 0.3648 & 0.359218 \tabularnewline
10 & 0.013799 & 0.0676 & 0.473331 \tabularnewline
11 & -0.211118 & -1.0343 & 0.155662 \tabularnewline
12 & -0.121513 & -0.5953 & 0.278611 \tabularnewline
13 & -0.0546 & -0.2675 & 0.395691 \tabularnewline
14 & -0.248644 & -1.2181 & 0.117513 \tabularnewline
15 & 0.058951 & 0.2888 & 0.387607 \tabularnewline
16 & 0.005534 & 0.0271 & 0.489298 \tabularnewline
17 & 0.103606 & 0.5076 & 0.308196 \tabularnewline
18 & 0.058057 & 0.2844 & 0.389263 \tabularnewline
19 & -0.118374 & -0.5799 & 0.283689 \tabularnewline
20 & -0.032424 & -0.1588 & 0.437561 \tabularnewline
21 & -0.048406 & -0.2371 & 0.40728 \tabularnewline
22 & 0.041163 & 0.2017 & 0.420943 \tabularnewline
23 & 0.016538 & 0.081 & 0.46805 \tabularnewline
24 & NA & NA & NA \tabularnewline
25 & NA & NA & NA \tabularnewline
26 & NA & NA & NA \tabularnewline
27 & NA & NA & NA \tabularnewline
28 & NA & NA & NA \tabularnewline
29 & NA & NA & NA \tabularnewline
30 & NA & NA & NA \tabularnewline
31 & NA & NA & NA \tabularnewline
32 & NA & NA & NA \tabularnewline
33 & NA & NA & NA \tabularnewline
34 & NA & NA & NA \tabularnewline
35 & NA & NA & NA \tabularnewline
36 & NA & NA & NA \tabularnewline
\hline
\end{tabular}
%Source: https://freestatistics.org/blog/index.php?pk=36094&T=1

[TABLE]
[ROW][C]Autocorrelation Function[/C][/ROW]
[ROW][C]Time lag k[/C][C]ACF(k)[/C][C]T-STAT[/C][C]P-value[/C][/ROW]
[ROW][C]1[/C][C]-0.002019[/C][C]-0.0099[/C][C]0.496095[/C][/ROW]
[ROW][C]2[/C][C]0.04446[/C][C]0.2178[/C][C]0.41471[/C][/ROW]
[ROW][C]3[/C][C]0.037969[/C][C]0.186[/C][C]0.427001[/C][/ROW]
[ROW][C]4[/C][C]-0.185108[/C][C]-0.9068[/C][C]0.186754[/C][/ROW]
[ROW][C]5[/C][C]0.045227[/C][C]0.2216[/C][C]0.413263[/C][/ROW]
[ROW][C]6[/C][C]-0.122536[/C][C]-0.6003[/C][C]0.276966[/C][/ROW]
[ROW][C]7[/C][C]0.095127[/C][C]0.466[/C][C]0.3227[/C][/ROW]
[ROW][C]8[/C][C]0.049841[/C][C]0.2442[/C][C]0.404588[/C][/ROW]
[ROW][C]9[/C][C]0.07447[/C][C]0.3648[/C][C]0.359218[/C][/ROW]
[ROW][C]10[/C][C]0.013799[/C][C]0.0676[/C][C]0.473331[/C][/ROW]
[ROW][C]11[/C][C]-0.211118[/C][C]-1.0343[/C][C]0.155662[/C][/ROW]
[ROW][C]12[/C][C]-0.121513[/C][C]-0.5953[/C][C]0.278611[/C][/ROW]
[ROW][C]13[/C][C]-0.0546[/C][C]-0.2675[/C][C]0.395691[/C][/ROW]
[ROW][C]14[/C][C]-0.248644[/C][C]-1.2181[/C][C]0.117513[/C][/ROW]
[ROW][C]15[/C][C]0.058951[/C][C]0.2888[/C][C]0.387607[/C][/ROW]
[ROW][C]16[/C][C]0.005534[/C][C]0.0271[/C][C]0.489298[/C][/ROW]
[ROW][C]17[/C][C]0.103606[/C][C]0.5076[/C][C]0.308196[/C][/ROW]
[ROW][C]18[/C][C]0.058057[/C][C]0.2844[/C][C]0.389263[/C][/ROW]
[ROW][C]19[/C][C]-0.118374[/C][C]-0.5799[/C][C]0.283689[/C][/ROW]
[ROW][C]20[/C][C]-0.032424[/C][C]-0.1588[/C][C]0.437561[/C][/ROW]
[ROW][C]21[/C][C]-0.048406[/C][C]-0.2371[/C][C]0.40728[/C][/ROW]
[ROW][C]22[/C][C]0.041163[/C][C]0.2017[/C][C]0.420943[/C][/ROW]
[ROW][C]23[/C][C]0.016538[/C][C]0.081[/C][C]0.46805[/C][/ROW]
[ROW][C]24[/C][C]NA[/C][C]NA[/C][C]NA[/C][/ROW]
[ROW][C]25[/C][C]NA[/C][C]NA[/C][C]NA[/C][/ROW]
[ROW][C]26[/C][C]NA[/C][C]NA[/C][C]NA[/C][/ROW]
[ROW][C]27[/C][C]NA[/C][C]NA[/C][C]NA[/C][/ROW]
[ROW][C]28[/C][C]NA[/C][C]NA[/C][C]NA[/C][/ROW]
[ROW][C]29[/C][C]NA[/C][C]NA[/C][C]NA[/C][/ROW]
[ROW][C]30[/C][C]NA[/C][C]NA[/C][C]NA[/C][/ROW]
[ROW][C]31[/C][C]NA[/C][C]NA[/C][C]NA[/C][/ROW]
[ROW][C]32[/C][C]NA[/C][C]NA[/C][C]NA[/C][/ROW]
[ROW][C]33[/C][C]NA[/C][C]NA[/C][C]NA[/C][/ROW]
[ROW][C]34[/C][C]NA[/C][C]NA[/C][C]NA[/C][/ROW]
[ROW][C]35[/C][C]NA[/C][C]NA[/C][C]NA[/C][/ROW]
[ROW][C]36[/C][C]NA[/C][C]NA[/C][C]NA[/C][/ROW]
[/TABLE]
Source: https://freestatistics.org/blog/index.php?pk=36094&T=1

Globally Unique Identifier (entire table): ba.freestatistics.org/blog/index.php?pk=36094&T=1

As an alternative you can also use a QR Code:  

The GUIDs for individual cells are displayed in the table below:

Autocorrelation Function
Time lag kACF(k)T-STATP-value
1-0.002019-0.00990.496095
20.044460.21780.41471
30.0379690.1860.427001
4-0.185108-0.90680.186754
50.0452270.22160.413263
6-0.122536-0.60030.276966
70.0951270.4660.3227
80.0498410.24420.404588
90.074470.36480.359218
100.0137990.06760.473331
11-0.211118-1.03430.155662
12-0.121513-0.59530.278611
13-0.0546-0.26750.395691
14-0.248644-1.21810.117513
150.0589510.28880.387607
160.0055340.02710.489298
170.1036060.50760.308196
180.0580570.28440.389263
19-0.118374-0.57990.283689
20-0.032424-0.15880.437561
21-0.048406-0.23710.40728
220.0411630.20170.420943
230.0165380.0810.46805
24NANANA
25NANANA
26NANANA
27NANANA
28NANANA
29NANANA
30NANANA
31NANANA
32NANANA
33NANANA
34NANANA
35NANANA
36NANANA


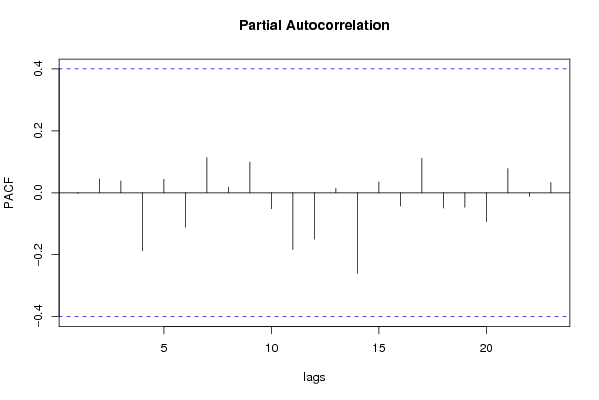
Partial Autocorrelation Function
Time lag kPACF(k)T-STATP-value
1-0.002019-0.00990.496095
20.0444560.21780.414718
30.038220.18720.426524
4-0.187517-0.91860.183712
50.04350.21310.416521
6-0.110957-0.54360.295874
70.1136380.55670.291439
80.0177780.08710.46566
90.099220.48610.315662
10-0.05169-0.25320.401125
11-0.18287-0.89590.189609
12-0.149144-0.73070.236032
130.0148610.07280.471282
14-0.260153-1.27450.107347
150.0346350.16970.433343
16-0.042686-0.20910.418061
170.1116450.54690.294733
18-0.049299-0.24150.405603
19-0.046916-0.22980.410081
20-0.093269-0.45690.325918
210.0782490.38330.352421
22-0.011671-0.05720.477439
230.0333550.16340.435784
24NANANA
25NANANA
26NANANA
27NANANA
28NANANA
29NANANA
30NANANA
31NANANA
32NANANA
33NANANA
34NANANA
35NANANA
36NANANA

\begin{tabular}{lllllllll}
\hline
Partial Autocorrelation Function \tabularnewline
Time lag k & PACF(k) & T-STAT & P-value \tabularnewline
1 & -0.002019 & -0.0099 & 0.496095 \tabularnewline
2 & 0.044456 & 0.2178 & 0.414718 \tabularnewline
3 & 0.03822 & 0.1872 & 0.426524 \tabularnewline
4 & -0.187517 & -0.9186 & 0.183712 \tabularnewline
5 & 0.0435 & 0.2131 & 0.416521 \tabularnewline
6 & -0.110957 & -0.5436 & 0.295874 \tabularnewline
7 & 0.113638 & 0.5567 & 0.291439 \tabularnewline
8 & 0.017778 & 0.0871 & 0.46566 \tabularnewline
9 & 0.09922 & 0.4861 & 0.315662 \tabularnewline
10 & -0.05169 & -0.2532 & 0.401125 \tabularnewline
11 & -0.18287 & -0.8959 & 0.189609 \tabularnewline
12 & -0.149144 & -0.7307 & 0.236032 \tabularnewline
13 & 0.014861 & 0.0728 & 0.471282 \tabularnewline
14 & -0.260153 & -1.2745 & 0.107347 \tabularnewline
15 & 0.034635 & 0.1697 & 0.433343 \tabularnewline
16 & -0.042686 & -0.2091 & 0.418061 \tabularnewline
17 & 0.111645 & 0.5469 & 0.294733 \tabularnewline
18 & -0.049299 & -0.2415 & 0.405603 \tabularnewline
19 & -0.046916 & -0.2298 & 0.410081 \tabularnewline
20 & -0.093269 & -0.4569 & 0.325918 \tabularnewline
21 & 0.078249 & 0.3833 & 0.352421 \tabularnewline
22 & -0.011671 & -0.0572 & 0.477439 \tabularnewline
23 & 0.033355 & 0.1634 & 0.435784 \tabularnewline
24 & NA & NA & NA \tabularnewline
25 & NA & NA & NA \tabularnewline
26 & NA & NA & NA \tabularnewline
27 & NA & NA & NA \tabularnewline
28 & NA & NA & NA \tabularnewline
29 & NA & NA & NA \tabularnewline
30 & NA & NA & NA \tabularnewline
31 & NA & NA & NA \tabularnewline
32 & NA & NA & NA \tabularnewline
33 & NA & NA & NA \tabularnewline
34 & NA & NA & NA \tabularnewline
35 & NA & NA & NA \tabularnewline
36 & NA & NA & NA \tabularnewline
\hline
\end{tabular}
%Source: https://freestatistics.org/blog/index.php?pk=36094&T=2

[TABLE]
[ROW][C]Partial Autocorrelation Function[/C][/ROW]
[ROW][C]Time lag k[/C][C]PACF(k)[/C][C]T-STAT[/C][C]P-value[/C][/ROW]
[ROW][C]1[/C][C]-0.002019[/C][C]-0.0099[/C][C]0.496095[/C][/ROW]
[ROW][C]2[/C][C]0.044456[/C][C]0.2178[/C][C]0.414718[/C][/ROW]
[ROW][C]3[/C][C]0.03822[/C][C]0.1872[/C][C]0.426524[/C][/ROW]
[ROW][C]4[/C][C]-0.187517[/C][C]-0.9186[/C][C]0.183712[/C][/ROW]
[ROW][C]5[/C][C]0.0435[/C][C]0.2131[/C][C]0.416521[/C][/ROW]
[ROW][C]6[/C][C]-0.110957[/C][C]-0.5436[/C][C]0.295874[/C][/ROW]
[ROW][C]7[/C][C]0.113638[/C][C]0.5567[/C][C]0.291439[/C][/ROW]
[ROW][C]8[/C][C]0.017778[/C][C]0.0871[/C][C]0.46566[/C][/ROW]
[ROW][C]9[/C][C]0.09922[/C][C]0.4861[/C][C]0.315662[/C][/ROW]
[ROW][C]10[/C][C]-0.05169[/C][C]-0.2532[/C][C]0.401125[/C][/ROW]
[ROW][C]11[/C][C]-0.18287[/C][C]-0.8959[/C][C]0.189609[/C][/ROW]
[ROW][C]12[/C][C]-0.149144[/C][C]-0.7307[/C][C]0.236032[/C][/ROW]
[ROW][C]13[/C][C]0.014861[/C][C]0.0728[/C][C]0.471282[/C][/ROW]
[ROW][C]14[/C][C]-0.260153[/C][C]-1.2745[/C][C]0.107347[/C][/ROW]
[ROW][C]15[/C][C]0.034635[/C][C]0.1697[/C][C]0.433343[/C][/ROW]
[ROW][C]16[/C][C]-0.042686[/C][C]-0.2091[/C][C]0.418061[/C][/ROW]
[ROW][C]17[/C][C]0.111645[/C][C]0.5469[/C][C]0.294733[/C][/ROW]
[ROW][C]18[/C][C]-0.049299[/C][C]-0.2415[/C][C]0.405603[/C][/ROW]
[ROW][C]19[/C][C]-0.046916[/C][C]-0.2298[/C][C]0.410081[/C][/ROW]
[ROW][C]20[/C][C]-0.093269[/C][C]-0.4569[/C][C]0.325918[/C][/ROW]
[ROW][C]21[/C][C]0.078249[/C][C]0.3833[/C][C]0.352421[/C][/ROW]
[ROW][C]22[/C][C]-0.011671[/C][C]-0.0572[/C][C]0.477439[/C][/ROW]
[ROW][C]23[/C][C]0.033355[/C][C]0.1634[/C][C]0.435784[/C][/ROW]
[ROW][C]24[/C][C]NA[/C][C]NA[/C][C]NA[/C][/ROW]
[ROW][C]25[/C][C]NA[/C][C]NA[/C][C]NA[/C][/ROW]
[ROW][C]26[/C][C]NA[/C][C]NA[/C][C]NA[/C][/ROW]
[ROW][C]27[/C][C]NA[/C][C]NA[/C][C]NA[/C][/ROW]
[ROW][C]28[/C][C]NA[/C][C]NA[/C][C]NA[/C][/ROW]
[ROW][C]29[/C][C]NA[/C][C]NA[/C][C]NA[/C][/ROW]
[ROW][C]30[/C][C]NA[/C][C]NA[/C][C]NA[/C][/ROW]
[ROW][C]31[/C][C]NA[/C][C]NA[/C][C]NA[/C][/ROW]
[ROW][C]32[/C][C]NA[/C][C]NA[/C][C]NA[/C][/ROW]
[ROW][C]33[/C][C]NA[/C][C]NA[/C][C]NA[/C][/ROW]
[ROW][C]34[/C][C]NA[/C][C]NA[/C][C]NA[/C][/ROW]
[ROW][C]35[/C][C]NA[/C][C]NA[/C][C]NA[/C][/ROW]
[ROW][C]36[/C][C]NA[/C][C]NA[/C][C]NA[/C][/ROW]
[/TABLE]
Source: https://freestatistics.org/blog/index.php?pk=36094&T=2

Globally Unique Identifier (entire table): ba.freestatistics.org/blog/index.php?pk=36094&T=2

As an alternative you can also use a QR Code:  

The GUIDs for individual cells are displayed in the table below:

Partial Autocorrelation Function
Time lag kPACF(k)T-STATP-value
1-0.002019-0.00990.496095
20.0444560.21780.414718
30.038220.18720.426524
4-0.187517-0.91860.183712
50.04350.21310.416521
6-0.110957-0.54360.295874
70.1136380.55670.291439
80.0177780.08710.46566
90.099220.48610.315662
10-0.05169-0.25320.401125
11-0.18287-0.89590.189609
12-0.149144-0.73070.236032
130.0148610.07280.471282
14-0.260153-1.27450.107347
150.0346350.16970.433343
16-0.042686-0.20910.418061
170.1116450.54690.294733
18-0.049299-0.24150.405603
19-0.046916-0.22980.410081
20-0.093269-0.45690.325918
210.0782490.38330.352421
22-0.011671-0.05720.477439
230.0333550.16340.435784
24NANANA
25NANANA
26NANANA
27NANANA
28NANANA
29NANANA
30NANANA
31NANANA
32NANANA
33NANANA
34NANANA
35NANANA
36NANANA


Parameters (Session):
par1 = 36 ; par2 = 1 ; par3 = 1 ; par4 = 1 ; par5 = 12 ;
Parameters (R input):
par1 = 36 ; par2 = 1 ; par3 = 0 ; par4 = 1 ; par5 = 12 ;
R code (references can be found in the software module):
if (par1 == 'Default') {
par1 = 10*log10(length(x))
} else {
par1 <- as.numeric(par1)
}
par2 <- as.numeric(par2)
par3 <- as.numeric(par3)
par4 <- as.numeric(par4)
par5 <- as.numeric(par5)
if (par2 == 0) {
x <- log(x)
} else {
x <- (x ^ par2 - 1) / par2
}
if (par3 > 0) x <- diff(x,lag=1,difference=par3)
if (par4 > 0) x <- diff(x,lag=par5,difference=par4)
bitmap(file='pic1.png')
racf <- acf(x,par1,main='Autocorrelation',xlab='lags',ylab='ACF')
dev.off()
bitmap(file='pic2.png')
rpacf <- pacf(x,par1,main='Partial Autocorrelation',xlab='lags',ylab='PACF')
dev.off()
(myacf <- c(racf$acf))
(mypacf <- c(rpacf$acf))
lengthx <- length(x)
sqrtn <- sqrt(lengthx)
load(file='createtable')
a<-table.start()
a<-table.row.start(a)
a<-table.element(a,'Autocorrelation Function',4,TRUE)
a<-table.row.end(a)
a<-table.row.start(a)
a<-table.element(a,'Time lag k',header=TRUE)
a<-table.element(a,hyperlink('basics.htm','ACF(k)','click here for more information about the Autocorrelation Function'),header=TRUE)
a<-table.element(a,'T-STAT',header=TRUE)
a<-table.element(a,'P-value',header=TRUE)
a<-table.row.end(a)
for (i in 2:(par1+1)) {
a<-table.row.start(a)
a<-table.element(a,i-1,header=TRUE)
a<-table.element(a,round(myacf[i],6))
mytstat <- myacf[i]*sqrtn
a<-table.element(a,round(mytstat,4))
a<-table.element(a,round(1-pt(abs(mytstat),lengthx),6))
a<-table.row.end(a)
}
a<-table.end(a)
table.save(a,file='mytable.tab')
a<-table.start()
a<-table.row.start(a)
a<-table.element(a,'Partial Autocorrelation Function',4,TRUE)
a<-table.row.end(a)
a<-table.row.start(a)
a<-table.element(a,'Time lag k',header=TRUE)
a<-table.element(a,hyperlink('basics.htm','PACF(k)','click here for more information about the Partial Autocorrelation Function'),header=TRUE)
a<-table.element(a,'T-STAT',header=TRUE)
a<-table.element(a,'P-value',header=TRUE)
a<-table.row.end(a)
for (i in 1:par1) {
a<-table.row.start(a)
a<-table.element(a,i,header=TRUE)
a<-table.element(a,round(mypacf[i],6))
mytstat <- mypacf[i]*sqrtn
a<-table.element(a,round(mytstat,4))
a<-table.element(a,round(1-pt(abs(mytstat),lengthx),6))
a<-table.row.end(a)
}
a<-table.end(a)
table.save(a,file='mytable1.tab')