Free Statistics

of Irreproducible Research!

Author's title

Author*The author of this computation has been verified*
R Software Modulerwasp_centraltendency.wasp
Title produced by softwareCentral Tendency
Date of computationMon, 22 Dec 2008 07:26:43 -0700
Cite this page as followsStatistical Computations at FreeStatistics.org, Office for Research Development and Education, URL https://freestatistics.org/blog/index.php?v=date/2008/Dec/22/t1229956124vyby9pv5zxb4akt.htm/, Retrieved Mon, 13 May 2024 06:55:24 +0000
Statistical Computations at FreeStatistics.org, Office for Research Development and Education, URL https://freestatistics.org/blog/index.php?pk=36085, Retrieved Mon, 13 May 2024 06:55:24 +0000
QR Codes:

Original text written by user:
IsPrivate?No (this computation is public)
User-defined keywords4
Estimated Impact153
Family? (F = Feedback message, R = changed R code, M = changed R Module, P = changed Parameters, D = changed Data)
-     [Univariate Data Series] [Niet werkende wer...] [2008-10-13 17:04:19] [fe7291e888d31b8c4db0b24d6c0f75c6]
F RMPD  [Central Tendency] [Q9: Make a predic...] [2008-10-20 20:40:16] [fe7291e888d31b8c4db0b24d6c0f75c6]
-    D      [Central Tendency] [4] [2008-12-22 14:26:43] [783db4b4a0f63b73ca8b14666b7f4329] [Current]
Feedback Forum

Post a new message
Dataseries X:
99984
99981
99972
99989
99996
99991
99988
99990
99998
99987
100000
100000
100004
100007
100005
100002
99998
100006
99997
100001
100000
99993
99994
99996
99996
99998
100002
99995
99985
99984
99982
99987
99977
99990
99990
99994
99997
99996
99993
99993
99993
99997
100000
99995
99997
100003
100002
99993
99999
100000
99997
100004
100002
100003
100000
99990
99990
99991
99978
99984
99982
99986
99988
99983
99977
99972
99969
99979
99981
99978
99978


Summary of computational transaction
Raw Inputview raw input (R code)
Raw Outputview raw output of R engine
Computing time2 seconds
R Server'Gwilym Jenkins' @ 72.249.127.135

\begin{tabular}{lllllllll}
\hline
Summary of computational transaction \tabularnewline
Raw Input & view raw input (R code)  \tabularnewline
Raw Output & view raw output of R engine  \tabularnewline
Computing time & 2 seconds \tabularnewline
R Server & 'Gwilym Jenkins' @ 72.249.127.135 \tabularnewline
\hline
\end{tabular}
%Source: https://freestatistics.org/blog/index.php?pk=36085&T=0

[TABLE]
[ROW][C]Summary of computational transaction[/C][/ROW]
[ROW][C]Raw Input[/C][C]view raw input (R code) [/C][/ROW]
[ROW][C]Raw Output[/C][C]view raw output of R engine [/C][/ROW]
[ROW][C]Computing time[/C][C]2 seconds[/C][/ROW]
[ROW][C]R Server[/C][C]'Gwilym Jenkins' @ 72.249.127.135[/C][/ROW]
[/TABLE]
Source: https://freestatistics.org/blog/index.php?pk=36085&T=0

Globally Unique Identifier (entire table): ba.freestatistics.org/blog/index.php?pk=36085&T=0

As an alternative you can also use a QR Code:  

The GUIDs for individual cells are displayed in the table below:

Summary of computational transaction
Raw Inputview raw input (R code)
Raw Outputview raw output of R engine
Computing time2 seconds
R Server'Gwilym Jenkins' @ 72.249.127.135


Central Tendency - Ungrouped Data
MeasureValueS.E.Value/S.E.
Arithmetic Mean99991.95774647891.0812907965052592474.6220624963
Geometric Mean99991.9573372161
Harmonic Mean99991.9569279402
Quadratic Mean99991.9581557282
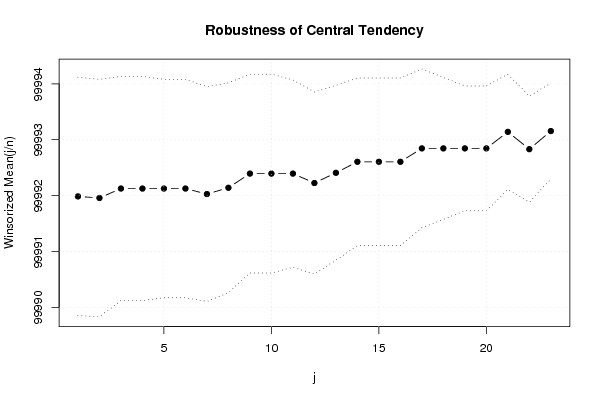
Winsorized Mean ( 1 / 23 )99991.9859154931.0664997484195093757.1584650403
Winsorized Mean ( 2 / 23 )99991.95774647891.0613829897795194209.1202792419
Winsorized Mean ( 3 / 23 )99992.12676056341.0027988152010099713.0483650613
Winsorized Mean ( 4 / 23 )99992.12676056341.0027988152010099713.0483650613
Winsorized Mean ( 5 / 23 )99992.12676056340.976366519534917102412.490350646
Winsorized Mean ( 6 / 23 )99992.12676056340.976366519534917102412.490350646
Winsorized Mean ( 7 / 23 )99992.0281690140.961213985724553104026.813648203
Winsorized Mean ( 8 / 23 )99992.14084507040.938189483473652106579.89948347
Winsorized Mean ( 9 / 23 )99992.39436619720.889572699005919112404.972047745
Winsorized Mean ( 10 / 23 )99992.39436619720.889572699005919112404.972047745
Winsorized Mean ( 11 / 23 )99992.39436619720.838336686358135119274.744852906
Winsorized Mean ( 12 / 23 )99992.22535211270.814406792568756122779.213366729
Winsorized Mean ( 13 / 23 )99992.40845070420.782241906520865127827.987246854
Winsorized Mean ( 14 / 23 )99992.60563380280.749105133007083133482.739909162
Winsorized Mean ( 15 / 23 )99992.60563380280.749105133007083133482.739909162
Winsorized Mean ( 16 / 23 )99992.60563380280.749105133007083133482.739909162
Winsorized Mean ( 17 / 23 )99992.84507042250.71055505475976140724.978874762
Winsorized Mean ( 18 / 23 )99992.84507042250.635200783327933157419.272291419
Winsorized Mean ( 19 / 23 )99992.84507042250.558327441670487179093.552649408
Winsorized Mean ( 20 / 23 )99992.84507042250.558327441670487179093.552649408
Winsorized Mean ( 21 / 23 )99993.14084507040.515082683541644194130.270809203
Winsorized Mean ( 22 / 23 )99992.83098591550.474706693513354210641.291459065
Winsorized Mean ( 23 / 23 )99993.15492957750.428674381414688233261.326696467
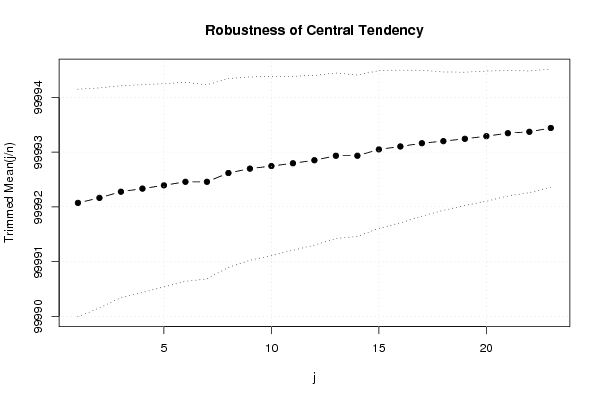
Trimmed Mean ( 1 / 23 )99992.07246376811.0381304184954396319.374408359
Trimmed Mean ( 2 / 23 )99992.16417910451.0041967600713399574.2748383315
Trimmed Mean ( 3 / 23 )99992.2769230770.966632659403174103443.925621978
Trimmed Mean ( 4 / 23 )99992.33333333330.948764254085824105392.180304770
Trimmed Mean ( 5 / 23 )99992.3934426230.926913524690343107876.722886342
Trimmed Mean ( 6 / 23 )99992.45762711860.908535418463878110058.9537788
Trimmed Mean ( 7 / 23 )99992.45762711860.885735348307715112892.025612576
Trimmed Mean ( 8 / 23 )99992.61818181820.861246027524388116102.269254283
Trimmed Mean ( 9 / 23 )99992.69811320750.836653480359498119515.068616271
Trimmed Mean ( 10 / 23 )99992.74509803920.817860977329973122261.298521028
Trimmed Mean ( 11 / 23 )99992.79591836740.793778739281923125970.614945953
Trimmed Mean ( 12 / 23 )99992.85106382980.774822783238105129052.543661589
Trimmed Mean ( 13 / 23 )99992.93333333330.755050336137274132432.142001131
Trimmed Mean ( 14 / 23 )99992.93333333330.736638078648347135742.281361303
Trimmed Mean ( 15 / 23 )99993.04878048780.719884153546296138901.583383801
Trimmed Mean ( 16 / 23 )99993.10256410260.69681642727939143499.921427671
Trimmed Mean ( 17 / 23 )99993.16216216220.664990588469509150367.785493474
Trimmed Mean ( 18 / 23 )99993.20.632189738564474158169.603048377
Trimmed Mean ( 19 / 23 )99993.24242424240.607762761216109164526.76735929
Trimmed Mean ( 20 / 23 )99993.29032258070.594225887296692168274.880748598
Trimmed Mean ( 21 / 23 )99993.34482758620.572944735660085174525.28770054
Trimmed Mean ( 22 / 23 )99993.37037037040.555080518653336180142.100128034
Trimmed Mean ( 23 / 23 )99993.440.538764017605729185597.843828494
Median99993
Midrange99988
Midmean - Weighted Average at Xnp99992.9722222222
Midmean - Weighted Average at X(n+1)p99993.9761904762
Midmean - Empirical Distribution Function99993.9761904762
Midmean - Empirical Distribution Function - Averaging99993.9761904762
Midmean - Empirical Distribution Function - Interpolation99993.2
Midmean - Closest Observation99992.9722222222
Midmean - True Basic - Statistics Graphics Toolkit99993.9761904762
Midmean - MS Excel (old versions)99993.9761904762
Number of observations71

\begin{tabular}{lllllllll}
\hline
Central Tendency - Ungrouped Data \tabularnewline
Measure & Value & S.E. & Value/S.E. \tabularnewline
Arithmetic Mean & 99991.9577464789 & 1.08129079650525 & 92474.6220624963 \tabularnewline
Geometric Mean & 99991.9573372161 &  &  \tabularnewline
Harmonic Mean & 99991.9569279402 &  &  \tabularnewline
Quadratic Mean & 99991.9581557282 &  &  \tabularnewline
Winsorized Mean ( 1 / 23 ) & 99991.985915493 & 1.06649974841950 & 93757.1584650403 \tabularnewline
Winsorized Mean ( 2 / 23 ) & 99991.9577464789 & 1.06138298977951 & 94209.1202792419 \tabularnewline
Winsorized Mean ( 3 / 23 ) & 99992.1267605634 & 1.00279881520100 & 99713.0483650613 \tabularnewline
Winsorized Mean ( 4 / 23 ) & 99992.1267605634 & 1.00279881520100 & 99713.0483650613 \tabularnewline
Winsorized Mean ( 5 / 23 ) & 99992.1267605634 & 0.976366519534917 & 102412.490350646 \tabularnewline
Winsorized Mean ( 6 / 23 ) & 99992.1267605634 & 0.976366519534917 & 102412.490350646 \tabularnewline
Winsorized Mean ( 7 / 23 ) & 99992.028169014 & 0.961213985724553 & 104026.813648203 \tabularnewline
Winsorized Mean ( 8 / 23 ) & 99992.1408450704 & 0.938189483473652 & 106579.89948347 \tabularnewline
Winsorized Mean ( 9 / 23 ) & 99992.3943661972 & 0.889572699005919 & 112404.972047745 \tabularnewline
Winsorized Mean ( 10 / 23 ) & 99992.3943661972 & 0.889572699005919 & 112404.972047745 \tabularnewline
Winsorized Mean ( 11 / 23 ) & 99992.3943661972 & 0.838336686358135 & 119274.744852906 \tabularnewline
Winsorized Mean ( 12 / 23 ) & 99992.2253521127 & 0.814406792568756 & 122779.213366729 \tabularnewline
Winsorized Mean ( 13 / 23 ) & 99992.4084507042 & 0.782241906520865 & 127827.987246854 \tabularnewline
Winsorized Mean ( 14 / 23 ) & 99992.6056338028 & 0.749105133007083 & 133482.739909162 \tabularnewline
Winsorized Mean ( 15 / 23 ) & 99992.6056338028 & 0.749105133007083 & 133482.739909162 \tabularnewline
Winsorized Mean ( 16 / 23 ) & 99992.6056338028 & 0.749105133007083 & 133482.739909162 \tabularnewline
Winsorized Mean ( 17 / 23 ) & 99992.8450704225 & 0.71055505475976 & 140724.978874762 \tabularnewline
Winsorized Mean ( 18 / 23 ) & 99992.8450704225 & 0.635200783327933 & 157419.272291419 \tabularnewline
Winsorized Mean ( 19 / 23 ) & 99992.8450704225 & 0.558327441670487 & 179093.552649408 \tabularnewline
Winsorized Mean ( 20 / 23 ) & 99992.8450704225 & 0.558327441670487 & 179093.552649408 \tabularnewline
Winsorized Mean ( 21 / 23 ) & 99993.1408450704 & 0.515082683541644 & 194130.270809203 \tabularnewline
Winsorized Mean ( 22 / 23 ) & 99992.8309859155 & 0.474706693513354 & 210641.291459065 \tabularnewline
Winsorized Mean ( 23 / 23 ) & 99993.1549295775 & 0.428674381414688 & 233261.326696467 \tabularnewline
Trimmed Mean ( 1 / 23 ) & 99992.0724637681 & 1.03813041849543 & 96319.374408359 \tabularnewline
Trimmed Mean ( 2 / 23 ) & 99992.1641791045 & 1.00419676007133 & 99574.2748383315 \tabularnewline
Trimmed Mean ( 3 / 23 ) & 99992.276923077 & 0.966632659403174 & 103443.925621978 \tabularnewline
Trimmed Mean ( 4 / 23 ) & 99992.3333333333 & 0.948764254085824 & 105392.180304770 \tabularnewline
Trimmed Mean ( 5 / 23 ) & 99992.393442623 & 0.926913524690343 & 107876.722886342 \tabularnewline
Trimmed Mean ( 6 / 23 ) & 99992.4576271186 & 0.908535418463878 & 110058.9537788 \tabularnewline
Trimmed Mean ( 7 / 23 ) & 99992.4576271186 & 0.885735348307715 & 112892.025612576 \tabularnewline
Trimmed Mean ( 8 / 23 ) & 99992.6181818182 & 0.861246027524388 & 116102.269254283 \tabularnewline
Trimmed Mean ( 9 / 23 ) & 99992.6981132075 & 0.836653480359498 & 119515.068616271 \tabularnewline
Trimmed Mean ( 10 / 23 ) & 99992.7450980392 & 0.817860977329973 & 122261.298521028 \tabularnewline
Trimmed Mean ( 11 / 23 ) & 99992.7959183674 & 0.793778739281923 & 125970.614945953 \tabularnewline
Trimmed Mean ( 12 / 23 ) & 99992.8510638298 & 0.774822783238105 & 129052.543661589 \tabularnewline
Trimmed Mean ( 13 / 23 ) & 99992.9333333333 & 0.755050336137274 & 132432.142001131 \tabularnewline
Trimmed Mean ( 14 / 23 ) & 99992.9333333333 & 0.736638078648347 & 135742.281361303 \tabularnewline
Trimmed Mean ( 15 / 23 ) & 99993.0487804878 & 0.719884153546296 & 138901.583383801 \tabularnewline
Trimmed Mean ( 16 / 23 ) & 99993.1025641026 & 0.69681642727939 & 143499.921427671 \tabularnewline
Trimmed Mean ( 17 / 23 ) & 99993.1621621622 & 0.664990588469509 & 150367.785493474 \tabularnewline
Trimmed Mean ( 18 / 23 ) & 99993.2 & 0.632189738564474 & 158169.603048377 \tabularnewline
Trimmed Mean ( 19 / 23 ) & 99993.2424242424 & 0.607762761216109 & 164526.76735929 \tabularnewline
Trimmed Mean ( 20 / 23 ) & 99993.2903225807 & 0.594225887296692 & 168274.880748598 \tabularnewline
Trimmed Mean ( 21 / 23 ) & 99993.3448275862 & 0.572944735660085 & 174525.28770054 \tabularnewline
Trimmed Mean ( 22 / 23 ) & 99993.3703703704 & 0.555080518653336 & 180142.100128034 \tabularnewline
Trimmed Mean ( 23 / 23 ) & 99993.44 & 0.538764017605729 & 185597.843828494 \tabularnewline
Median & 99993 &  &  \tabularnewline
Midrange & 99988 &  &  \tabularnewline
Midmean - Weighted Average at Xnp & 99992.9722222222 &  &  \tabularnewline
Midmean - Weighted Average at X(n+1)p & 99993.9761904762 &  &  \tabularnewline
Midmean - Empirical Distribution Function & 99993.9761904762 &  &  \tabularnewline
Midmean - Empirical Distribution Function - Averaging & 99993.9761904762 &  &  \tabularnewline
Midmean - Empirical Distribution Function - Interpolation & 99993.2 &  &  \tabularnewline
Midmean - Closest Observation & 99992.9722222222 &  &  \tabularnewline
Midmean - True Basic - Statistics Graphics Toolkit & 99993.9761904762 &  &  \tabularnewline
Midmean - MS Excel (old versions) & 99993.9761904762 &  &  \tabularnewline
Number of observations & 71 &  &  \tabularnewline
\hline
\end{tabular}
%Source: https://freestatistics.org/blog/index.php?pk=36085&T=1

[TABLE]
[ROW][C]Central Tendency - Ungrouped Data[/C][/ROW]
[ROW][C]Measure[/C][C]Value[/C][C]S.E.[/C][C]Value/S.E.[/C][/ROW]
[ROW][C]Arithmetic Mean[/C][C]99991.9577464789[/C][C]1.08129079650525[/C][C]92474.6220624963[/C][/ROW]
[ROW][C]Geometric Mean[/C][C]99991.9573372161[/C][C][/C][C][/C][/ROW]
[ROW][C]Harmonic Mean[/C][C]99991.9569279402[/C][C][/C][C][/C][/ROW]
[ROW][C]Quadratic Mean[/C][C]99991.9581557282[/C][C][/C][C][/C][/ROW]
[ROW][C]Winsorized Mean ( 1 / 23 )[/C][C]99991.985915493[/C][C]1.06649974841950[/C][C]93757.1584650403[/C][/ROW]
[ROW][C]Winsorized Mean ( 2 / 23 )[/C][C]99991.9577464789[/C][C]1.06138298977951[/C][C]94209.1202792419[/C][/ROW]
[ROW][C]Winsorized Mean ( 3 / 23 )[/C][C]99992.1267605634[/C][C]1.00279881520100[/C][C]99713.0483650613[/C][/ROW]
[ROW][C]Winsorized Mean ( 4 / 23 )[/C][C]99992.1267605634[/C][C]1.00279881520100[/C][C]99713.0483650613[/C][/ROW]
[ROW][C]Winsorized Mean ( 5 / 23 )[/C][C]99992.1267605634[/C][C]0.976366519534917[/C][C]102412.490350646[/C][/ROW]
[ROW][C]Winsorized Mean ( 6 / 23 )[/C][C]99992.1267605634[/C][C]0.976366519534917[/C][C]102412.490350646[/C][/ROW]
[ROW][C]Winsorized Mean ( 7 / 23 )[/C][C]99992.028169014[/C][C]0.961213985724553[/C][C]104026.813648203[/C][/ROW]
[ROW][C]Winsorized Mean ( 8 / 23 )[/C][C]99992.1408450704[/C][C]0.938189483473652[/C][C]106579.89948347[/C][/ROW]
[ROW][C]Winsorized Mean ( 9 / 23 )[/C][C]99992.3943661972[/C][C]0.889572699005919[/C][C]112404.972047745[/C][/ROW]
[ROW][C]Winsorized Mean ( 10 / 23 )[/C][C]99992.3943661972[/C][C]0.889572699005919[/C][C]112404.972047745[/C][/ROW]
[ROW][C]Winsorized Mean ( 11 / 23 )[/C][C]99992.3943661972[/C][C]0.838336686358135[/C][C]119274.744852906[/C][/ROW]
[ROW][C]Winsorized Mean ( 12 / 23 )[/C][C]99992.2253521127[/C][C]0.814406792568756[/C][C]122779.213366729[/C][/ROW]
[ROW][C]Winsorized Mean ( 13 / 23 )[/C][C]99992.4084507042[/C][C]0.782241906520865[/C][C]127827.987246854[/C][/ROW]
[ROW][C]Winsorized Mean ( 14 / 23 )[/C][C]99992.6056338028[/C][C]0.749105133007083[/C][C]133482.739909162[/C][/ROW]
[ROW][C]Winsorized Mean ( 15 / 23 )[/C][C]99992.6056338028[/C][C]0.749105133007083[/C][C]133482.739909162[/C][/ROW]
[ROW][C]Winsorized Mean ( 16 / 23 )[/C][C]99992.6056338028[/C][C]0.749105133007083[/C][C]133482.739909162[/C][/ROW]
[ROW][C]Winsorized Mean ( 17 / 23 )[/C][C]99992.8450704225[/C][C]0.71055505475976[/C][C]140724.978874762[/C][/ROW]
[ROW][C]Winsorized Mean ( 18 / 23 )[/C][C]99992.8450704225[/C][C]0.635200783327933[/C][C]157419.272291419[/C][/ROW]
[ROW][C]Winsorized Mean ( 19 / 23 )[/C][C]99992.8450704225[/C][C]0.558327441670487[/C][C]179093.552649408[/C][/ROW]
[ROW][C]Winsorized Mean ( 20 / 23 )[/C][C]99992.8450704225[/C][C]0.558327441670487[/C][C]179093.552649408[/C][/ROW]
[ROW][C]Winsorized Mean ( 21 / 23 )[/C][C]99993.1408450704[/C][C]0.515082683541644[/C][C]194130.270809203[/C][/ROW]
[ROW][C]Winsorized Mean ( 22 / 23 )[/C][C]99992.8309859155[/C][C]0.474706693513354[/C][C]210641.291459065[/C][/ROW]
[ROW][C]Winsorized Mean ( 23 / 23 )[/C][C]99993.1549295775[/C][C]0.428674381414688[/C][C]233261.326696467[/C][/ROW]
[ROW][C]Trimmed Mean ( 1 / 23 )[/C][C]99992.0724637681[/C][C]1.03813041849543[/C][C]96319.374408359[/C][/ROW]
[ROW][C]Trimmed Mean ( 2 / 23 )[/C][C]99992.1641791045[/C][C]1.00419676007133[/C][C]99574.2748383315[/C][/ROW]
[ROW][C]Trimmed Mean ( 3 / 23 )[/C][C]99992.276923077[/C][C]0.966632659403174[/C][C]103443.925621978[/C][/ROW]
[ROW][C]Trimmed Mean ( 4 / 23 )[/C][C]99992.3333333333[/C][C]0.948764254085824[/C][C]105392.180304770[/C][/ROW]
[ROW][C]Trimmed Mean ( 5 / 23 )[/C][C]99992.393442623[/C][C]0.926913524690343[/C][C]107876.722886342[/C][/ROW]
[ROW][C]Trimmed Mean ( 6 / 23 )[/C][C]99992.4576271186[/C][C]0.908535418463878[/C][C]110058.9537788[/C][/ROW]
[ROW][C]Trimmed Mean ( 7 / 23 )[/C][C]99992.4576271186[/C][C]0.885735348307715[/C][C]112892.025612576[/C][/ROW]
[ROW][C]Trimmed Mean ( 8 / 23 )[/C][C]99992.6181818182[/C][C]0.861246027524388[/C][C]116102.269254283[/C][/ROW]
[ROW][C]Trimmed Mean ( 9 / 23 )[/C][C]99992.6981132075[/C][C]0.836653480359498[/C][C]119515.068616271[/C][/ROW]
[ROW][C]Trimmed Mean ( 10 / 23 )[/C][C]99992.7450980392[/C][C]0.817860977329973[/C][C]122261.298521028[/C][/ROW]
[ROW][C]Trimmed Mean ( 11 / 23 )[/C][C]99992.7959183674[/C][C]0.793778739281923[/C][C]125970.614945953[/C][/ROW]
[ROW][C]Trimmed Mean ( 12 / 23 )[/C][C]99992.8510638298[/C][C]0.774822783238105[/C][C]129052.543661589[/C][/ROW]
[ROW][C]Trimmed Mean ( 13 / 23 )[/C][C]99992.9333333333[/C][C]0.755050336137274[/C][C]132432.142001131[/C][/ROW]
[ROW][C]Trimmed Mean ( 14 / 23 )[/C][C]99992.9333333333[/C][C]0.736638078648347[/C][C]135742.281361303[/C][/ROW]
[ROW][C]Trimmed Mean ( 15 / 23 )[/C][C]99993.0487804878[/C][C]0.719884153546296[/C][C]138901.583383801[/C][/ROW]
[ROW][C]Trimmed Mean ( 16 / 23 )[/C][C]99993.1025641026[/C][C]0.69681642727939[/C][C]143499.921427671[/C][/ROW]
[ROW][C]Trimmed Mean ( 17 / 23 )[/C][C]99993.1621621622[/C][C]0.664990588469509[/C][C]150367.785493474[/C][/ROW]
[ROW][C]Trimmed Mean ( 18 / 23 )[/C][C]99993.2[/C][C]0.632189738564474[/C][C]158169.603048377[/C][/ROW]
[ROW][C]Trimmed Mean ( 19 / 23 )[/C][C]99993.2424242424[/C][C]0.607762761216109[/C][C]164526.76735929[/C][/ROW]
[ROW][C]Trimmed Mean ( 20 / 23 )[/C][C]99993.2903225807[/C][C]0.594225887296692[/C][C]168274.880748598[/C][/ROW]
[ROW][C]Trimmed Mean ( 21 / 23 )[/C][C]99993.3448275862[/C][C]0.572944735660085[/C][C]174525.28770054[/C][/ROW]
[ROW][C]Trimmed Mean ( 22 / 23 )[/C][C]99993.3703703704[/C][C]0.555080518653336[/C][C]180142.100128034[/C][/ROW]
[ROW][C]Trimmed Mean ( 23 / 23 )[/C][C]99993.44[/C][C]0.538764017605729[/C][C]185597.843828494[/C][/ROW]
[ROW][C]Median[/C][C]99993[/C][C][/C][C][/C][/ROW]
[ROW][C]Midrange[/C][C]99988[/C][C][/C][C][/C][/ROW]
[ROW][C]Midmean - Weighted Average at Xnp[/C][C]99992.9722222222[/C][C][/C][C][/C][/ROW]
[ROW][C]Midmean - Weighted Average at X(n+1)p[/C][C]99993.9761904762[/C][C][/C][C][/C][/ROW]
[ROW][C]Midmean - Empirical Distribution Function[/C][C]99993.9761904762[/C][C][/C][C][/C][/ROW]
[ROW][C]Midmean - Empirical Distribution Function - Averaging[/C][C]99993.9761904762[/C][C][/C][C][/C][/ROW]
[ROW][C]Midmean - Empirical Distribution Function - Interpolation[/C][C]99993.2[/C][C][/C][C][/C][/ROW]
[ROW][C]Midmean - Closest Observation[/C][C]99992.9722222222[/C][C][/C][C][/C][/ROW]
[ROW][C]Midmean - True Basic - Statistics Graphics Toolkit[/C][C]99993.9761904762[/C][C][/C][C][/C][/ROW]
[ROW][C]Midmean - MS Excel (old versions)[/C][C]99993.9761904762[/C][C][/C][C][/C][/ROW]
[ROW][C]Number of observations[/C][C]71[/C][C][/C][C][/C][/ROW]
[/TABLE]
Source: https://freestatistics.org/blog/index.php?pk=36085&T=1

Globally Unique Identifier (entire table): ba.freestatistics.org/blog/index.php?pk=36085&T=1

As an alternative you can also use a QR Code:  

The GUIDs for individual cells are displayed in the table below:

Central Tendency - Ungrouped Data
MeasureValueS.E.Value/S.E.
Arithmetic Mean99991.95774647891.0812907965052592474.6220624963
Geometric Mean99991.9573372161
Harmonic Mean99991.9569279402
Quadratic Mean99991.9581557282
Winsorized Mean ( 1 / 23 )99991.9859154931.0664997484195093757.1584650403
Winsorized Mean ( 2 / 23 )99991.95774647891.0613829897795194209.1202792419
Winsorized Mean ( 3 / 23 )99992.12676056341.0027988152010099713.0483650613
Winsorized Mean ( 4 / 23 )99992.12676056341.0027988152010099713.0483650613
Winsorized Mean ( 5 / 23 )99992.12676056340.976366519534917102412.490350646
Winsorized Mean ( 6 / 23 )99992.12676056340.976366519534917102412.490350646
Winsorized Mean ( 7 / 23 )99992.0281690140.961213985724553104026.813648203
Winsorized Mean ( 8 / 23 )99992.14084507040.938189483473652106579.89948347
Winsorized Mean ( 9 / 23 )99992.39436619720.889572699005919112404.972047745
Winsorized Mean ( 10 / 23 )99992.39436619720.889572699005919112404.972047745
Winsorized Mean ( 11 / 23 )99992.39436619720.838336686358135119274.744852906
Winsorized Mean ( 12 / 23 )99992.22535211270.814406792568756122779.213366729
Winsorized Mean ( 13 / 23 )99992.40845070420.782241906520865127827.987246854
Winsorized Mean ( 14 / 23 )99992.60563380280.749105133007083133482.739909162
Winsorized Mean ( 15 / 23 )99992.60563380280.749105133007083133482.739909162
Winsorized Mean ( 16 / 23 )99992.60563380280.749105133007083133482.739909162
Winsorized Mean ( 17 / 23 )99992.84507042250.71055505475976140724.978874762
Winsorized Mean ( 18 / 23 )99992.84507042250.635200783327933157419.272291419
Winsorized Mean ( 19 / 23 )99992.84507042250.558327441670487179093.552649408
Winsorized Mean ( 20 / 23 )99992.84507042250.558327441670487179093.552649408
Winsorized Mean ( 21 / 23 )99993.14084507040.515082683541644194130.270809203
Winsorized Mean ( 22 / 23 )99992.83098591550.474706693513354210641.291459065
Winsorized Mean ( 23 / 23 )99993.15492957750.428674381414688233261.326696467
Trimmed Mean ( 1 / 23 )99992.07246376811.0381304184954396319.374408359
Trimmed Mean ( 2 / 23 )99992.16417910451.0041967600713399574.2748383315
Trimmed Mean ( 3 / 23 )99992.2769230770.966632659403174103443.925621978
Trimmed Mean ( 4 / 23 )99992.33333333330.948764254085824105392.180304770
Trimmed Mean ( 5 / 23 )99992.3934426230.926913524690343107876.722886342
Trimmed Mean ( 6 / 23 )99992.45762711860.908535418463878110058.9537788
Trimmed Mean ( 7 / 23 )99992.45762711860.885735348307715112892.025612576
Trimmed Mean ( 8 / 23 )99992.61818181820.861246027524388116102.269254283
Trimmed Mean ( 9 / 23 )99992.69811320750.836653480359498119515.068616271
Trimmed Mean ( 10 / 23 )99992.74509803920.817860977329973122261.298521028
Trimmed Mean ( 11 / 23 )99992.79591836740.793778739281923125970.614945953
Trimmed Mean ( 12 / 23 )99992.85106382980.774822783238105129052.543661589
Trimmed Mean ( 13 / 23 )99992.93333333330.755050336137274132432.142001131
Trimmed Mean ( 14 / 23 )99992.93333333330.736638078648347135742.281361303
Trimmed Mean ( 15 / 23 )99993.04878048780.719884153546296138901.583383801
Trimmed Mean ( 16 / 23 )99993.10256410260.69681642727939143499.921427671
Trimmed Mean ( 17 / 23 )99993.16216216220.664990588469509150367.785493474
Trimmed Mean ( 18 / 23 )99993.20.632189738564474158169.603048377
Trimmed Mean ( 19 / 23 )99993.24242424240.607762761216109164526.76735929
Trimmed Mean ( 20 / 23 )99993.29032258070.594225887296692168274.880748598
Trimmed Mean ( 21 / 23 )99993.34482758620.572944735660085174525.28770054
Trimmed Mean ( 22 / 23 )99993.37037037040.555080518653336180142.100128034
Trimmed Mean ( 23 / 23 )99993.440.538764017605729185597.843828494
Median99993
Midrange99988
Midmean - Weighted Average at Xnp99992.9722222222
Midmean - Weighted Average at X(n+1)p99993.9761904762
Midmean - Empirical Distribution Function99993.9761904762
Midmean - Empirical Distribution Function - Averaging99993.9761904762
Midmean - Empirical Distribution Function - Interpolation99993.2
Midmean - Closest Observation99992.9722222222
Midmean - True Basic - Statistics Graphics Toolkit99993.9761904762
Midmean - MS Excel (old versions)99993.9761904762
Number of observations71


Parameters (Session):
Parameters (R input):
R code (references can be found in the software module):
geomean <- function(x) {
return(exp(mean(log(x))))
}
harmean <- function(x) {
return(1/mean(1/x))
}
quamean <- function(x) {
return(sqrt(mean(x*x)))
}
winmean <- function(x) {
x <-sort(x[!is.na(x)])
n<-length(x)
denom <- 3
nodenom <- n/denom
if (nodenom>40) denom <- n/40
sqrtn = sqrt(n)
roundnodenom = floor(nodenom)
win <- array(NA,dim=c(roundnodenom,2))
for (j in 1:roundnodenom) {
win[j,1] <- (j*x[j+1]+sum(x[(j+1):(n-j)])+j*x[n-j])/n
win[j,2] <- sd(c(rep(x[j+1],j),x[(j+1):(n-j)],rep(x[n-j],j)))/sqrtn
}
return(win)
}
trimean <- function(x) {
x <-sort(x[!is.na(x)])
n<-length(x)
denom <- 3
nodenom <- n/denom
if (nodenom>40) denom <- n/40
sqrtn = sqrt(n)
roundnodenom = floor(nodenom)
tri <- array(NA,dim=c(roundnodenom,2))
for (j in 1:roundnodenom) {
tri[j,1] <- mean(x,trim=j/n)
tri[j,2] <- sd(x[(j+1):(n-j)]) / sqrt(n-j*2)
}
return(tri)
}
midrange <- function(x) {
return((max(x)+min(x))/2)
}
q1 <- function(data,n,p,i,f) {
np <- n*p;
i <<- floor(np)
f <<- np - i
qvalue <- (1-f)*data[i] + f*data[i+1]
}
q2 <- function(data,n,p,i,f) {
np <- (n+1)*p
i <<- floor(np)
f <<- np - i
qvalue <- (1-f)*data[i] + f*data[i+1]
}
q3 <- function(data,n,p,i,f) {
np <- n*p
i <<- floor(np)
f <<- np - i
if (f==0) {
qvalue <- data[i]
} else {
qvalue <- data[i+1]
}
}
q4 <- function(data,n,p,i,f) {
np <- n*p
i <<- floor(np)
f <<- np - i
if (f==0) {
qvalue <- (data[i]+data[i+1])/2
} else {
qvalue <- data[i+1]
}
}
q5 <- function(data,n,p,i,f) {
np <- (n-1)*p
i <<- floor(np)
f <<- np - i
if (f==0) {
qvalue <- data[i+1]
} else {
qvalue <- data[i+1] + f*(data[i+2]-data[i+1])
}
}
q6 <- function(data,n,p,i,f) {
np <- n*p+0.5
i <<- floor(np)
f <<- np - i
qvalue <- data[i]
}
q7 <- function(data,n,p,i,f) {
np <- (n+1)*p
i <<- floor(np)
f <<- np - i
if (f==0) {
qvalue <- data[i]
} else {
qvalue <- f*data[i] + (1-f)*data[i+1]
}
}
q8 <- function(data,n,p,i,f) {
np <- (n+1)*p
i <<- floor(np)
f <<- np - i
if (f==0) {
qvalue <- data[i]
} else {
if (f == 0.5) {
qvalue <- (data[i]+data[i+1])/2
} else {
if (f < 0.5) {
qvalue <- data[i]
} else {
qvalue <- data[i+1]
}
}
}
}
midmean <- function(x,def) {
x <-sort(x[!is.na(x)])
n<-length(x)
if (def==1) {
qvalue1 <- q1(x,n,0.25,i,f)
qvalue3 <- q1(x,n,0.75,i,f)
}
if (def==2) {
qvalue1 <- q2(x,n,0.25,i,f)
qvalue3 <- q2(x,n,0.75,i,f)
}
if (def==3) {
qvalue1 <- q3(x,n,0.25,i,f)
qvalue3 <- q3(x,n,0.75,i,f)
}
if (def==4) {
qvalue1 <- q4(x,n,0.25,i,f)
qvalue3 <- q4(x,n,0.75,i,f)
}
if (def==5) {
qvalue1 <- q5(x,n,0.25,i,f)
qvalue3 <- q5(x,n,0.75,i,f)
}
if (def==6) {
qvalue1 <- q6(x,n,0.25,i,f)
qvalue3 <- q6(x,n,0.75,i,f)
}
if (def==7) {
qvalue1 <- q7(x,n,0.25,i,f)
qvalue3 <- q7(x,n,0.75,i,f)
}
if (def==8) {
qvalue1 <- q8(x,n,0.25,i,f)
qvalue3 <- q8(x,n,0.75,i,f)
}
midm <- 0
myn <- 0
roundno4 <- round(n/4)
round3no4 <- round(3*n/4)
for (i in 1:n) {
if ((x[i]>=qvalue1) & (x[i]<=qvalue3)){
midm = midm + x[i]
myn = myn + 1
}
}
midm = midm / myn
return(midm)
}
(arm <- mean(x))
sqrtn <- sqrt(length(x))
(armse <- sd(x) / sqrtn)
(armose <- arm / armse)
(geo <- geomean(x))
(har <- harmean(x))
(qua <- quamean(x))
(win <- winmean(x))
(tri <- trimean(x))
(midr <- midrange(x))
midm <- array(NA,dim=8)
for (j in 1:8) midm[j] <- midmean(x,j)
midm
bitmap(file='test1.png')
lb <- win[,1] - 2*win[,2]
ub <- win[,1] + 2*win[,2]
if ((ylimmin == '') | (ylimmax == '')) plot(win[,1],type='b',main=main, xlab='j', pch=19, ylab='Winsorized Mean(j/n)', ylim=c(min(lb),max(ub))) else plot(win[,1],type='l',main=main, xlab='j', pch=19, ylab='Winsorized Mean(j/n)', ylim=c(ylimmin,ylimmax))
lines(ub,lty=3)
lines(lb,lty=3)
grid()
dev.off()
bitmap(file='test2.png')
lb <- tri[,1] - 2*tri[,2]
ub <- tri[,1] + 2*tri[,2]
if ((ylimmin == '') | (ylimmax == '')) plot(tri[,1],type='b',main=main, xlab='j', pch=19, ylab='Trimmed Mean(j/n)', ylim=c(min(lb),max(ub))) else plot(tri[,1],type='l',main=main, xlab='j', pch=19, ylab='Trimmed Mean(j/n)', ylim=c(ylimmin,ylimmax))
lines(ub,lty=3)
lines(lb,lty=3)
grid()
dev.off()
load(file='createtable')
a<-table.start()
a<-table.row.start(a)
a<-table.element(a,'Central Tendency - Ungrouped Data',4,TRUE)
a<-table.row.end(a)
a<-table.row.start(a)
a<-table.element(a,'Measure',header=TRUE)
a<-table.element(a,'Value',header=TRUE)
a<-table.element(a,'S.E.',header=TRUE)
a<-table.element(a,'Value/S.E.',header=TRUE)
a<-table.row.end(a)
a<-table.row.start(a)
a<-table.element(a,hyperlink('arithmetic_mean.htm', 'Arithmetic Mean', 'click to view the definition of the Arithmetic Mean'),header=TRUE)
a<-table.element(a,arm)
a<-table.element(a,hyperlink('arithmetic_mean_standard_error.htm', armse, 'click to view the definition of the Standard Error of the Arithmetic Mean'))
a<-table.element(a,armose)
a<-table.row.end(a)
a<-table.row.start(a)
a<-table.element(a,hyperlink('geometric_mean.htm', 'Geometric Mean', 'click to view the definition of the Geometric Mean'),header=TRUE)
a<-table.element(a,geo)
a<-table.element(a,'')
a<-table.row.end(a)
a<-table.row.start(a)
a<-table.element(a,hyperlink('harmonic_mean.htm', 'Harmonic Mean', 'click to view the definition of the Harmonic Mean'),header=TRUE)
a<-table.element(a,har)
a<-table.element(a,'')
a<-table.row.end(a)
a<-table.row.start(a)
a<-table.element(a,hyperlink('quadratic_mean.htm', 'Quadratic Mean', 'click to view the definition of the Quadratic Mean'),header=TRUE)
a<-table.element(a,qua)
a<-table.element(a,'')
a<-table.row.end(a)
for (j in 1:length(win[,1])) {
a<-table.row.start(a)
mylabel <- paste('Winsorized Mean (',j)
mylabel <- paste(mylabel,'/')
mylabel <- paste(mylabel,length(win[,1]))
mylabel <- paste(mylabel,')')
a<-table.element(a,hyperlink('winsorized_mean.htm', mylabel, 'click to view the definition of the Winsorized Mean'),header=TRUE)
a<-table.element(a,win[j,1])
a<-table.element(a,win[j,2])
a<-table.element(a,win[j,1]/win[j,2])
a<-table.row.end(a)
}
for (j in 1:length(tri[,1])) {
a<-table.row.start(a)
mylabel <- paste('Trimmed Mean (',j)
mylabel <- paste(mylabel,'/')
mylabel <- paste(mylabel,length(tri[,1]))
mylabel <- paste(mylabel,')')
a<-table.element(a,hyperlink('arithmetic_mean.htm', mylabel, 'click to view the definition of the Trimmed Mean'),header=TRUE)
a<-table.element(a,tri[j,1])
a<-table.element(a,tri[j,2])
a<-table.element(a,tri[j,1]/tri[j,2])
a<-table.row.end(a)
}
a<-table.row.start(a)
a<-table.element(a,hyperlink('median_1.htm', 'Median', 'click to view the definition of the Median'),header=TRUE)
a<-table.element(a,median(x))
a<-table.element(a,'')
a<-table.row.end(a)
a<-table.row.start(a)
a<-table.element(a,hyperlink('midrange.htm', 'Midrange', 'click to view the definition of the Midrange'),header=TRUE)
a<-table.element(a,midr)
a<-table.element(a,'')
a<-table.row.end(a)
a<-table.row.start(a)
mymid <- hyperlink('midmean.htm', 'Midmean', 'click to view the definition of the Midmean')
mylabel <- paste(mymid,hyperlink('method_1.htm','Weighted Average at Xnp',''),sep=' - ')
a<-table.element(a,mylabel,header=TRUE)
a<-table.element(a,midm[1])
a<-table.element(a,'')
a<-table.row.end(a)
a<-table.row.start(a)
mymid <- hyperlink('midmean.htm', 'Midmean', 'click to view the definition of the Midmean')
mylabel <- paste(mymid,hyperlink('method_2.htm','Weighted Average at X(n+1)p',''),sep=' - ')
a<-table.element(a,mylabel,header=TRUE)
a<-table.element(a,midm[2])
a<-table.element(a,'')
a<-table.row.end(a)
a<-table.row.start(a)
mymid <- hyperlink('midmean.htm', 'Midmean', 'click to view the definition of the Midmean')
mylabel <- paste(mymid,hyperlink('method_3.htm','Empirical Distribution Function',''),sep=' - ')
a<-table.element(a,mylabel,header=TRUE)
a<-table.element(a,midm[3])
a<-table.element(a,'')
a<-table.row.end(a)
a<-table.row.start(a)
mymid <- hyperlink('midmean.htm', 'Midmean', 'click to view the definition of the Midmean')
mylabel <- paste(mymid,hyperlink('method_4.htm','Empirical Distribution Function - Averaging',''),sep=' - ')
a<-table.element(a,mylabel,header=TRUE)
a<-table.element(a,midm[4])
a<-table.element(a,'')
a<-table.row.end(a)
a<-table.row.start(a)
mymid <- hyperlink('midmean.htm', 'Midmean', 'click to view the definition of the Midmean')
mylabel <- paste(mymid,hyperlink('method_5.htm','Empirical Distribution Function - Interpolation',''),sep=' - ')
a<-table.element(a,mylabel,header=TRUE)
a<-table.element(a,midm[5])
a<-table.element(a,'')
a<-table.row.end(a)
a<-table.row.start(a)
mymid <- hyperlink('midmean.htm', 'Midmean', 'click to view the definition of the Midmean')
mylabel <- paste(mymid,hyperlink('method_6.htm','Closest Observation',''),sep=' - ')
a<-table.element(a,mylabel,header=TRUE)
a<-table.element(a,midm[6])
a<-table.element(a,'')
a<-table.row.end(a)
a<-table.row.start(a)
mymid <- hyperlink('midmean.htm', 'Midmean', 'click to view the definition of the Midmean')
mylabel <- paste(mymid,hyperlink('method_7.htm','True Basic - Statistics Graphics Toolkit',''),sep=' - ')
a<-table.element(a,mylabel,header=TRUE)
a<-table.element(a,midm[7])
a<-table.element(a,'')
a<-table.row.end(a)
a<-table.row.start(a)
mymid <- hyperlink('midmean.htm', 'Midmean', 'click to view the definition of the Midmean')
mylabel <- paste(mymid,hyperlink('method_8.htm','MS Excel (old versions)',''),sep=' - ')
a<-table.element(a,mylabel,header=TRUE)
a<-table.element(a,midm[8])
a<-table.element(a,'')
a<-table.row.end(a)
a<-table.row.start(a)
a<-table.element(a,'Number of observations',header=TRUE)
a<-table.element(a,length(x))
a<-table.element(a,'')
a<-table.row.end(a)
a<-table.end(a)
table.save(a,file='mytable.tab')