Free Statistics

of Irreproducible Research!

Author's title

Author*The author of this computation has been verified*
R Software Modulerwasp_centraltendency.wasp
Title produced by softwareCentral Tendency
Date of computationMon, 22 Dec 2008 07:20:20 -0700
Cite this page as followsStatistical Computations at FreeStatistics.org, Office for Research Development and Education, URL https://freestatistics.org/blog/index.php?v=date/2008/Dec/22/t1229955666pl413ybgmbx41c2.htm/, Retrieved Sun, 12 May 2024 19:19:03 +0000
Statistical Computations at FreeStatistics.org, Office for Research Development and Education, URL https://freestatistics.org/blog/index.php?pk=36081, Retrieved Sun, 12 May 2024 19:19:03 +0000
QR Codes:

Original text written by user:
IsPrivate?No (this computation is public)
User-defined keywords2
Estimated Impact140
Family? (F = Feedback message, R = changed R code, M = changed R Module, P = changed Parameters, D = changed Data)
-     [Univariate Data Series] [Niet werkende wer...] [2008-10-13 17:04:19] [fe7291e888d31b8c4db0b24d6c0f75c6]
F RMPD  [Central Tendency] [Q9: Make a predic...] [2008-10-20 20:40:16] [fe7291e888d31b8c4db0b24d6c0f75c6]
-    D      [Central Tendency] [2] [2008-12-22 14:20:20] [783db4b4a0f63b73ca8b14666b7f4329] [Current]
Feedback Forum

Post a new message
Dataseries X:
244752
244576
241572
240541
236089
236997
264579
270349
269645
267037
258113
262813
267413
267366
264777
258863
254844
254868
277267
285351
286602
283042
276687
277915
277128
277103
275037
270150
267140
264993
287259
291186
292300
288186
281477
282656
280190
280408
276836
275216
274352
271311
289802
290726
292300
278506
269826
265861
269034
264176
255198
253353
246057
235372
258556
260993
254663
250643
243422
247105
248541
245039
237080
237085
225554
226839
247934
248333
246969
245098
246263


Summary of computational transaction
Raw Inputview raw input (R code)
Raw Outputview raw output of R engine
Computing time1 seconds
R Server'Gwilym Jenkins' @ 72.249.127.135

\begin{tabular}{lllllllll}
\hline
Summary of computational transaction \tabularnewline
Raw Input & view raw input (R code)  \tabularnewline
Raw Output & view raw output of R engine  \tabularnewline
Computing time & 1 seconds \tabularnewline
R Server & 'Gwilym Jenkins' @ 72.249.127.135 \tabularnewline
\hline
\end{tabular}
%Source: https://freestatistics.org/blog/index.php?pk=36081&T=0

[TABLE]
[ROW][C]Summary of computational transaction[/C][/ROW]
[ROW][C]Raw Input[/C][C]view raw input (R code) [/C][/ROW]
[ROW][C]Raw Output[/C][C]view raw output of R engine [/C][/ROW]
[ROW][C]Computing time[/C][C]1 seconds[/C][/ROW]
[ROW][C]R Server[/C][C]'Gwilym Jenkins' @ 72.249.127.135[/C][/ROW]
[/TABLE]
Source: https://freestatistics.org/blog/index.php?pk=36081&T=0

Globally Unique Identifier (entire table): ba.freestatistics.org/blog/index.php?pk=36081&T=0

As an alternative you can also use a QR Code:  

The GUIDs for individual cells are displayed in the table below:

Summary of computational transaction
Raw Inputview raw input (R code)
Raw Outputview raw output of R engine
Computing time1 seconds
R Server'Gwilym Jenkins' @ 72.249.127.135


Central Tendency - Ungrouped Data
MeasureValueS.E.Value/S.E.
Arithmetic Mean263173.4366197182077.17876796812126.697538352538
Geometric Mean262593.526084463
Harmonic Mean262008.048355015
Quadratic Mean263746.629848838
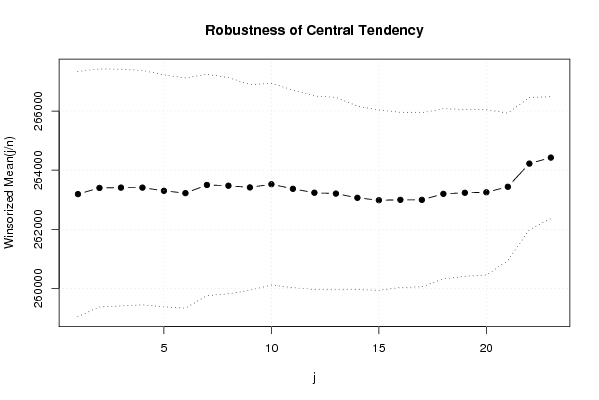
Winsorized Mean ( 1 / 23 )263191.5352112682072.56992259287126.988012487417
Winsorized Mean ( 2 / 23 )263400.5211267612012.20507411782130.901429737344
Winsorized Mean ( 3 / 23 )263411.380281692002.42706349424131.546054827104
Winsorized Mean ( 4 / 23 )263410.4788732391982.55027322356132.864463731829
Winsorized Mean ( 5 / 23 )263302.5211267611960.29331058513134.317920540252
Winsorized Mean ( 6 / 23 )263224.6056338031946.19862395772135.250638035351
Winsorized Mean ( 7 / 23 )263500.5633802821872.18494049102140.744943344739
Winsorized Mean ( 8 / 23 )263475.7746478871827.58159065523144.166354046840
Winsorized Mean ( 9 / 23 )263417.5915492961739.58772962023151.425298686605
Winsorized Mean ( 10 / 23 )263525.760563381704.59316038771154.597452745523
Winsorized Mean ( 11 / 23 )263370.3661971831671.47708592984157.567440447842
Winsorized Mean ( 12 / 23 )263238.1971830991636.23687100496160.880250193494
Winsorized Mean ( 13 / 23 )263209.0845070421628.55580535810161.621163758134
Winsorized Mean ( 14 / 23 )263066.1267605631550.33116238116169.683828296735
Winsorized Mean ( 15 / 23 )262984.7887323941525.90431912125172.346840779535
Winsorized Mean ( 16 / 23 )262997.8591549301480.88954686648177.594513859204
Winsorized Mean ( 17 / 23 )262997.1408450701471.28570518304178.753276755551
Winsorized Mean ( 18 / 23 )263200.9718309861438.25966570180182.999619684501
Winsorized Mean ( 19 / 23 )263236.2957746481412.26728941025186.392687665076
Winsorized Mean ( 20 / 23 )263252.9154929581397.67697090155188.350327703512
Winsorized Mean ( 21 / 23 )263439.5492957751245.98689817269211.430432921986
Winsorized Mean ( 22 / 23 )264223.8028169011118.33419210866236.265514084568
Winsorized Mean ( 23 / 23 )264426.2676056341029.48389209721256.853234553246
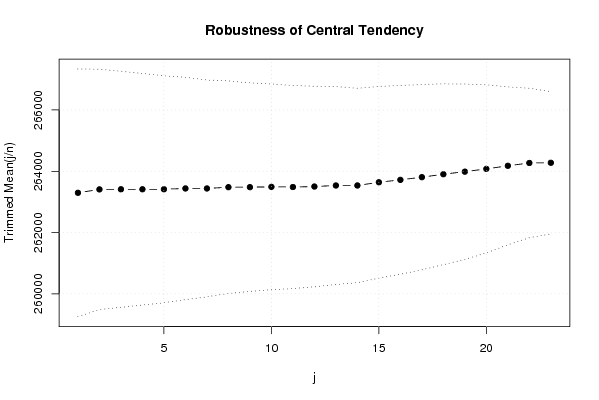
Trimmed Mean ( 1 / 23 )263296.5217391302021.79587525899130.229032990485
Trimmed Mean ( 2 / 23 )263407.7761194031961.18555047054134.310481767625
Trimmed Mean ( 3 / 23 )263411.7384615381927.18884963368136.681850619678
Trimmed Mean ( 4 / 23 )263411.8730158731890.35574971142139.345132817506
Trimmed Mean ( 5 / 23 )263412.2786885251852.75539129222142.17326255076
Trimmed Mean ( 6 / 23 )263438.6949152541813.68619513114145.250427346505
Trimmed Mean ( 7 / 23 )263438.6949152541769.49286775809148.878076716424
Trimmed Mean ( 8 / 23 )263479.9272727271734.34926964774151.918608254866
Trimmed Mean ( 9 / 23 )263480.6226415091701.12252920845154.886328361138
Trimmed Mean ( 10 / 23 )263490.3725490201679.21098954843156.913201610166
Trimmed Mean ( 11 / 23 )263485.2448979591657.96435060172158.920935062527
Trimmed Mean ( 12 / 23 )263501.0212765961636.57262954491161.007838283272
Trimmed Mean ( 13 / 23 )263535.5777777781614.93815483076163.186173408229
Trimmed Mean ( 14 / 23 )263535.5777777781586.64519000751166.096099769181
Trimmed Mean ( 15 / 23 )263640.2439024391564.95783305637168.464758815608
Trimmed Mean ( 16 / 23 )263719.7948717951539.08338003974171.348608068905
Trimmed Mean ( 17 / 23 )263806.3783783781512.24610821746174.446723284570
Trimmed Mean ( 18 / 23 )263902.9428571431475.11776994180178.902965061260
Trimmed Mean ( 19 / 23 )263986.8484848491430.16946053103184.584313796512
Trimmed Mean ( 20 / 23 )264077.3225806451371.57346608757192.536039162327
Trimmed Mean ( 21 / 23 )264178.241379311288.85530383537204.971217942906
Trimmed Mean ( 22 / 23 )264270.7407407411219.25803017181216.747180827262
Trimmed Mean ( 23 / 23 )264276.81160.80141999683227.667536796019
Median264993
Midrange258927
Midmean - Weighted Average at Xnp263436.333333333
Midmean - Weighted Average at X(n+1)p263806.378378378
Midmean - Empirical Distribution Function263806.378378378
Midmean - Empirical Distribution Function - Averaging263806.378378378
Midmean - Empirical Distribution Function - Interpolation263902.942857143
Midmean - Closest Observation263436.333333333
Midmean - True Basic - Statistics Graphics Toolkit263806.378378378
Midmean - MS Excel (old versions)263806.378378378
Number of observations71

\begin{tabular}{lllllllll}
\hline
Central Tendency - Ungrouped Data \tabularnewline
Measure & Value & S.E. & Value/S.E. \tabularnewline
Arithmetic Mean & 263173.436619718 & 2077.17876796812 & 126.697538352538 \tabularnewline
Geometric Mean & 262593.526084463 &  &  \tabularnewline
Harmonic Mean & 262008.048355015 &  &  \tabularnewline
Quadratic Mean & 263746.629848838 &  &  \tabularnewline
Winsorized Mean ( 1 / 23 ) & 263191.535211268 & 2072.56992259287 & 126.988012487417 \tabularnewline
Winsorized Mean ( 2 / 23 ) & 263400.521126761 & 2012.20507411782 & 130.901429737344 \tabularnewline
Winsorized Mean ( 3 / 23 ) & 263411.38028169 & 2002.42706349424 & 131.546054827104 \tabularnewline
Winsorized Mean ( 4 / 23 ) & 263410.478873239 & 1982.55027322356 & 132.864463731829 \tabularnewline
Winsorized Mean ( 5 / 23 ) & 263302.521126761 & 1960.29331058513 & 134.317920540252 \tabularnewline
Winsorized Mean ( 6 / 23 ) & 263224.605633803 & 1946.19862395772 & 135.250638035351 \tabularnewline
Winsorized Mean ( 7 / 23 ) & 263500.563380282 & 1872.18494049102 & 140.744943344739 \tabularnewline
Winsorized Mean ( 8 / 23 ) & 263475.774647887 & 1827.58159065523 & 144.166354046840 \tabularnewline
Winsorized Mean ( 9 / 23 ) & 263417.591549296 & 1739.58772962023 & 151.425298686605 \tabularnewline
Winsorized Mean ( 10 / 23 ) & 263525.76056338 & 1704.59316038771 & 154.597452745523 \tabularnewline
Winsorized Mean ( 11 / 23 ) & 263370.366197183 & 1671.47708592984 & 157.567440447842 \tabularnewline
Winsorized Mean ( 12 / 23 ) & 263238.197183099 & 1636.23687100496 & 160.880250193494 \tabularnewline
Winsorized Mean ( 13 / 23 ) & 263209.084507042 & 1628.55580535810 & 161.621163758134 \tabularnewline
Winsorized Mean ( 14 / 23 ) & 263066.126760563 & 1550.33116238116 & 169.683828296735 \tabularnewline
Winsorized Mean ( 15 / 23 ) & 262984.788732394 & 1525.90431912125 & 172.346840779535 \tabularnewline
Winsorized Mean ( 16 / 23 ) & 262997.859154930 & 1480.88954686648 & 177.594513859204 \tabularnewline
Winsorized Mean ( 17 / 23 ) & 262997.140845070 & 1471.28570518304 & 178.753276755551 \tabularnewline
Winsorized Mean ( 18 / 23 ) & 263200.971830986 & 1438.25966570180 & 182.999619684501 \tabularnewline
Winsorized Mean ( 19 / 23 ) & 263236.295774648 & 1412.26728941025 & 186.392687665076 \tabularnewline
Winsorized Mean ( 20 / 23 ) & 263252.915492958 & 1397.67697090155 & 188.350327703512 \tabularnewline
Winsorized Mean ( 21 / 23 ) & 263439.549295775 & 1245.98689817269 & 211.430432921986 \tabularnewline
Winsorized Mean ( 22 / 23 ) & 264223.802816901 & 1118.33419210866 & 236.265514084568 \tabularnewline
Winsorized Mean ( 23 / 23 ) & 264426.267605634 & 1029.48389209721 & 256.853234553246 \tabularnewline
Trimmed Mean ( 1 / 23 ) & 263296.521739130 & 2021.79587525899 & 130.229032990485 \tabularnewline
Trimmed Mean ( 2 / 23 ) & 263407.776119403 & 1961.18555047054 & 134.310481767625 \tabularnewline
Trimmed Mean ( 3 / 23 ) & 263411.738461538 & 1927.18884963368 & 136.681850619678 \tabularnewline
Trimmed Mean ( 4 / 23 ) & 263411.873015873 & 1890.35574971142 & 139.345132817506 \tabularnewline
Trimmed Mean ( 5 / 23 ) & 263412.278688525 & 1852.75539129222 & 142.17326255076 \tabularnewline
Trimmed Mean ( 6 / 23 ) & 263438.694915254 & 1813.68619513114 & 145.250427346505 \tabularnewline
Trimmed Mean ( 7 / 23 ) & 263438.694915254 & 1769.49286775809 & 148.878076716424 \tabularnewline
Trimmed Mean ( 8 / 23 ) & 263479.927272727 & 1734.34926964774 & 151.918608254866 \tabularnewline
Trimmed Mean ( 9 / 23 ) & 263480.622641509 & 1701.12252920845 & 154.886328361138 \tabularnewline
Trimmed Mean ( 10 / 23 ) & 263490.372549020 & 1679.21098954843 & 156.913201610166 \tabularnewline
Trimmed Mean ( 11 / 23 ) & 263485.244897959 & 1657.96435060172 & 158.920935062527 \tabularnewline
Trimmed Mean ( 12 / 23 ) & 263501.021276596 & 1636.57262954491 & 161.007838283272 \tabularnewline
Trimmed Mean ( 13 / 23 ) & 263535.577777778 & 1614.93815483076 & 163.186173408229 \tabularnewline
Trimmed Mean ( 14 / 23 ) & 263535.577777778 & 1586.64519000751 & 166.096099769181 \tabularnewline
Trimmed Mean ( 15 / 23 ) & 263640.243902439 & 1564.95783305637 & 168.464758815608 \tabularnewline
Trimmed Mean ( 16 / 23 ) & 263719.794871795 & 1539.08338003974 & 171.348608068905 \tabularnewline
Trimmed Mean ( 17 / 23 ) & 263806.378378378 & 1512.24610821746 & 174.446723284570 \tabularnewline
Trimmed Mean ( 18 / 23 ) & 263902.942857143 & 1475.11776994180 & 178.902965061260 \tabularnewline
Trimmed Mean ( 19 / 23 ) & 263986.848484849 & 1430.16946053103 & 184.584313796512 \tabularnewline
Trimmed Mean ( 20 / 23 ) & 264077.322580645 & 1371.57346608757 & 192.536039162327 \tabularnewline
Trimmed Mean ( 21 / 23 ) & 264178.24137931 & 1288.85530383537 & 204.971217942906 \tabularnewline
Trimmed Mean ( 22 / 23 ) & 264270.740740741 & 1219.25803017181 & 216.747180827262 \tabularnewline
Trimmed Mean ( 23 / 23 ) & 264276.8 & 1160.80141999683 & 227.667536796019 \tabularnewline
Median & 264993 &  &  \tabularnewline
Midrange & 258927 &  &  \tabularnewline
Midmean - Weighted Average at Xnp & 263436.333333333 &  &  \tabularnewline
Midmean - Weighted Average at X(n+1)p & 263806.378378378 &  &  \tabularnewline
Midmean - Empirical Distribution Function & 263806.378378378 &  &  \tabularnewline
Midmean - Empirical Distribution Function - Averaging & 263806.378378378 &  &  \tabularnewline
Midmean - Empirical Distribution Function - Interpolation & 263902.942857143 &  &  \tabularnewline
Midmean - Closest Observation & 263436.333333333 &  &  \tabularnewline
Midmean - True Basic - Statistics Graphics Toolkit & 263806.378378378 &  &  \tabularnewline
Midmean - MS Excel (old versions) & 263806.378378378 &  &  \tabularnewline
Number of observations & 71 &  &  \tabularnewline
\hline
\end{tabular}
%Source: https://freestatistics.org/blog/index.php?pk=36081&T=1

[TABLE]
[ROW][C]Central Tendency - Ungrouped Data[/C][/ROW]
[ROW][C]Measure[/C][C]Value[/C][C]S.E.[/C][C]Value/S.E.[/C][/ROW]
[ROW][C]Arithmetic Mean[/C][C]263173.436619718[/C][C]2077.17876796812[/C][C]126.697538352538[/C][/ROW]
[ROW][C]Geometric Mean[/C][C]262593.526084463[/C][C][/C][C][/C][/ROW]
[ROW][C]Harmonic Mean[/C][C]262008.048355015[/C][C][/C][C][/C][/ROW]
[ROW][C]Quadratic Mean[/C][C]263746.629848838[/C][C][/C][C][/C][/ROW]
[ROW][C]Winsorized Mean ( 1 / 23 )[/C][C]263191.535211268[/C][C]2072.56992259287[/C][C]126.988012487417[/C][/ROW]
[ROW][C]Winsorized Mean ( 2 / 23 )[/C][C]263400.521126761[/C][C]2012.20507411782[/C][C]130.901429737344[/C][/ROW]
[ROW][C]Winsorized Mean ( 3 / 23 )[/C][C]263411.38028169[/C][C]2002.42706349424[/C][C]131.546054827104[/C][/ROW]
[ROW][C]Winsorized Mean ( 4 / 23 )[/C][C]263410.478873239[/C][C]1982.55027322356[/C][C]132.864463731829[/C][/ROW]
[ROW][C]Winsorized Mean ( 5 / 23 )[/C][C]263302.521126761[/C][C]1960.29331058513[/C][C]134.317920540252[/C][/ROW]
[ROW][C]Winsorized Mean ( 6 / 23 )[/C][C]263224.605633803[/C][C]1946.19862395772[/C][C]135.250638035351[/C][/ROW]
[ROW][C]Winsorized Mean ( 7 / 23 )[/C][C]263500.563380282[/C][C]1872.18494049102[/C][C]140.744943344739[/C][/ROW]
[ROW][C]Winsorized Mean ( 8 / 23 )[/C][C]263475.774647887[/C][C]1827.58159065523[/C][C]144.166354046840[/C][/ROW]
[ROW][C]Winsorized Mean ( 9 / 23 )[/C][C]263417.591549296[/C][C]1739.58772962023[/C][C]151.425298686605[/C][/ROW]
[ROW][C]Winsorized Mean ( 10 / 23 )[/C][C]263525.76056338[/C][C]1704.59316038771[/C][C]154.597452745523[/C][/ROW]
[ROW][C]Winsorized Mean ( 11 / 23 )[/C][C]263370.366197183[/C][C]1671.47708592984[/C][C]157.567440447842[/C][/ROW]
[ROW][C]Winsorized Mean ( 12 / 23 )[/C][C]263238.197183099[/C][C]1636.23687100496[/C][C]160.880250193494[/C][/ROW]
[ROW][C]Winsorized Mean ( 13 / 23 )[/C][C]263209.084507042[/C][C]1628.55580535810[/C][C]161.621163758134[/C][/ROW]
[ROW][C]Winsorized Mean ( 14 / 23 )[/C][C]263066.126760563[/C][C]1550.33116238116[/C][C]169.683828296735[/C][/ROW]
[ROW][C]Winsorized Mean ( 15 / 23 )[/C][C]262984.788732394[/C][C]1525.90431912125[/C][C]172.346840779535[/C][/ROW]
[ROW][C]Winsorized Mean ( 16 / 23 )[/C][C]262997.859154930[/C][C]1480.88954686648[/C][C]177.594513859204[/C][/ROW]
[ROW][C]Winsorized Mean ( 17 / 23 )[/C][C]262997.140845070[/C][C]1471.28570518304[/C][C]178.753276755551[/C][/ROW]
[ROW][C]Winsorized Mean ( 18 / 23 )[/C][C]263200.971830986[/C][C]1438.25966570180[/C][C]182.999619684501[/C][/ROW]
[ROW][C]Winsorized Mean ( 19 / 23 )[/C][C]263236.295774648[/C][C]1412.26728941025[/C][C]186.392687665076[/C][/ROW]
[ROW][C]Winsorized Mean ( 20 / 23 )[/C][C]263252.915492958[/C][C]1397.67697090155[/C][C]188.350327703512[/C][/ROW]
[ROW][C]Winsorized Mean ( 21 / 23 )[/C][C]263439.549295775[/C][C]1245.98689817269[/C][C]211.430432921986[/C][/ROW]
[ROW][C]Winsorized Mean ( 22 / 23 )[/C][C]264223.802816901[/C][C]1118.33419210866[/C][C]236.265514084568[/C][/ROW]
[ROW][C]Winsorized Mean ( 23 / 23 )[/C][C]264426.267605634[/C][C]1029.48389209721[/C][C]256.853234553246[/C][/ROW]
[ROW][C]Trimmed Mean ( 1 / 23 )[/C][C]263296.521739130[/C][C]2021.79587525899[/C][C]130.229032990485[/C][/ROW]
[ROW][C]Trimmed Mean ( 2 / 23 )[/C][C]263407.776119403[/C][C]1961.18555047054[/C][C]134.310481767625[/C][/ROW]
[ROW][C]Trimmed Mean ( 3 / 23 )[/C][C]263411.738461538[/C][C]1927.18884963368[/C][C]136.681850619678[/C][/ROW]
[ROW][C]Trimmed Mean ( 4 / 23 )[/C][C]263411.873015873[/C][C]1890.35574971142[/C][C]139.345132817506[/C][/ROW]
[ROW][C]Trimmed Mean ( 5 / 23 )[/C][C]263412.278688525[/C][C]1852.75539129222[/C][C]142.17326255076[/C][/ROW]
[ROW][C]Trimmed Mean ( 6 / 23 )[/C][C]263438.694915254[/C][C]1813.68619513114[/C][C]145.250427346505[/C][/ROW]
[ROW][C]Trimmed Mean ( 7 / 23 )[/C][C]263438.694915254[/C][C]1769.49286775809[/C][C]148.878076716424[/C][/ROW]
[ROW][C]Trimmed Mean ( 8 / 23 )[/C][C]263479.927272727[/C][C]1734.34926964774[/C][C]151.918608254866[/C][/ROW]
[ROW][C]Trimmed Mean ( 9 / 23 )[/C][C]263480.622641509[/C][C]1701.12252920845[/C][C]154.886328361138[/C][/ROW]
[ROW][C]Trimmed Mean ( 10 / 23 )[/C][C]263490.372549020[/C][C]1679.21098954843[/C][C]156.913201610166[/C][/ROW]
[ROW][C]Trimmed Mean ( 11 / 23 )[/C][C]263485.244897959[/C][C]1657.96435060172[/C][C]158.920935062527[/C][/ROW]
[ROW][C]Trimmed Mean ( 12 / 23 )[/C][C]263501.021276596[/C][C]1636.57262954491[/C][C]161.007838283272[/C][/ROW]
[ROW][C]Trimmed Mean ( 13 / 23 )[/C][C]263535.577777778[/C][C]1614.93815483076[/C][C]163.186173408229[/C][/ROW]
[ROW][C]Trimmed Mean ( 14 / 23 )[/C][C]263535.577777778[/C][C]1586.64519000751[/C][C]166.096099769181[/C][/ROW]
[ROW][C]Trimmed Mean ( 15 / 23 )[/C][C]263640.243902439[/C][C]1564.95783305637[/C][C]168.464758815608[/C][/ROW]
[ROW][C]Trimmed Mean ( 16 / 23 )[/C][C]263719.794871795[/C][C]1539.08338003974[/C][C]171.348608068905[/C][/ROW]
[ROW][C]Trimmed Mean ( 17 / 23 )[/C][C]263806.378378378[/C][C]1512.24610821746[/C][C]174.446723284570[/C][/ROW]
[ROW][C]Trimmed Mean ( 18 / 23 )[/C][C]263902.942857143[/C][C]1475.11776994180[/C][C]178.902965061260[/C][/ROW]
[ROW][C]Trimmed Mean ( 19 / 23 )[/C][C]263986.848484849[/C][C]1430.16946053103[/C][C]184.584313796512[/C][/ROW]
[ROW][C]Trimmed Mean ( 20 / 23 )[/C][C]264077.322580645[/C][C]1371.57346608757[/C][C]192.536039162327[/C][/ROW]
[ROW][C]Trimmed Mean ( 21 / 23 )[/C][C]264178.24137931[/C][C]1288.85530383537[/C][C]204.971217942906[/C][/ROW]
[ROW][C]Trimmed Mean ( 22 / 23 )[/C][C]264270.740740741[/C][C]1219.25803017181[/C][C]216.747180827262[/C][/ROW]
[ROW][C]Trimmed Mean ( 23 / 23 )[/C][C]264276.8[/C][C]1160.80141999683[/C][C]227.667536796019[/C][/ROW]
[ROW][C]Median[/C][C]264993[/C][C][/C][C][/C][/ROW]
[ROW][C]Midrange[/C][C]258927[/C][C][/C][C][/C][/ROW]
[ROW][C]Midmean - Weighted Average at Xnp[/C][C]263436.333333333[/C][C][/C][C][/C][/ROW]
[ROW][C]Midmean - Weighted Average at X(n+1)p[/C][C]263806.378378378[/C][C][/C][C][/C][/ROW]
[ROW][C]Midmean - Empirical Distribution Function[/C][C]263806.378378378[/C][C][/C][C][/C][/ROW]
[ROW][C]Midmean - Empirical Distribution Function - Averaging[/C][C]263806.378378378[/C][C][/C][C][/C][/ROW]
[ROW][C]Midmean - Empirical Distribution Function - Interpolation[/C][C]263902.942857143[/C][C][/C][C][/C][/ROW]
[ROW][C]Midmean - Closest Observation[/C][C]263436.333333333[/C][C][/C][C][/C][/ROW]
[ROW][C]Midmean - True Basic - Statistics Graphics Toolkit[/C][C]263806.378378378[/C][C][/C][C][/C][/ROW]
[ROW][C]Midmean - MS Excel (old versions)[/C][C]263806.378378378[/C][C][/C][C][/C][/ROW]
[ROW][C]Number of observations[/C][C]71[/C][C][/C][C][/C][/ROW]
[/TABLE]
Source: https://freestatistics.org/blog/index.php?pk=36081&T=1

Globally Unique Identifier (entire table): ba.freestatistics.org/blog/index.php?pk=36081&T=1

As an alternative you can also use a QR Code:  

The GUIDs for individual cells are displayed in the table below:

Central Tendency - Ungrouped Data
MeasureValueS.E.Value/S.E.
Arithmetic Mean263173.4366197182077.17876796812126.697538352538
Geometric Mean262593.526084463
Harmonic Mean262008.048355015
Quadratic Mean263746.629848838
Winsorized Mean ( 1 / 23 )263191.5352112682072.56992259287126.988012487417
Winsorized Mean ( 2 / 23 )263400.5211267612012.20507411782130.901429737344
Winsorized Mean ( 3 / 23 )263411.380281692002.42706349424131.546054827104
Winsorized Mean ( 4 / 23 )263410.4788732391982.55027322356132.864463731829
Winsorized Mean ( 5 / 23 )263302.5211267611960.29331058513134.317920540252
Winsorized Mean ( 6 / 23 )263224.6056338031946.19862395772135.250638035351
Winsorized Mean ( 7 / 23 )263500.5633802821872.18494049102140.744943344739
Winsorized Mean ( 8 / 23 )263475.7746478871827.58159065523144.166354046840
Winsorized Mean ( 9 / 23 )263417.5915492961739.58772962023151.425298686605
Winsorized Mean ( 10 / 23 )263525.760563381704.59316038771154.597452745523
Winsorized Mean ( 11 / 23 )263370.3661971831671.47708592984157.567440447842
Winsorized Mean ( 12 / 23 )263238.1971830991636.23687100496160.880250193494
Winsorized Mean ( 13 / 23 )263209.0845070421628.55580535810161.621163758134
Winsorized Mean ( 14 / 23 )263066.1267605631550.33116238116169.683828296735
Winsorized Mean ( 15 / 23 )262984.7887323941525.90431912125172.346840779535
Winsorized Mean ( 16 / 23 )262997.8591549301480.88954686648177.594513859204
Winsorized Mean ( 17 / 23 )262997.1408450701471.28570518304178.753276755551
Winsorized Mean ( 18 / 23 )263200.9718309861438.25966570180182.999619684501
Winsorized Mean ( 19 / 23 )263236.2957746481412.26728941025186.392687665076
Winsorized Mean ( 20 / 23 )263252.9154929581397.67697090155188.350327703512
Winsorized Mean ( 21 / 23 )263439.5492957751245.98689817269211.430432921986
Winsorized Mean ( 22 / 23 )264223.8028169011118.33419210866236.265514084568
Winsorized Mean ( 23 / 23 )264426.2676056341029.48389209721256.853234553246
Trimmed Mean ( 1 / 23 )263296.5217391302021.79587525899130.229032990485
Trimmed Mean ( 2 / 23 )263407.7761194031961.18555047054134.310481767625
Trimmed Mean ( 3 / 23 )263411.7384615381927.18884963368136.681850619678
Trimmed Mean ( 4 / 23 )263411.8730158731890.35574971142139.345132817506
Trimmed Mean ( 5 / 23 )263412.2786885251852.75539129222142.17326255076
Trimmed Mean ( 6 / 23 )263438.6949152541813.68619513114145.250427346505
Trimmed Mean ( 7 / 23 )263438.6949152541769.49286775809148.878076716424
Trimmed Mean ( 8 / 23 )263479.9272727271734.34926964774151.918608254866
Trimmed Mean ( 9 / 23 )263480.6226415091701.12252920845154.886328361138
Trimmed Mean ( 10 / 23 )263490.3725490201679.21098954843156.913201610166
Trimmed Mean ( 11 / 23 )263485.2448979591657.96435060172158.920935062527
Trimmed Mean ( 12 / 23 )263501.0212765961636.57262954491161.007838283272
Trimmed Mean ( 13 / 23 )263535.5777777781614.93815483076163.186173408229
Trimmed Mean ( 14 / 23 )263535.5777777781586.64519000751166.096099769181
Trimmed Mean ( 15 / 23 )263640.2439024391564.95783305637168.464758815608
Trimmed Mean ( 16 / 23 )263719.7948717951539.08338003974171.348608068905
Trimmed Mean ( 17 / 23 )263806.3783783781512.24610821746174.446723284570
Trimmed Mean ( 18 / 23 )263902.9428571431475.11776994180178.902965061260
Trimmed Mean ( 19 / 23 )263986.8484848491430.16946053103184.584313796512
Trimmed Mean ( 20 / 23 )264077.3225806451371.57346608757192.536039162327
Trimmed Mean ( 21 / 23 )264178.241379311288.85530383537204.971217942906
Trimmed Mean ( 22 / 23 )264270.7407407411219.25803017181216.747180827262
Trimmed Mean ( 23 / 23 )264276.81160.80141999683227.667536796019
Median264993
Midrange258927
Midmean - Weighted Average at Xnp263436.333333333
Midmean - Weighted Average at X(n+1)p263806.378378378
Midmean - Empirical Distribution Function263806.378378378
Midmean - Empirical Distribution Function - Averaging263806.378378378
Midmean - Empirical Distribution Function - Interpolation263902.942857143
Midmean - Closest Observation263436.333333333
Midmean - True Basic - Statistics Graphics Toolkit263806.378378378
Midmean - MS Excel (old versions)263806.378378378
Number of observations71


Parameters (Session):
Parameters (R input):
R code (references can be found in the software module):
geomean <- function(x) {
return(exp(mean(log(x))))
}
harmean <- function(x) {
return(1/mean(1/x))
}
quamean <- function(x) {
return(sqrt(mean(x*x)))
}
winmean <- function(x) {
x <-sort(x[!is.na(x)])
n<-length(x)
denom <- 3
nodenom <- n/denom
if (nodenom>40) denom <- n/40
sqrtn = sqrt(n)
roundnodenom = floor(nodenom)
win <- array(NA,dim=c(roundnodenom,2))
for (j in 1:roundnodenom) {
win[j,1] <- (j*x[j+1]+sum(x[(j+1):(n-j)])+j*x[n-j])/n
win[j,2] <- sd(c(rep(x[j+1],j),x[(j+1):(n-j)],rep(x[n-j],j)))/sqrtn
}
return(win)
}
trimean <- function(x) {
x <-sort(x[!is.na(x)])
n<-length(x)
denom <- 3
nodenom <- n/denom
if (nodenom>40) denom <- n/40
sqrtn = sqrt(n)
roundnodenom = floor(nodenom)
tri <- array(NA,dim=c(roundnodenom,2))
for (j in 1:roundnodenom) {
tri[j,1] <- mean(x,trim=j/n)
tri[j,2] <- sd(x[(j+1):(n-j)]) / sqrt(n-j*2)
}
return(tri)
}
midrange <- function(x) {
return((max(x)+min(x))/2)
}
q1 <- function(data,n,p,i,f) {
np <- n*p;
i <<- floor(np)
f <<- np - i
qvalue <- (1-f)*data[i] + f*data[i+1]
}
q2 <- function(data,n,p,i,f) {
np <- (n+1)*p
i <<- floor(np)
f <<- np - i
qvalue <- (1-f)*data[i] + f*data[i+1]
}
q3 <- function(data,n,p,i,f) {
np <- n*p
i <<- floor(np)
f <<- np - i
if (f==0) {
qvalue <- data[i]
} else {
qvalue <- data[i+1]
}
}
q4 <- function(data,n,p,i,f) {
np <- n*p
i <<- floor(np)
f <<- np - i
if (f==0) {
qvalue <- (data[i]+data[i+1])/2
} else {
qvalue <- data[i+1]
}
}
q5 <- function(data,n,p,i,f) {
np <- (n-1)*p
i <<- floor(np)
f <<- np - i
if (f==0) {
qvalue <- data[i+1]
} else {
qvalue <- data[i+1] + f*(data[i+2]-data[i+1])
}
}
q6 <- function(data,n,p,i,f) {
np <- n*p+0.5
i <<- floor(np)
f <<- np - i
qvalue <- data[i]
}
q7 <- function(data,n,p,i,f) {
np <- (n+1)*p
i <<- floor(np)
f <<- np - i
if (f==0) {
qvalue <- data[i]
} else {
qvalue <- f*data[i] + (1-f)*data[i+1]
}
}
q8 <- function(data,n,p,i,f) {
np <- (n+1)*p
i <<- floor(np)
f <<- np - i
if (f==0) {
qvalue <- data[i]
} else {
if (f == 0.5) {
qvalue <- (data[i]+data[i+1])/2
} else {
if (f < 0.5) {
qvalue <- data[i]
} else {
qvalue <- data[i+1]
}
}
}
}
midmean <- function(x,def) {
x <-sort(x[!is.na(x)])
n<-length(x)
if (def==1) {
qvalue1 <- q1(x,n,0.25,i,f)
qvalue3 <- q1(x,n,0.75,i,f)
}
if (def==2) {
qvalue1 <- q2(x,n,0.25,i,f)
qvalue3 <- q2(x,n,0.75,i,f)
}
if (def==3) {
qvalue1 <- q3(x,n,0.25,i,f)
qvalue3 <- q3(x,n,0.75,i,f)
}
if (def==4) {
qvalue1 <- q4(x,n,0.25,i,f)
qvalue3 <- q4(x,n,0.75,i,f)
}
if (def==5) {
qvalue1 <- q5(x,n,0.25,i,f)
qvalue3 <- q5(x,n,0.75,i,f)
}
if (def==6) {
qvalue1 <- q6(x,n,0.25,i,f)
qvalue3 <- q6(x,n,0.75,i,f)
}
if (def==7) {
qvalue1 <- q7(x,n,0.25,i,f)
qvalue3 <- q7(x,n,0.75,i,f)
}
if (def==8) {
qvalue1 <- q8(x,n,0.25,i,f)
qvalue3 <- q8(x,n,0.75,i,f)
}
midm <- 0
myn <- 0
roundno4 <- round(n/4)
round3no4 <- round(3*n/4)
for (i in 1:n) {
if ((x[i]>=qvalue1) & (x[i]<=qvalue3)){
midm = midm + x[i]
myn = myn + 1
}
}
midm = midm / myn
return(midm)
}
(arm <- mean(x))
sqrtn <- sqrt(length(x))
(armse <- sd(x) / sqrtn)
(armose <- arm / armse)
(geo <- geomean(x))
(har <- harmean(x))
(qua <- quamean(x))
(win <- winmean(x))
(tri <- trimean(x))
(midr <- midrange(x))
midm <- array(NA,dim=8)
for (j in 1:8) midm[j] <- midmean(x,j)
midm
bitmap(file='test1.png')
lb <- win[,1] - 2*win[,2]
ub <- win[,1] + 2*win[,2]
if ((ylimmin == '') | (ylimmax == '')) plot(win[,1],type='b',main=main, xlab='j', pch=19, ylab='Winsorized Mean(j/n)', ylim=c(min(lb),max(ub))) else plot(win[,1],type='l',main=main, xlab='j', pch=19, ylab='Winsorized Mean(j/n)', ylim=c(ylimmin,ylimmax))
lines(ub,lty=3)
lines(lb,lty=3)
grid()
dev.off()
bitmap(file='test2.png')
lb <- tri[,1] - 2*tri[,2]
ub <- tri[,1] + 2*tri[,2]
if ((ylimmin == '') | (ylimmax == '')) plot(tri[,1],type='b',main=main, xlab='j', pch=19, ylab='Trimmed Mean(j/n)', ylim=c(min(lb),max(ub))) else plot(tri[,1],type='l',main=main, xlab='j', pch=19, ylab='Trimmed Mean(j/n)', ylim=c(ylimmin,ylimmax))
lines(ub,lty=3)
lines(lb,lty=3)
grid()
dev.off()
load(file='createtable')
a<-table.start()
a<-table.row.start(a)
a<-table.element(a,'Central Tendency - Ungrouped Data',4,TRUE)
a<-table.row.end(a)
a<-table.row.start(a)
a<-table.element(a,'Measure',header=TRUE)
a<-table.element(a,'Value',header=TRUE)
a<-table.element(a,'S.E.',header=TRUE)
a<-table.element(a,'Value/S.E.',header=TRUE)
a<-table.row.end(a)
a<-table.row.start(a)
a<-table.element(a,hyperlink('arithmetic_mean.htm', 'Arithmetic Mean', 'click to view the definition of the Arithmetic Mean'),header=TRUE)
a<-table.element(a,arm)
a<-table.element(a,hyperlink('arithmetic_mean_standard_error.htm', armse, 'click to view the definition of the Standard Error of the Arithmetic Mean'))
a<-table.element(a,armose)
a<-table.row.end(a)
a<-table.row.start(a)
a<-table.element(a,hyperlink('geometric_mean.htm', 'Geometric Mean', 'click to view the definition of the Geometric Mean'),header=TRUE)
a<-table.element(a,geo)
a<-table.element(a,'')
a<-table.row.end(a)
a<-table.row.start(a)
a<-table.element(a,hyperlink('harmonic_mean.htm', 'Harmonic Mean', 'click to view the definition of the Harmonic Mean'),header=TRUE)
a<-table.element(a,har)
a<-table.element(a,'')
a<-table.row.end(a)
a<-table.row.start(a)
a<-table.element(a,hyperlink('quadratic_mean.htm', 'Quadratic Mean', 'click to view the definition of the Quadratic Mean'),header=TRUE)
a<-table.element(a,qua)
a<-table.element(a,'')
a<-table.row.end(a)
for (j in 1:length(win[,1])) {
a<-table.row.start(a)
mylabel <- paste('Winsorized Mean (',j)
mylabel <- paste(mylabel,'/')
mylabel <- paste(mylabel,length(win[,1]))
mylabel <- paste(mylabel,')')
a<-table.element(a,hyperlink('winsorized_mean.htm', mylabel, 'click to view the definition of the Winsorized Mean'),header=TRUE)
a<-table.element(a,win[j,1])
a<-table.element(a,win[j,2])
a<-table.element(a,win[j,1]/win[j,2])
a<-table.row.end(a)
}
for (j in 1:length(tri[,1])) {
a<-table.row.start(a)
mylabel <- paste('Trimmed Mean (',j)
mylabel <- paste(mylabel,'/')
mylabel <- paste(mylabel,length(tri[,1]))
mylabel <- paste(mylabel,')')
a<-table.element(a,hyperlink('arithmetic_mean.htm', mylabel, 'click to view the definition of the Trimmed Mean'),header=TRUE)
a<-table.element(a,tri[j,1])
a<-table.element(a,tri[j,2])
a<-table.element(a,tri[j,1]/tri[j,2])
a<-table.row.end(a)
}
a<-table.row.start(a)
a<-table.element(a,hyperlink('median_1.htm', 'Median', 'click to view the definition of the Median'),header=TRUE)
a<-table.element(a,median(x))
a<-table.element(a,'')
a<-table.row.end(a)
a<-table.row.start(a)
a<-table.element(a,hyperlink('midrange.htm', 'Midrange', 'click to view the definition of the Midrange'),header=TRUE)
a<-table.element(a,midr)
a<-table.element(a,'')
a<-table.row.end(a)
a<-table.row.start(a)
mymid <- hyperlink('midmean.htm', 'Midmean', 'click to view the definition of the Midmean')
mylabel <- paste(mymid,hyperlink('method_1.htm','Weighted Average at Xnp',''),sep=' - ')
a<-table.element(a,mylabel,header=TRUE)
a<-table.element(a,midm[1])
a<-table.element(a,'')
a<-table.row.end(a)
a<-table.row.start(a)
mymid <- hyperlink('midmean.htm', 'Midmean', 'click to view the definition of the Midmean')
mylabel <- paste(mymid,hyperlink('method_2.htm','Weighted Average at X(n+1)p',''),sep=' - ')
a<-table.element(a,mylabel,header=TRUE)
a<-table.element(a,midm[2])
a<-table.element(a,'')
a<-table.row.end(a)
a<-table.row.start(a)
mymid <- hyperlink('midmean.htm', 'Midmean', 'click to view the definition of the Midmean')
mylabel <- paste(mymid,hyperlink('method_3.htm','Empirical Distribution Function',''),sep=' - ')
a<-table.element(a,mylabel,header=TRUE)
a<-table.element(a,midm[3])
a<-table.element(a,'')
a<-table.row.end(a)
a<-table.row.start(a)
mymid <- hyperlink('midmean.htm', 'Midmean', 'click to view the definition of the Midmean')
mylabel <- paste(mymid,hyperlink('method_4.htm','Empirical Distribution Function - Averaging',''),sep=' - ')
a<-table.element(a,mylabel,header=TRUE)
a<-table.element(a,midm[4])
a<-table.element(a,'')
a<-table.row.end(a)
a<-table.row.start(a)
mymid <- hyperlink('midmean.htm', 'Midmean', 'click to view the definition of the Midmean')
mylabel <- paste(mymid,hyperlink('method_5.htm','Empirical Distribution Function - Interpolation',''),sep=' - ')
a<-table.element(a,mylabel,header=TRUE)
a<-table.element(a,midm[5])
a<-table.element(a,'')
a<-table.row.end(a)
a<-table.row.start(a)
mymid <- hyperlink('midmean.htm', 'Midmean', 'click to view the definition of the Midmean')
mylabel <- paste(mymid,hyperlink('method_6.htm','Closest Observation',''),sep=' - ')
a<-table.element(a,mylabel,header=TRUE)
a<-table.element(a,midm[6])
a<-table.element(a,'')
a<-table.row.end(a)
a<-table.row.start(a)
mymid <- hyperlink('midmean.htm', 'Midmean', 'click to view the definition of the Midmean')
mylabel <- paste(mymid,hyperlink('method_7.htm','True Basic - Statistics Graphics Toolkit',''),sep=' - ')
a<-table.element(a,mylabel,header=TRUE)
a<-table.element(a,midm[7])
a<-table.element(a,'')
a<-table.row.end(a)
a<-table.row.start(a)
mymid <- hyperlink('midmean.htm', 'Midmean', 'click to view the definition of the Midmean')
mylabel <- paste(mymid,hyperlink('method_8.htm','MS Excel (old versions)',''),sep=' - ')
a<-table.element(a,mylabel,header=TRUE)
a<-table.element(a,midm[8])
a<-table.element(a,'')
a<-table.row.end(a)
a<-table.row.start(a)
a<-table.element(a,'Number of observations',header=TRUE)
a<-table.element(a,length(x))
a<-table.element(a,'')
a<-table.row.end(a)
a<-table.end(a)
table.save(a,file='mytable.tab')