Free Statistics

of Irreproducible Research!

Author's title

Author*The author of this computation has been verified*
R Software Modulerwasp_centraltendency.wasp
Title produced by softwareCentral Tendency
Date of computationMon, 22 Dec 2008 07:18:45 -0700
Cite this page as followsStatistical Computations at FreeStatistics.org, Office for Research Development and Education, URL https://freestatistics.org/blog/index.php?v=date/2008/Dec/22/t1229955556y58xr0dinfoyq9g.htm/, Retrieved Mon, 13 May 2024 11:48:08 +0000
Statistical Computations at FreeStatistics.org, Office for Research Development and Education, URL https://freestatistics.org/blog/index.php?pk=36079, Retrieved Mon, 13 May 2024 11:48:08 +0000
QR Codes:

Original text written by user:
IsPrivate?No (this computation is public)
User-defined keywords1
Estimated Impact145
Family? (F = Feedback message, R = changed R code, M = changed R Module, P = changed Parameters, D = changed Data)
-     [Univariate Data Series] [Niet werkende wer...] [2008-10-13 17:04:19] [fe7291e888d31b8c4db0b24d6c0f75c6]
F RMPD  [Central Tendency] [Q9: Make a predic...] [2008-10-20 20:40:16] [fe7291e888d31b8c4db0b24d6c0f75c6]
-    D      [Central Tendency] [1] [2008-12-22 14:18:45] [783db4b4a0f63b73ca8b14666b7f4329] [Current]
Feedback Forum

Post a new message
Dataseries X:
519164
517009
509933
509127
500857
506971
569323
579714
577992
565464
547344
554788
562325
560854
555332
543599
536662
542722
593530
610763
612613
611324
594167
595454
590865
589379
584428
573100
567456
569028
620735
628884
628232
612117
595404
597141
593408
590072
579799
574205
572775
572942
619567
625809
619916
587625
565742
557274
560576
548854
531673
525919
511038
498662
555362
564591
541657
527070
509846
514258
516922
507561
492622
490243
469357
477580
528379
533590
517945
506174
501866


Summary of computational transaction
Raw Inputview raw input (R code)
Raw Outputview raw output of R engine
Computing time1 seconds
R Server'Gwilym Jenkins' @ 72.249.127.135

\begin{tabular}{lllllllll}
\hline
Summary of computational transaction \tabularnewline
Raw Input & view raw input (R code)  \tabularnewline
Raw Output & view raw output of R engine  \tabularnewline
Computing time & 1 seconds \tabularnewline
R Server & 'Gwilym Jenkins' @ 72.249.127.135 \tabularnewline
\hline
\end{tabular}
%Source: https://freestatistics.org/blog/index.php?pk=36079&T=0

[TABLE]
[ROW][C]Summary of computational transaction[/C][/ROW]
[ROW][C]Raw Input[/C][C]view raw input (R code) [/C][/ROW]
[ROW][C]Raw Output[/C][C]view raw output of R engine [/C][/ROW]
[ROW][C]Computing time[/C][C]1 seconds[/C][/ROW]
[ROW][C]R Server[/C][C]'Gwilym Jenkins' @ 72.249.127.135[/C][/ROW]
[/TABLE]
Source: https://freestatistics.org/blog/index.php?pk=36079&T=0

Globally Unique Identifier (entire table): ba.freestatistics.org/blog/index.php?pk=36079&T=0

As an alternative you can also use a QR Code:  

The GUIDs for individual cells are displayed in the table below:

Summary of computational transaction
Raw Inputview raw input (R code)
Raw Outputview raw output of R engine
Computing time1 seconds
R Server'Gwilym Jenkins' @ 72.249.127.135


Central Tendency - Ungrouped Data
MeasureValueS.E.Value/S.E.
Arithmetic Mean556685.619718314857.83298071865114.595463023917
Geometric Mean555189.52419919
Harmonic Mean553682.705195082
Quadratic Mean558167.337892462
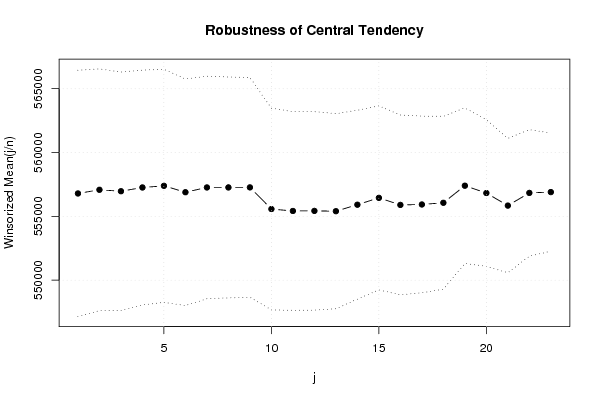
Winsorized Mean ( 1 / 23 )556792.2535211274827.43735303444115.339094596668
Winsorized Mean ( 2 / 23 )557080.7042253524735.31866230343117.643762532841
Winsorized Mean ( 3 / 23 )556966.8309859154672.15748038564119.209772642326
Winsorized Mean ( 4 / 23 )557260.9718309864598.70337057435121.177846650585
Winsorized Mean ( 5 / 23 )557390.9718309864566.18017744218122.069421304180
Winsorized Mean ( 6 / 23 )556888.5774647894441.20692686891125.391270128771
Winsorized Mean ( 7 / 23 )557264.4084507044359.26817809161127.83439460122
Winsorized Mean ( 8 / 23 )557264.859154934328.29436415024128.749297591809
Winsorized Mean ( 9 / 23 )557268.5352112684303.25764467702129.499226220068
Winsorized Mean ( 10 / 23 )555570.5070422543950.88348436033140.619309387759
Winsorized Mean ( 11 / 23 )555420.5352112683893.37314985818142.657925103197
Winsorized Mean ( 12 / 23 )555426.7887323943889.67420260110142.795195639000
Winsorized Mean ( 13 / 23 )555402.619718313822.9656674779145.280566980535
Winsorized Mean ( 14 / 23 )555911.9436619723701.05170413152150.203776683639
Winsorized Mean ( 15 / 23 )556448.9859154933607.99244376185154.226760335261
Winsorized Mean ( 16 / 23 )555895.521126763522.32720318563157.820522927002
Winsorized Mean ( 17 / 23 )555929.760563383460.23312664484160.662516141630
Winsorized Mean ( 18 / 23 )556063.1126760563387.2258383966164.164758774773
Winsorized Mean ( 19 / 23 )557401.4084507043046.53223164662182.962583707652
Winsorized Mean ( 20 / 23 )556825.0704225352872.93755639542193.817324425654
Winsorized Mean ( 21 / 23 )555843.0985915492632.26986112608211.164936696027
Winsorized Mean ( 22 / 23 )556837.4366197182478.67753615966224.651019947699
Winsorized Mean ( 23 / 23 )556900.6056338032315.90547710064240.467761374702
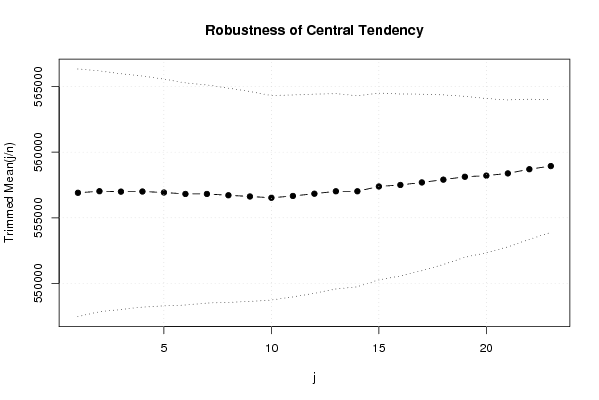
Trimmed Mean ( 1 / 23 )556904.8985507254718.01923978168118.037860858002
Trimmed Mean ( 2 / 23 )557024.2686567164587.49772895841121.422244013446
Trimmed Mean ( 3 / 23 )556993.4461538464490.11868996965124.048713322010
Trimmed Mean ( 4 / 23 )557003.4444444444401.2686945641126.555201033826
Trimmed Mean ( 5 / 23 )556928.5081967214319.91570903036128.921151640185
Trimmed Mean ( 6 / 23 )556817.203389834230.13433650033131.631092323771
Trimmed Mean ( 7 / 23 )556817.203389834154.76651758382134.018891563044
Trimmed Mean ( 8 / 23 )556717.1818181824081.54405053098136.398670435949
Trimmed Mean ( 9 / 23 )556625.4716981133996.56068063817139.276121690020
Trimmed Mean ( 10 / 23 )5565263894.76790861288142.890671038266
Trimmed Mean ( 11 / 23 )556664.4489795923845.67966159116144.750602745022
Trimmed Mean ( 12 / 23 )556835.2765957453791.90144695814146.848562491633
Trimmed Mean ( 13 / 23 )557020.4666666673719.82401473592149.743768646058
Trimmed Mean ( 14 / 23 )557020.4666666673637.91493924107153.115308073385
Trimmed Mean ( 15 / 23 )557388.4878048783555.83167574708156.753338918320
Trimmed Mean ( 16 / 23 )557502.5128205133465.71903043764160.862005235927
Trimmed Mean ( 17 / 23 )557695.2432432433360.97283535707165.932683946847
Trimmed Mean ( 18 / 23 )557905.9142857143230.18416010408172.716441736170
Trimmed Mean ( 19 / 23 )558126.1818181823065.49013254892182.067518630081
Trimmed Mean ( 20 / 23 )558213.5483870972935.82894151664190.138308296234
Trimmed Mean ( 21 / 23 )558383.5172413792798.17835078638199.552511398873
Trimmed Mean ( 22 / 23 )558701.629629632667.78103219693209.425594862085
Trimmed Mean ( 23 / 23 )558942.282524.10337646196221.441912883723
Median560854
Midrange549120.5
Midmean - Weighted Average at Xnp556795.888888889
Midmean - Weighted Average at X(n+1)p557695.243243243
Midmean - Empirical Distribution Function557695.243243243
Midmean - Empirical Distribution Function - Averaging557695.243243243
Midmean - Empirical Distribution Function - Interpolation557905.914285714
Midmean - Closest Observation556795.888888889
Midmean - True Basic - Statistics Graphics Toolkit557695.243243243
Midmean - MS Excel (old versions)557695.243243243
Number of observations71

\begin{tabular}{lllllllll}
\hline
Central Tendency - Ungrouped Data \tabularnewline
Measure & Value & S.E. & Value/S.E. \tabularnewline
Arithmetic Mean & 556685.61971831 & 4857.83298071865 & 114.595463023917 \tabularnewline
Geometric Mean & 555189.52419919 &  &  \tabularnewline
Harmonic Mean & 553682.705195082 &  &  \tabularnewline
Quadratic Mean & 558167.337892462 &  &  \tabularnewline
Winsorized Mean ( 1 / 23 ) & 556792.253521127 & 4827.43735303444 & 115.339094596668 \tabularnewline
Winsorized Mean ( 2 / 23 ) & 557080.704225352 & 4735.31866230343 & 117.643762532841 \tabularnewline
Winsorized Mean ( 3 / 23 ) & 556966.830985915 & 4672.15748038564 & 119.209772642326 \tabularnewline
Winsorized Mean ( 4 / 23 ) & 557260.971830986 & 4598.70337057435 & 121.177846650585 \tabularnewline
Winsorized Mean ( 5 / 23 ) & 557390.971830986 & 4566.18017744218 & 122.069421304180 \tabularnewline
Winsorized Mean ( 6 / 23 ) & 556888.577464789 & 4441.20692686891 & 125.391270128771 \tabularnewline
Winsorized Mean ( 7 / 23 ) & 557264.408450704 & 4359.26817809161 & 127.83439460122 \tabularnewline
Winsorized Mean ( 8 / 23 ) & 557264.85915493 & 4328.29436415024 & 128.749297591809 \tabularnewline
Winsorized Mean ( 9 / 23 ) & 557268.535211268 & 4303.25764467702 & 129.499226220068 \tabularnewline
Winsorized Mean ( 10 / 23 ) & 555570.507042254 & 3950.88348436033 & 140.619309387759 \tabularnewline
Winsorized Mean ( 11 / 23 ) & 555420.535211268 & 3893.37314985818 & 142.657925103197 \tabularnewline
Winsorized Mean ( 12 / 23 ) & 555426.788732394 & 3889.67420260110 & 142.795195639000 \tabularnewline
Winsorized Mean ( 13 / 23 ) & 555402.61971831 & 3822.9656674779 & 145.280566980535 \tabularnewline
Winsorized Mean ( 14 / 23 ) & 555911.943661972 & 3701.05170413152 & 150.203776683639 \tabularnewline
Winsorized Mean ( 15 / 23 ) & 556448.985915493 & 3607.99244376185 & 154.226760335261 \tabularnewline
Winsorized Mean ( 16 / 23 ) & 555895.52112676 & 3522.32720318563 & 157.820522927002 \tabularnewline
Winsorized Mean ( 17 / 23 ) & 555929.76056338 & 3460.23312664484 & 160.662516141630 \tabularnewline
Winsorized Mean ( 18 / 23 ) & 556063.112676056 & 3387.2258383966 & 164.164758774773 \tabularnewline
Winsorized Mean ( 19 / 23 ) & 557401.408450704 & 3046.53223164662 & 182.962583707652 \tabularnewline
Winsorized Mean ( 20 / 23 ) & 556825.070422535 & 2872.93755639542 & 193.817324425654 \tabularnewline
Winsorized Mean ( 21 / 23 ) & 555843.098591549 & 2632.26986112608 & 211.164936696027 \tabularnewline
Winsorized Mean ( 22 / 23 ) & 556837.436619718 & 2478.67753615966 & 224.651019947699 \tabularnewline
Winsorized Mean ( 23 / 23 ) & 556900.605633803 & 2315.90547710064 & 240.467761374702 \tabularnewline
Trimmed Mean ( 1 / 23 ) & 556904.898550725 & 4718.01923978168 & 118.037860858002 \tabularnewline
Trimmed Mean ( 2 / 23 ) & 557024.268656716 & 4587.49772895841 & 121.422244013446 \tabularnewline
Trimmed Mean ( 3 / 23 ) & 556993.446153846 & 4490.11868996965 & 124.048713322010 \tabularnewline
Trimmed Mean ( 4 / 23 ) & 557003.444444444 & 4401.2686945641 & 126.555201033826 \tabularnewline
Trimmed Mean ( 5 / 23 ) & 556928.508196721 & 4319.91570903036 & 128.921151640185 \tabularnewline
Trimmed Mean ( 6 / 23 ) & 556817.20338983 & 4230.13433650033 & 131.631092323771 \tabularnewline
Trimmed Mean ( 7 / 23 ) & 556817.20338983 & 4154.76651758382 & 134.018891563044 \tabularnewline
Trimmed Mean ( 8 / 23 ) & 556717.181818182 & 4081.54405053098 & 136.398670435949 \tabularnewline
Trimmed Mean ( 9 / 23 ) & 556625.471698113 & 3996.56068063817 & 139.276121690020 \tabularnewline
Trimmed Mean ( 10 / 23 ) & 556526 & 3894.76790861288 & 142.890671038266 \tabularnewline
Trimmed Mean ( 11 / 23 ) & 556664.448979592 & 3845.67966159116 & 144.750602745022 \tabularnewline
Trimmed Mean ( 12 / 23 ) & 556835.276595745 & 3791.90144695814 & 146.848562491633 \tabularnewline
Trimmed Mean ( 13 / 23 ) & 557020.466666667 & 3719.82401473592 & 149.743768646058 \tabularnewline
Trimmed Mean ( 14 / 23 ) & 557020.466666667 & 3637.91493924107 & 153.115308073385 \tabularnewline
Trimmed Mean ( 15 / 23 ) & 557388.487804878 & 3555.83167574708 & 156.753338918320 \tabularnewline
Trimmed Mean ( 16 / 23 ) & 557502.512820513 & 3465.71903043764 & 160.862005235927 \tabularnewline
Trimmed Mean ( 17 / 23 ) & 557695.243243243 & 3360.97283535707 & 165.932683946847 \tabularnewline
Trimmed Mean ( 18 / 23 ) & 557905.914285714 & 3230.18416010408 & 172.716441736170 \tabularnewline
Trimmed Mean ( 19 / 23 ) & 558126.181818182 & 3065.49013254892 & 182.067518630081 \tabularnewline
Trimmed Mean ( 20 / 23 ) & 558213.548387097 & 2935.82894151664 & 190.138308296234 \tabularnewline
Trimmed Mean ( 21 / 23 ) & 558383.517241379 & 2798.17835078638 & 199.552511398873 \tabularnewline
Trimmed Mean ( 22 / 23 ) & 558701.62962963 & 2667.78103219693 & 209.425594862085 \tabularnewline
Trimmed Mean ( 23 / 23 ) & 558942.28 & 2524.10337646196 & 221.441912883723 \tabularnewline
Median & 560854 &  &  \tabularnewline
Midrange & 549120.5 &  &  \tabularnewline
Midmean - Weighted Average at Xnp & 556795.888888889 &  &  \tabularnewline
Midmean - Weighted Average at X(n+1)p & 557695.243243243 &  &  \tabularnewline
Midmean - Empirical Distribution Function & 557695.243243243 &  &  \tabularnewline
Midmean - Empirical Distribution Function - Averaging & 557695.243243243 &  &  \tabularnewline
Midmean - Empirical Distribution Function - Interpolation & 557905.914285714 &  &  \tabularnewline
Midmean - Closest Observation & 556795.888888889 &  &  \tabularnewline
Midmean - True Basic - Statistics Graphics Toolkit & 557695.243243243 &  &  \tabularnewline
Midmean - MS Excel (old versions) & 557695.243243243 &  &  \tabularnewline
Number of observations & 71 &  &  \tabularnewline
\hline
\end{tabular}
%Source: https://freestatistics.org/blog/index.php?pk=36079&T=1

[TABLE]
[ROW][C]Central Tendency - Ungrouped Data[/C][/ROW]
[ROW][C]Measure[/C][C]Value[/C][C]S.E.[/C][C]Value/S.E.[/C][/ROW]
[ROW][C]Arithmetic Mean[/C][C]556685.61971831[/C][C]4857.83298071865[/C][C]114.595463023917[/C][/ROW]
[ROW][C]Geometric Mean[/C][C]555189.52419919[/C][C][/C][C][/C][/ROW]
[ROW][C]Harmonic Mean[/C][C]553682.705195082[/C][C][/C][C][/C][/ROW]
[ROW][C]Quadratic Mean[/C][C]558167.337892462[/C][C][/C][C][/C][/ROW]
[ROW][C]Winsorized Mean ( 1 / 23 )[/C][C]556792.253521127[/C][C]4827.43735303444[/C][C]115.339094596668[/C][/ROW]
[ROW][C]Winsorized Mean ( 2 / 23 )[/C][C]557080.704225352[/C][C]4735.31866230343[/C][C]117.643762532841[/C][/ROW]
[ROW][C]Winsorized Mean ( 3 / 23 )[/C][C]556966.830985915[/C][C]4672.15748038564[/C][C]119.209772642326[/C][/ROW]
[ROW][C]Winsorized Mean ( 4 / 23 )[/C][C]557260.971830986[/C][C]4598.70337057435[/C][C]121.177846650585[/C][/ROW]
[ROW][C]Winsorized Mean ( 5 / 23 )[/C][C]557390.971830986[/C][C]4566.18017744218[/C][C]122.069421304180[/C][/ROW]
[ROW][C]Winsorized Mean ( 6 / 23 )[/C][C]556888.577464789[/C][C]4441.20692686891[/C][C]125.391270128771[/C][/ROW]
[ROW][C]Winsorized Mean ( 7 / 23 )[/C][C]557264.408450704[/C][C]4359.26817809161[/C][C]127.83439460122[/C][/ROW]
[ROW][C]Winsorized Mean ( 8 / 23 )[/C][C]557264.85915493[/C][C]4328.29436415024[/C][C]128.749297591809[/C][/ROW]
[ROW][C]Winsorized Mean ( 9 / 23 )[/C][C]557268.535211268[/C][C]4303.25764467702[/C][C]129.499226220068[/C][/ROW]
[ROW][C]Winsorized Mean ( 10 / 23 )[/C][C]555570.507042254[/C][C]3950.88348436033[/C][C]140.619309387759[/C][/ROW]
[ROW][C]Winsorized Mean ( 11 / 23 )[/C][C]555420.535211268[/C][C]3893.37314985818[/C][C]142.657925103197[/C][/ROW]
[ROW][C]Winsorized Mean ( 12 / 23 )[/C][C]555426.788732394[/C][C]3889.67420260110[/C][C]142.795195639000[/C][/ROW]
[ROW][C]Winsorized Mean ( 13 / 23 )[/C][C]555402.61971831[/C][C]3822.9656674779[/C][C]145.280566980535[/C][/ROW]
[ROW][C]Winsorized Mean ( 14 / 23 )[/C][C]555911.943661972[/C][C]3701.05170413152[/C][C]150.203776683639[/C][/ROW]
[ROW][C]Winsorized Mean ( 15 / 23 )[/C][C]556448.985915493[/C][C]3607.99244376185[/C][C]154.226760335261[/C][/ROW]
[ROW][C]Winsorized Mean ( 16 / 23 )[/C][C]555895.52112676[/C][C]3522.32720318563[/C][C]157.820522927002[/C][/ROW]
[ROW][C]Winsorized Mean ( 17 / 23 )[/C][C]555929.76056338[/C][C]3460.23312664484[/C][C]160.662516141630[/C][/ROW]
[ROW][C]Winsorized Mean ( 18 / 23 )[/C][C]556063.112676056[/C][C]3387.2258383966[/C][C]164.164758774773[/C][/ROW]
[ROW][C]Winsorized Mean ( 19 / 23 )[/C][C]557401.408450704[/C][C]3046.53223164662[/C][C]182.962583707652[/C][/ROW]
[ROW][C]Winsorized Mean ( 20 / 23 )[/C][C]556825.070422535[/C][C]2872.93755639542[/C][C]193.817324425654[/C][/ROW]
[ROW][C]Winsorized Mean ( 21 / 23 )[/C][C]555843.098591549[/C][C]2632.26986112608[/C][C]211.164936696027[/C][/ROW]
[ROW][C]Winsorized Mean ( 22 / 23 )[/C][C]556837.436619718[/C][C]2478.67753615966[/C][C]224.651019947699[/C][/ROW]
[ROW][C]Winsorized Mean ( 23 / 23 )[/C][C]556900.605633803[/C][C]2315.90547710064[/C][C]240.467761374702[/C][/ROW]
[ROW][C]Trimmed Mean ( 1 / 23 )[/C][C]556904.898550725[/C][C]4718.01923978168[/C][C]118.037860858002[/C][/ROW]
[ROW][C]Trimmed Mean ( 2 / 23 )[/C][C]557024.268656716[/C][C]4587.49772895841[/C][C]121.422244013446[/C][/ROW]
[ROW][C]Trimmed Mean ( 3 / 23 )[/C][C]556993.446153846[/C][C]4490.11868996965[/C][C]124.048713322010[/C][/ROW]
[ROW][C]Trimmed Mean ( 4 / 23 )[/C][C]557003.444444444[/C][C]4401.2686945641[/C][C]126.555201033826[/C][/ROW]
[ROW][C]Trimmed Mean ( 5 / 23 )[/C][C]556928.508196721[/C][C]4319.91570903036[/C][C]128.921151640185[/C][/ROW]
[ROW][C]Trimmed Mean ( 6 / 23 )[/C][C]556817.20338983[/C][C]4230.13433650033[/C][C]131.631092323771[/C][/ROW]
[ROW][C]Trimmed Mean ( 7 / 23 )[/C][C]556817.20338983[/C][C]4154.76651758382[/C][C]134.018891563044[/C][/ROW]
[ROW][C]Trimmed Mean ( 8 / 23 )[/C][C]556717.181818182[/C][C]4081.54405053098[/C][C]136.398670435949[/C][/ROW]
[ROW][C]Trimmed Mean ( 9 / 23 )[/C][C]556625.471698113[/C][C]3996.56068063817[/C][C]139.276121690020[/C][/ROW]
[ROW][C]Trimmed Mean ( 10 / 23 )[/C][C]556526[/C][C]3894.76790861288[/C][C]142.890671038266[/C][/ROW]
[ROW][C]Trimmed Mean ( 11 / 23 )[/C][C]556664.448979592[/C][C]3845.67966159116[/C][C]144.750602745022[/C][/ROW]
[ROW][C]Trimmed Mean ( 12 / 23 )[/C][C]556835.276595745[/C][C]3791.90144695814[/C][C]146.848562491633[/C][/ROW]
[ROW][C]Trimmed Mean ( 13 / 23 )[/C][C]557020.466666667[/C][C]3719.82401473592[/C][C]149.743768646058[/C][/ROW]
[ROW][C]Trimmed Mean ( 14 / 23 )[/C][C]557020.466666667[/C][C]3637.91493924107[/C][C]153.115308073385[/C][/ROW]
[ROW][C]Trimmed Mean ( 15 / 23 )[/C][C]557388.487804878[/C][C]3555.83167574708[/C][C]156.753338918320[/C][/ROW]
[ROW][C]Trimmed Mean ( 16 / 23 )[/C][C]557502.512820513[/C][C]3465.71903043764[/C][C]160.862005235927[/C][/ROW]
[ROW][C]Trimmed Mean ( 17 / 23 )[/C][C]557695.243243243[/C][C]3360.97283535707[/C][C]165.932683946847[/C][/ROW]
[ROW][C]Trimmed Mean ( 18 / 23 )[/C][C]557905.914285714[/C][C]3230.18416010408[/C][C]172.716441736170[/C][/ROW]
[ROW][C]Trimmed Mean ( 19 / 23 )[/C][C]558126.181818182[/C][C]3065.49013254892[/C][C]182.067518630081[/C][/ROW]
[ROW][C]Trimmed Mean ( 20 / 23 )[/C][C]558213.548387097[/C][C]2935.82894151664[/C][C]190.138308296234[/C][/ROW]
[ROW][C]Trimmed Mean ( 21 / 23 )[/C][C]558383.517241379[/C][C]2798.17835078638[/C][C]199.552511398873[/C][/ROW]
[ROW][C]Trimmed Mean ( 22 / 23 )[/C][C]558701.62962963[/C][C]2667.78103219693[/C][C]209.425594862085[/C][/ROW]
[ROW][C]Trimmed Mean ( 23 / 23 )[/C][C]558942.28[/C][C]2524.10337646196[/C][C]221.441912883723[/C][/ROW]
[ROW][C]Median[/C][C]560854[/C][C][/C][C][/C][/ROW]
[ROW][C]Midrange[/C][C]549120.5[/C][C][/C][C][/C][/ROW]
[ROW][C]Midmean - Weighted Average at Xnp[/C][C]556795.888888889[/C][C][/C][C][/C][/ROW]
[ROW][C]Midmean - Weighted Average at X(n+1)p[/C][C]557695.243243243[/C][C][/C][C][/C][/ROW]
[ROW][C]Midmean - Empirical Distribution Function[/C][C]557695.243243243[/C][C][/C][C][/C][/ROW]
[ROW][C]Midmean - Empirical Distribution Function - Averaging[/C][C]557695.243243243[/C][C][/C][C][/C][/ROW]
[ROW][C]Midmean - Empirical Distribution Function - Interpolation[/C][C]557905.914285714[/C][C][/C][C][/C][/ROW]
[ROW][C]Midmean - Closest Observation[/C][C]556795.888888889[/C][C][/C][C][/C][/ROW]
[ROW][C]Midmean - True Basic - Statistics Graphics Toolkit[/C][C]557695.243243243[/C][C][/C][C][/C][/ROW]
[ROW][C]Midmean - MS Excel (old versions)[/C][C]557695.243243243[/C][C][/C][C][/C][/ROW]
[ROW][C]Number of observations[/C][C]71[/C][C][/C][C][/C][/ROW]
[/TABLE]
Source: https://freestatistics.org/blog/index.php?pk=36079&T=1

Globally Unique Identifier (entire table): ba.freestatistics.org/blog/index.php?pk=36079&T=1

As an alternative you can also use a QR Code:  

The GUIDs for individual cells are displayed in the table below:

Central Tendency - Ungrouped Data
MeasureValueS.E.Value/S.E.
Arithmetic Mean556685.619718314857.83298071865114.595463023917
Geometric Mean555189.52419919
Harmonic Mean553682.705195082
Quadratic Mean558167.337892462
Winsorized Mean ( 1 / 23 )556792.2535211274827.43735303444115.339094596668
Winsorized Mean ( 2 / 23 )557080.7042253524735.31866230343117.643762532841
Winsorized Mean ( 3 / 23 )556966.8309859154672.15748038564119.209772642326
Winsorized Mean ( 4 / 23 )557260.9718309864598.70337057435121.177846650585
Winsorized Mean ( 5 / 23 )557390.9718309864566.18017744218122.069421304180
Winsorized Mean ( 6 / 23 )556888.5774647894441.20692686891125.391270128771
Winsorized Mean ( 7 / 23 )557264.4084507044359.26817809161127.83439460122
Winsorized Mean ( 8 / 23 )557264.859154934328.29436415024128.749297591809
Winsorized Mean ( 9 / 23 )557268.5352112684303.25764467702129.499226220068
Winsorized Mean ( 10 / 23 )555570.5070422543950.88348436033140.619309387759
Winsorized Mean ( 11 / 23 )555420.5352112683893.37314985818142.657925103197
Winsorized Mean ( 12 / 23 )555426.7887323943889.67420260110142.795195639000
Winsorized Mean ( 13 / 23 )555402.619718313822.9656674779145.280566980535
Winsorized Mean ( 14 / 23 )555911.9436619723701.05170413152150.203776683639
Winsorized Mean ( 15 / 23 )556448.9859154933607.99244376185154.226760335261
Winsorized Mean ( 16 / 23 )555895.521126763522.32720318563157.820522927002
Winsorized Mean ( 17 / 23 )555929.760563383460.23312664484160.662516141630
Winsorized Mean ( 18 / 23 )556063.1126760563387.2258383966164.164758774773
Winsorized Mean ( 19 / 23 )557401.4084507043046.53223164662182.962583707652
Winsorized Mean ( 20 / 23 )556825.0704225352872.93755639542193.817324425654
Winsorized Mean ( 21 / 23 )555843.0985915492632.26986112608211.164936696027
Winsorized Mean ( 22 / 23 )556837.4366197182478.67753615966224.651019947699
Winsorized Mean ( 23 / 23 )556900.6056338032315.90547710064240.467761374702
Trimmed Mean ( 1 / 23 )556904.8985507254718.01923978168118.037860858002
Trimmed Mean ( 2 / 23 )557024.2686567164587.49772895841121.422244013446
Trimmed Mean ( 3 / 23 )556993.4461538464490.11868996965124.048713322010
Trimmed Mean ( 4 / 23 )557003.4444444444401.2686945641126.555201033826
Trimmed Mean ( 5 / 23 )556928.5081967214319.91570903036128.921151640185
Trimmed Mean ( 6 / 23 )556817.203389834230.13433650033131.631092323771
Trimmed Mean ( 7 / 23 )556817.203389834154.76651758382134.018891563044
Trimmed Mean ( 8 / 23 )556717.1818181824081.54405053098136.398670435949
Trimmed Mean ( 9 / 23 )556625.4716981133996.56068063817139.276121690020
Trimmed Mean ( 10 / 23 )5565263894.76790861288142.890671038266
Trimmed Mean ( 11 / 23 )556664.4489795923845.67966159116144.750602745022
Trimmed Mean ( 12 / 23 )556835.2765957453791.90144695814146.848562491633
Trimmed Mean ( 13 / 23 )557020.4666666673719.82401473592149.743768646058
Trimmed Mean ( 14 / 23 )557020.4666666673637.91493924107153.115308073385
Trimmed Mean ( 15 / 23 )557388.4878048783555.83167574708156.753338918320
Trimmed Mean ( 16 / 23 )557502.5128205133465.71903043764160.862005235927
Trimmed Mean ( 17 / 23 )557695.2432432433360.97283535707165.932683946847
Trimmed Mean ( 18 / 23 )557905.9142857143230.18416010408172.716441736170
Trimmed Mean ( 19 / 23 )558126.1818181823065.49013254892182.067518630081
Trimmed Mean ( 20 / 23 )558213.5483870972935.82894151664190.138308296234
Trimmed Mean ( 21 / 23 )558383.5172413792798.17835078638199.552511398873
Trimmed Mean ( 22 / 23 )558701.629629632667.78103219693209.425594862085
Trimmed Mean ( 23 / 23 )558942.282524.10337646196221.441912883723
Median560854
Midrange549120.5
Midmean - Weighted Average at Xnp556795.888888889
Midmean - Weighted Average at X(n+1)p557695.243243243
Midmean - Empirical Distribution Function557695.243243243
Midmean - Empirical Distribution Function - Averaging557695.243243243
Midmean - Empirical Distribution Function - Interpolation557905.914285714
Midmean - Closest Observation556795.888888889
Midmean - True Basic - Statistics Graphics Toolkit557695.243243243
Midmean - MS Excel (old versions)557695.243243243
Number of observations71


Parameters (Session):
Parameters (R input):
R code (references can be found in the software module):
geomean <- function(x) {
return(exp(mean(log(x))))
}
harmean <- function(x) {
return(1/mean(1/x))
}
quamean <- function(x) {
return(sqrt(mean(x*x)))
}
winmean <- function(x) {
x <-sort(x[!is.na(x)])
n<-length(x)
denom <- 3
nodenom <- n/denom
if (nodenom>40) denom <- n/40
sqrtn = sqrt(n)
roundnodenom = floor(nodenom)
win <- array(NA,dim=c(roundnodenom,2))
for (j in 1:roundnodenom) {
win[j,1] <- (j*x[j+1]+sum(x[(j+1):(n-j)])+j*x[n-j])/n
win[j,2] <- sd(c(rep(x[j+1],j),x[(j+1):(n-j)],rep(x[n-j],j)))/sqrtn
}
return(win)
}
trimean <- function(x) {
x <-sort(x[!is.na(x)])
n<-length(x)
denom <- 3
nodenom <- n/denom
if (nodenom>40) denom <- n/40
sqrtn = sqrt(n)
roundnodenom = floor(nodenom)
tri <- array(NA,dim=c(roundnodenom,2))
for (j in 1:roundnodenom) {
tri[j,1] <- mean(x,trim=j/n)
tri[j,2] <- sd(x[(j+1):(n-j)]) / sqrt(n-j*2)
}
return(tri)
}
midrange <- function(x) {
return((max(x)+min(x))/2)
}
q1 <- function(data,n,p,i,f) {
np <- n*p;
i <<- floor(np)
f <<- np - i
qvalue <- (1-f)*data[i] + f*data[i+1]
}
q2 <- function(data,n,p,i,f) {
np <- (n+1)*p
i <<- floor(np)
f <<- np - i
qvalue <- (1-f)*data[i] + f*data[i+1]
}
q3 <- function(data,n,p,i,f) {
np <- n*p
i <<- floor(np)
f <<- np - i
if (f==0) {
qvalue <- data[i]
} else {
qvalue <- data[i+1]
}
}
q4 <- function(data,n,p,i,f) {
np <- n*p
i <<- floor(np)
f <<- np - i
if (f==0) {
qvalue <- (data[i]+data[i+1])/2
} else {
qvalue <- data[i+1]
}
}
q5 <- function(data,n,p,i,f) {
np <- (n-1)*p
i <<- floor(np)
f <<- np - i
if (f==0) {
qvalue <- data[i+1]
} else {
qvalue <- data[i+1] + f*(data[i+2]-data[i+1])
}
}
q6 <- function(data,n,p,i,f) {
np <- n*p+0.5
i <<- floor(np)
f <<- np - i
qvalue <- data[i]
}
q7 <- function(data,n,p,i,f) {
np <- (n+1)*p
i <<- floor(np)
f <<- np - i
if (f==0) {
qvalue <- data[i]
} else {
qvalue <- f*data[i] + (1-f)*data[i+1]
}
}
q8 <- function(data,n,p,i,f) {
np <- (n+1)*p
i <<- floor(np)
f <<- np - i
if (f==0) {
qvalue <- data[i]
} else {
if (f == 0.5) {
qvalue <- (data[i]+data[i+1])/2
} else {
if (f < 0.5) {
qvalue <- data[i]
} else {
qvalue <- data[i+1]
}
}
}
}
midmean <- function(x,def) {
x <-sort(x[!is.na(x)])
n<-length(x)
if (def==1) {
qvalue1 <- q1(x,n,0.25,i,f)
qvalue3 <- q1(x,n,0.75,i,f)
}
if (def==2) {
qvalue1 <- q2(x,n,0.25,i,f)
qvalue3 <- q2(x,n,0.75,i,f)
}
if (def==3) {
qvalue1 <- q3(x,n,0.25,i,f)
qvalue3 <- q3(x,n,0.75,i,f)
}
if (def==4) {
qvalue1 <- q4(x,n,0.25,i,f)
qvalue3 <- q4(x,n,0.75,i,f)
}
if (def==5) {
qvalue1 <- q5(x,n,0.25,i,f)
qvalue3 <- q5(x,n,0.75,i,f)
}
if (def==6) {
qvalue1 <- q6(x,n,0.25,i,f)
qvalue3 <- q6(x,n,0.75,i,f)
}
if (def==7) {
qvalue1 <- q7(x,n,0.25,i,f)
qvalue3 <- q7(x,n,0.75,i,f)
}
if (def==8) {
qvalue1 <- q8(x,n,0.25,i,f)
qvalue3 <- q8(x,n,0.75,i,f)
}
midm <- 0
myn <- 0
roundno4 <- round(n/4)
round3no4 <- round(3*n/4)
for (i in 1:n) {
if ((x[i]>=qvalue1) & (x[i]<=qvalue3)){
midm = midm + x[i]
myn = myn + 1
}
}
midm = midm / myn
return(midm)
}
(arm <- mean(x))
sqrtn <- sqrt(length(x))
(armse <- sd(x) / sqrtn)
(armose <- arm / armse)
(geo <- geomean(x))
(har <- harmean(x))
(qua <- quamean(x))
(win <- winmean(x))
(tri <- trimean(x))
(midr <- midrange(x))
midm <- array(NA,dim=8)
for (j in 1:8) midm[j] <- midmean(x,j)
midm
bitmap(file='test1.png')
lb <- win[,1] - 2*win[,2]
ub <- win[,1] + 2*win[,2]
if ((ylimmin == '') | (ylimmax == '')) plot(win[,1],type='b',main=main, xlab='j', pch=19, ylab='Winsorized Mean(j/n)', ylim=c(min(lb),max(ub))) else plot(win[,1],type='l',main=main, xlab='j', pch=19, ylab='Winsorized Mean(j/n)', ylim=c(ylimmin,ylimmax))
lines(ub,lty=3)
lines(lb,lty=3)
grid()
dev.off()
bitmap(file='test2.png')
lb <- tri[,1] - 2*tri[,2]
ub <- tri[,1] + 2*tri[,2]
if ((ylimmin == '') | (ylimmax == '')) plot(tri[,1],type='b',main=main, xlab='j', pch=19, ylab='Trimmed Mean(j/n)', ylim=c(min(lb),max(ub))) else plot(tri[,1],type='l',main=main, xlab='j', pch=19, ylab='Trimmed Mean(j/n)', ylim=c(ylimmin,ylimmax))
lines(ub,lty=3)
lines(lb,lty=3)
grid()
dev.off()
load(file='createtable')
a<-table.start()
a<-table.row.start(a)
a<-table.element(a,'Central Tendency - Ungrouped Data',4,TRUE)
a<-table.row.end(a)
a<-table.row.start(a)
a<-table.element(a,'Measure',header=TRUE)
a<-table.element(a,'Value',header=TRUE)
a<-table.element(a,'S.E.',header=TRUE)
a<-table.element(a,'Value/S.E.',header=TRUE)
a<-table.row.end(a)
a<-table.row.start(a)
a<-table.element(a,hyperlink('arithmetic_mean.htm', 'Arithmetic Mean', 'click to view the definition of the Arithmetic Mean'),header=TRUE)
a<-table.element(a,arm)
a<-table.element(a,hyperlink('arithmetic_mean_standard_error.htm', armse, 'click to view the definition of the Standard Error of the Arithmetic Mean'))
a<-table.element(a,armose)
a<-table.row.end(a)
a<-table.row.start(a)
a<-table.element(a,hyperlink('geometric_mean.htm', 'Geometric Mean', 'click to view the definition of the Geometric Mean'),header=TRUE)
a<-table.element(a,geo)
a<-table.element(a,'')
a<-table.row.end(a)
a<-table.row.start(a)
a<-table.element(a,hyperlink('harmonic_mean.htm', 'Harmonic Mean', 'click to view the definition of the Harmonic Mean'),header=TRUE)
a<-table.element(a,har)
a<-table.element(a,'')
a<-table.row.end(a)
a<-table.row.start(a)
a<-table.element(a,hyperlink('quadratic_mean.htm', 'Quadratic Mean', 'click to view the definition of the Quadratic Mean'),header=TRUE)
a<-table.element(a,qua)
a<-table.element(a,'')
a<-table.row.end(a)
for (j in 1:length(win[,1])) {
a<-table.row.start(a)
mylabel <- paste('Winsorized Mean (',j)
mylabel <- paste(mylabel,'/')
mylabel <- paste(mylabel,length(win[,1]))
mylabel <- paste(mylabel,')')
a<-table.element(a,hyperlink('winsorized_mean.htm', mylabel, 'click to view the definition of the Winsorized Mean'),header=TRUE)
a<-table.element(a,win[j,1])
a<-table.element(a,win[j,2])
a<-table.element(a,win[j,1]/win[j,2])
a<-table.row.end(a)
}
for (j in 1:length(tri[,1])) {
a<-table.row.start(a)
mylabel <- paste('Trimmed Mean (',j)
mylabel <- paste(mylabel,'/')
mylabel <- paste(mylabel,length(tri[,1]))
mylabel <- paste(mylabel,')')
a<-table.element(a,hyperlink('arithmetic_mean.htm', mylabel, 'click to view the definition of the Trimmed Mean'),header=TRUE)
a<-table.element(a,tri[j,1])
a<-table.element(a,tri[j,2])
a<-table.element(a,tri[j,1]/tri[j,2])
a<-table.row.end(a)
}
a<-table.row.start(a)
a<-table.element(a,hyperlink('median_1.htm', 'Median', 'click to view the definition of the Median'),header=TRUE)
a<-table.element(a,median(x))
a<-table.element(a,'')
a<-table.row.end(a)
a<-table.row.start(a)
a<-table.element(a,hyperlink('midrange.htm', 'Midrange', 'click to view the definition of the Midrange'),header=TRUE)
a<-table.element(a,midr)
a<-table.element(a,'')
a<-table.row.end(a)
a<-table.row.start(a)
mymid <- hyperlink('midmean.htm', 'Midmean', 'click to view the definition of the Midmean')
mylabel <- paste(mymid,hyperlink('method_1.htm','Weighted Average at Xnp',''),sep=' - ')
a<-table.element(a,mylabel,header=TRUE)
a<-table.element(a,midm[1])
a<-table.element(a,'')
a<-table.row.end(a)
a<-table.row.start(a)
mymid <- hyperlink('midmean.htm', 'Midmean', 'click to view the definition of the Midmean')
mylabel <- paste(mymid,hyperlink('method_2.htm','Weighted Average at X(n+1)p',''),sep=' - ')
a<-table.element(a,mylabel,header=TRUE)
a<-table.element(a,midm[2])
a<-table.element(a,'')
a<-table.row.end(a)
a<-table.row.start(a)
mymid <- hyperlink('midmean.htm', 'Midmean', 'click to view the definition of the Midmean')
mylabel <- paste(mymid,hyperlink('method_3.htm','Empirical Distribution Function',''),sep=' - ')
a<-table.element(a,mylabel,header=TRUE)
a<-table.element(a,midm[3])
a<-table.element(a,'')
a<-table.row.end(a)
a<-table.row.start(a)
mymid <- hyperlink('midmean.htm', 'Midmean', 'click to view the definition of the Midmean')
mylabel <- paste(mymid,hyperlink('method_4.htm','Empirical Distribution Function - Averaging',''),sep=' - ')
a<-table.element(a,mylabel,header=TRUE)
a<-table.element(a,midm[4])
a<-table.element(a,'')
a<-table.row.end(a)
a<-table.row.start(a)
mymid <- hyperlink('midmean.htm', 'Midmean', 'click to view the definition of the Midmean')
mylabel <- paste(mymid,hyperlink('method_5.htm','Empirical Distribution Function - Interpolation',''),sep=' - ')
a<-table.element(a,mylabel,header=TRUE)
a<-table.element(a,midm[5])
a<-table.element(a,'')
a<-table.row.end(a)
a<-table.row.start(a)
mymid <- hyperlink('midmean.htm', 'Midmean', 'click to view the definition of the Midmean')
mylabel <- paste(mymid,hyperlink('method_6.htm','Closest Observation',''),sep=' - ')
a<-table.element(a,mylabel,header=TRUE)
a<-table.element(a,midm[6])
a<-table.element(a,'')
a<-table.row.end(a)
a<-table.row.start(a)
mymid <- hyperlink('midmean.htm', 'Midmean', 'click to view the definition of the Midmean')
mylabel <- paste(mymid,hyperlink('method_7.htm','True Basic - Statistics Graphics Toolkit',''),sep=' - ')
a<-table.element(a,mylabel,header=TRUE)
a<-table.element(a,midm[7])
a<-table.element(a,'')
a<-table.row.end(a)
a<-table.row.start(a)
mymid <- hyperlink('midmean.htm', 'Midmean', 'click to view the definition of the Midmean')
mylabel <- paste(mymid,hyperlink('method_8.htm','MS Excel (old versions)',''),sep=' - ')
a<-table.element(a,mylabel,header=TRUE)
a<-table.element(a,midm[8])
a<-table.element(a,'')
a<-table.row.end(a)
a<-table.row.start(a)
a<-table.element(a,'Number of observations',header=TRUE)
a<-table.element(a,length(x))
a<-table.element(a,'')
a<-table.row.end(a)
a<-table.end(a)
table.save(a,file='mytable.tab')