Free Statistics

of Irreproducible Research!

Author's title

Author*Unverified author*
R Software Modulerwasp_arimaforecasting.wasp
Title produced by softwareARIMA Forecasting
Date of computationMon, 22 Dec 2008 06:05:37 -0700
Cite this page as followsStatistical Computations at FreeStatistics.org, Office for Research Development and Education, URL https://freestatistics.org/blog/index.php?v=date/2008/Dec/22/t122995351722eni4a1mt6ugls.htm/, Retrieved Sun, 12 May 2024 20:19:26 +0000
Statistical Computations at FreeStatistics.org, Office for Research Development and Education, URL https://freestatistics.org/blog/index.php?pk=36062, Retrieved Sun, 12 May 2024 20:19:26 +0000
QR Codes:

Original text written by user:
IsPrivate?No (this computation is public)
User-defined keywords
Estimated Impact151
Family? (F = Feedback message, R = changed R code, M = changed R Module, P = changed Parameters, D = changed Data)
F       [ARIMA Forecasting] [Forecast ruwe olie ] [2008-12-22 13:05:37] [877463dd1e77cef6cce1bd646ea1af6b] [Current]
Feedback Forum
2009-01-01 22:10:46 [Kenny Simons] [reply
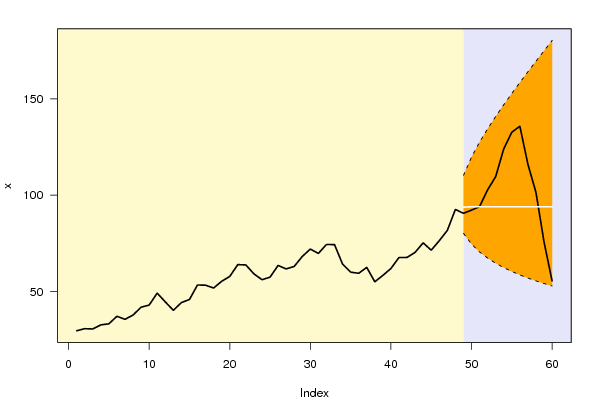
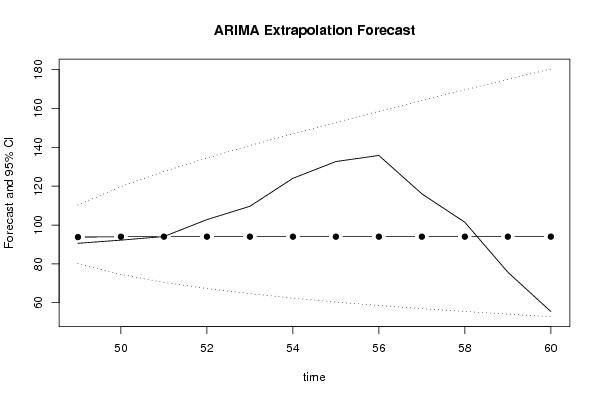
Aan de hand van de techniek van de arima backward selection was je tot de conclusie gekomen dat we te maken hadden met een niet-seizonaal AR 1- proces uitkomen. Hierdoor begrijp ik niet waarom je bij het arima forecasting de parameters p op 2 zet en q op 1. DIt had je misschien beter kunnen uitleggen, als dit geen fout is. Ook gebruik je hier wel de -0,2 als lambda waarde die je gevonden hebt, bij het berekenen van het SDM plot, maar bij de arima backward selection zet je de lambda waarde op 1.

Nochtans zal je altijd dezelfde voorspelling krijgen, namelijk deze van een randow walk. Je bent met andere woorden wel tot de juiste conclusie gekomen, maar had je had deze iets uitgebreider moeten bespreken.

Dit geldt ook voor de voorspelling van de BEL 20, daar doe je net hetzelfde met de lambda waarde. Hier had je een MA1 proces gevonden en hier zet je wel enkel de q op 1 en de andere parameters op 0, dus dit klopt wel.

Post a new message
Dataseries X:
29.59
30.7
30.52
32.67
33.19
37.13
35.54
37.75
41.84
42.94
49.14
44.61
40.22
44.23
45.85
53.38
53.26
51.8
55.3
57.81
63.96
63.77
59.15
56.12
57.42
63.52
61.71
63.01
68.18
72.03
69.75
74.41
74.33
64.24
60.03
59.44
62.5
55.04
58.34
61.92
67.65
67.68
70.3
75.26
71.44
76.36
81.71
92.6
90.6
92.23
94.09
102.79
109.65
124.05
132.69
135.81
116.07
101.42
75.73
55.48


Summary of computational transaction
Raw Inputview raw input (R code)
Raw Outputview raw output of R engine
Computing time1 seconds
R Server'Gwilym Jenkins' @ 72.249.127.135

\begin{tabular}{lllllllll}
\hline
Summary of computational transaction \tabularnewline
Raw Input & view raw input (R code)  \tabularnewline
Raw Output & view raw output of R engine  \tabularnewline
Computing time & 1 seconds \tabularnewline
R Server & 'Gwilym Jenkins' @ 72.249.127.135 \tabularnewline
\hline
\end{tabular}
%Source: https://freestatistics.org/blog/index.php?pk=36062&T=0

[TABLE]
[ROW][C]Summary of computational transaction[/C][/ROW]
[ROW][C]Raw Input[/C][C]view raw input (R code) [/C][/ROW]
[ROW][C]Raw Output[/C][C]view raw output of R engine [/C][/ROW]
[ROW][C]Computing time[/C][C]1 seconds[/C][/ROW]
[ROW][C]R Server[/C][C]'Gwilym Jenkins' @ 72.249.127.135[/C][/ROW]
[/TABLE]
Source: https://freestatistics.org/blog/index.php?pk=36062&T=0

Globally Unique Identifier (entire table): ba.freestatistics.org/blog/index.php?pk=36062&T=0

As an alternative you can also use a QR Code:  

The GUIDs for individual cells are displayed in the table below:

Summary of computational transaction
Raw Inputview raw input (R code)
Raw Outputview raw output of R engine
Computing time1 seconds
R Server'Gwilym Jenkins' @ 72.249.127.135


Univariate ARIMA Extrapolation Forecast
timeY[t]F[t]95% LB95% UBp-value(H0: Y[t] = F[t])P(F[t]>Y[t-1])P(F[t]>Y[t-s])P(F[t]>Y[48])
3659.44-------
3762.5-------
3855.04-------
3958.34-------
4061.92-------
4167.65-------
4267.68-------
4370.3-------
4475.26-------
4571.44-------
4676.36-------
4781.71-------
4892.6-------
4990.693.78480.1497110.29840.35280.55590.99990.5559
5092.2393.984674.5639119.80240.4470.60140.99840.5419
5194.0994.008670.5036127.57230.49810.54140.98140.5328
52102.7994.012267.309134.49030.33540.49850.93990.5273
53109.6594.012764.6555140.90690.25670.35690.86470.5235
54124.0594.012762.3748146.99470.13320.28150.8350.5208
55132.6994.012760.369152.85280.09880.15850.78520.5188
56135.8194.012758.5756158.54420.10210.12010.71550.5171
57116.0794.012756.9521164.11190.26870.12130.7360.5158
58101.4294.012755.4683169.58690.42380.28360.67650.5146
5975.7394.012754.1015174.99220.32910.42890.61710.5136
6055.4894.012752.8343180.34570.19080.6610.51280.5128

\begin{tabular}{lllllllll}
\hline
Univariate ARIMA Extrapolation Forecast \tabularnewline
time & Y[t] & F[t] & 95% LB & 95% UB & p-value(H0: Y[t] = F[t]) & P(F[t]>Y[t-1]) & P(F[t]>Y[t-s]) & P(F[t]>Y[48]) \tabularnewline
36 & 59.44 & - & - & - & - & - & - & - \tabularnewline
37 & 62.5 & - & - & - & - & - & - & - \tabularnewline
38 & 55.04 & - & - & - & - & - & - & - \tabularnewline
39 & 58.34 & - & - & - & - & - & - & - \tabularnewline
40 & 61.92 & - & - & - & - & - & - & - \tabularnewline
41 & 67.65 & - & - & - & - & - & - & - \tabularnewline
42 & 67.68 & - & - & - & - & - & - & - \tabularnewline
43 & 70.3 & - & - & - & - & - & - & - \tabularnewline
44 & 75.26 & - & - & - & - & - & - & - \tabularnewline
45 & 71.44 & - & - & - & - & - & - & - \tabularnewline
46 & 76.36 & - & - & - & - & - & - & - \tabularnewline
47 & 81.71 & - & - & - & - & - & - & - \tabularnewline
48 & 92.6 & - & - & - & - & - & - & - \tabularnewline
49 & 90.6 & 93.784 & 80.1497 & 110.2984 & 0.3528 & 0.5559 & 0.9999 & 0.5559 \tabularnewline
50 & 92.23 & 93.9846 & 74.5639 & 119.8024 & 0.447 & 0.6014 & 0.9984 & 0.5419 \tabularnewline
51 & 94.09 & 94.0086 & 70.5036 & 127.5723 & 0.4981 & 0.5414 & 0.9814 & 0.5328 \tabularnewline
52 & 102.79 & 94.0122 & 67.309 & 134.4903 & 0.3354 & 0.4985 & 0.9399 & 0.5273 \tabularnewline
53 & 109.65 & 94.0127 & 64.6555 & 140.9069 & 0.2567 & 0.3569 & 0.8647 & 0.5235 \tabularnewline
54 & 124.05 & 94.0127 & 62.3748 & 146.9947 & 0.1332 & 0.2815 & 0.835 & 0.5208 \tabularnewline
55 & 132.69 & 94.0127 & 60.369 & 152.8528 & 0.0988 & 0.1585 & 0.7852 & 0.5188 \tabularnewline
56 & 135.81 & 94.0127 & 58.5756 & 158.5442 & 0.1021 & 0.1201 & 0.7155 & 0.5171 \tabularnewline
57 & 116.07 & 94.0127 & 56.9521 & 164.1119 & 0.2687 & 0.1213 & 0.736 & 0.5158 \tabularnewline
58 & 101.42 & 94.0127 & 55.4683 & 169.5869 & 0.4238 & 0.2836 & 0.6765 & 0.5146 \tabularnewline
59 & 75.73 & 94.0127 & 54.1015 & 174.9922 & 0.3291 & 0.4289 & 0.6171 & 0.5136 \tabularnewline
60 & 55.48 & 94.0127 & 52.8343 & 180.3457 & 0.1908 & 0.661 & 0.5128 & 0.5128 \tabularnewline
\hline
\end{tabular}
%Source: https://freestatistics.org/blog/index.php?pk=36062&T=1

[TABLE]
[ROW][C]Univariate ARIMA Extrapolation Forecast[/C][/ROW]
[ROW][C]time[/C][C]Y[t][/C][C]F[t][/C][C]95% LB[/C][C]95% UB[/C][C]p-value(H0: Y[t] = F[t])[/C][C]P(F[t]>Y[t-1])[/C][C]P(F[t]>Y[t-s])[/C][C]P(F[t]>Y[48])[/C][/ROW]
[ROW][C]36[/C][C]59.44[/C][C]-[/C][C]-[/C][C]-[/C][C]-[/C][C]-[/C][C]-[/C][C]-[/C][/ROW]
[ROW][C]37[/C][C]62.5[/C][C]-[/C][C]-[/C][C]-[/C][C]-[/C][C]-[/C][C]-[/C][C]-[/C][/ROW]
[ROW][C]38[/C][C]55.04[/C][C]-[/C][C]-[/C][C]-[/C][C]-[/C][C]-[/C][C]-[/C][C]-[/C][/ROW]
[ROW][C]39[/C][C]58.34[/C][C]-[/C][C]-[/C][C]-[/C][C]-[/C][C]-[/C][C]-[/C][C]-[/C][/ROW]
[ROW][C]40[/C][C]61.92[/C][C]-[/C][C]-[/C][C]-[/C][C]-[/C][C]-[/C][C]-[/C][C]-[/C][/ROW]
[ROW][C]41[/C][C]67.65[/C][C]-[/C][C]-[/C][C]-[/C][C]-[/C][C]-[/C][C]-[/C][C]-[/C][/ROW]
[ROW][C]42[/C][C]67.68[/C][C]-[/C][C]-[/C][C]-[/C][C]-[/C][C]-[/C][C]-[/C][C]-[/C][/ROW]
[ROW][C]43[/C][C]70.3[/C][C]-[/C][C]-[/C][C]-[/C][C]-[/C][C]-[/C][C]-[/C][C]-[/C][/ROW]
[ROW][C]44[/C][C]75.26[/C][C]-[/C][C]-[/C][C]-[/C][C]-[/C][C]-[/C][C]-[/C][C]-[/C][/ROW]
[ROW][C]45[/C][C]71.44[/C][C]-[/C][C]-[/C][C]-[/C][C]-[/C][C]-[/C][C]-[/C][C]-[/C][/ROW]
[ROW][C]46[/C][C]76.36[/C][C]-[/C][C]-[/C][C]-[/C][C]-[/C][C]-[/C][C]-[/C][C]-[/C][/ROW]
[ROW][C]47[/C][C]81.71[/C][C]-[/C][C]-[/C][C]-[/C][C]-[/C][C]-[/C][C]-[/C][C]-[/C][/ROW]
[ROW][C]48[/C][C]92.6[/C][C]-[/C][C]-[/C][C]-[/C][C]-[/C][C]-[/C][C]-[/C][C]-[/C][/ROW]
[ROW][C]49[/C][C]90.6[/C][C]93.784[/C][C]80.1497[/C][C]110.2984[/C][C]0.3528[/C][C]0.5559[/C][C]0.9999[/C][C]0.5559[/C][/ROW]
[ROW][C]50[/C][C]92.23[/C][C]93.9846[/C][C]74.5639[/C][C]119.8024[/C][C]0.447[/C][C]0.6014[/C][C]0.9984[/C][C]0.5419[/C][/ROW]
[ROW][C]51[/C][C]94.09[/C][C]94.0086[/C][C]70.5036[/C][C]127.5723[/C][C]0.4981[/C][C]0.5414[/C][C]0.9814[/C][C]0.5328[/C][/ROW]
[ROW][C]52[/C][C]102.79[/C][C]94.0122[/C][C]67.309[/C][C]134.4903[/C][C]0.3354[/C][C]0.4985[/C][C]0.9399[/C][C]0.5273[/C][/ROW]
[ROW][C]53[/C][C]109.65[/C][C]94.0127[/C][C]64.6555[/C][C]140.9069[/C][C]0.2567[/C][C]0.3569[/C][C]0.8647[/C][C]0.5235[/C][/ROW]
[ROW][C]54[/C][C]124.05[/C][C]94.0127[/C][C]62.3748[/C][C]146.9947[/C][C]0.1332[/C][C]0.2815[/C][C]0.835[/C][C]0.5208[/C][/ROW]
[ROW][C]55[/C][C]132.69[/C][C]94.0127[/C][C]60.369[/C][C]152.8528[/C][C]0.0988[/C][C]0.1585[/C][C]0.7852[/C][C]0.5188[/C][/ROW]
[ROW][C]56[/C][C]135.81[/C][C]94.0127[/C][C]58.5756[/C][C]158.5442[/C][C]0.1021[/C][C]0.1201[/C][C]0.7155[/C][C]0.5171[/C][/ROW]
[ROW][C]57[/C][C]116.07[/C][C]94.0127[/C][C]56.9521[/C][C]164.1119[/C][C]0.2687[/C][C]0.1213[/C][C]0.736[/C][C]0.5158[/C][/ROW]
[ROW][C]58[/C][C]101.42[/C][C]94.0127[/C][C]55.4683[/C][C]169.5869[/C][C]0.4238[/C][C]0.2836[/C][C]0.6765[/C][C]0.5146[/C][/ROW]
[ROW][C]59[/C][C]75.73[/C][C]94.0127[/C][C]54.1015[/C][C]174.9922[/C][C]0.3291[/C][C]0.4289[/C][C]0.6171[/C][C]0.5136[/C][/ROW]
[ROW][C]60[/C][C]55.48[/C][C]94.0127[/C][C]52.8343[/C][C]180.3457[/C][C]0.1908[/C][C]0.661[/C][C]0.5128[/C][C]0.5128[/C][/ROW]
[/TABLE]
Source: https://freestatistics.org/blog/index.php?pk=36062&T=1

Globally Unique Identifier (entire table): ba.freestatistics.org/blog/index.php?pk=36062&T=1

As an alternative you can also use a QR Code:  

The GUIDs for individual cells are displayed in the table below:

Univariate ARIMA Extrapolation Forecast
timeY[t]F[t]95% LB95% UBp-value(H0: Y[t] = F[t])P(F[t]>Y[t-1])P(F[t]>Y[t-s])P(F[t]>Y[48])
3659.44-------
3762.5-------
3855.04-------
3958.34-------
4061.92-------
4167.65-------
4267.68-------
4370.3-------
4475.26-------
4571.44-------
4676.36-------
4781.71-------
4892.6-------
4990.693.78480.1497110.29840.35280.55590.99990.5559
5092.2393.984674.5639119.80240.4470.60140.99840.5419
5194.0994.008670.5036127.57230.49810.54140.98140.5328
52102.7994.012267.309134.49030.33540.49850.93990.5273
53109.6594.012764.6555140.90690.25670.35690.86470.5235
54124.0594.012762.3748146.99470.13320.28150.8350.5208
55132.6994.012760.369152.85280.09880.15850.78520.5188
56135.8194.012758.5756158.54420.10210.12010.71550.5171
57116.0794.012756.9521164.11190.26870.12130.7360.5158
58101.4294.012755.4683169.58690.42380.28360.67650.5146
5975.7394.012754.1015174.99220.32910.42890.61710.5136
6055.4894.012752.8343180.34570.19080.6610.51280.5128


Univariate ARIMA Extrapolation Forecast Performance
time% S.E.PEMAPESq.EMSERMSE
490.0898-0.0340.002810.13810.84480.9192
500.1402-0.01870.00163.07860.25660.5065
510.18229e-041e-040.00666e-040.0235
520.21970.09340.007877.04996.42082.5339
530.25450.16630.0139244.526520.37724.5141
540.28750.31950.0266902.238275.18658.671
550.31930.41140.03431495.9313124.660911.1652
560.35020.44460.0371747.0118145.584312.0658
570.38040.23460.0196486.523140.54366.3674
580.41010.07880.006654.86764.57232.1383
590.4395-0.19450.0162334.258227.85495.2778
600.4685-0.40990.03421484.7713123.730911.1234

\begin{tabular}{lllllllll}
\hline
Univariate ARIMA Extrapolation Forecast Performance \tabularnewline
time & % S.E. & PE & MAPE & Sq.E & MSE & RMSE \tabularnewline
49 & 0.0898 & -0.034 & 0.0028 & 10.1381 & 0.8448 & 0.9192 \tabularnewline
50 & 0.1402 & -0.0187 & 0.0016 & 3.0786 & 0.2566 & 0.5065 \tabularnewline
51 & 0.1822 & 9e-04 & 1e-04 & 0.0066 & 6e-04 & 0.0235 \tabularnewline
52 & 0.2197 & 0.0934 & 0.0078 & 77.0499 & 6.4208 & 2.5339 \tabularnewline
53 & 0.2545 & 0.1663 & 0.0139 & 244.5265 & 20.3772 & 4.5141 \tabularnewline
54 & 0.2875 & 0.3195 & 0.0266 & 902.2382 & 75.1865 & 8.671 \tabularnewline
55 & 0.3193 & 0.4114 & 0.0343 & 1495.9313 & 124.6609 & 11.1652 \tabularnewline
56 & 0.3502 & 0.4446 & 0.037 & 1747.0118 & 145.5843 & 12.0658 \tabularnewline
57 & 0.3804 & 0.2346 & 0.0196 & 486.5231 & 40.5436 & 6.3674 \tabularnewline
58 & 0.4101 & 0.0788 & 0.0066 & 54.8676 & 4.5723 & 2.1383 \tabularnewline
59 & 0.4395 & -0.1945 & 0.0162 & 334.2582 & 27.8549 & 5.2778 \tabularnewline
60 & 0.4685 & -0.4099 & 0.0342 & 1484.7713 & 123.7309 & 11.1234 \tabularnewline
\hline
\end{tabular}
%Source: https://freestatistics.org/blog/index.php?pk=36062&T=2

[TABLE]
[ROW][C]Univariate ARIMA Extrapolation Forecast Performance[/C][/ROW]
[ROW][C]time[/C][C]% S.E.[/C][C]PE[/C][C]MAPE[/C][C]Sq.E[/C][C]MSE[/C][C]RMSE[/C][/ROW]
[ROW][C]49[/C][C]0.0898[/C][C]-0.034[/C][C]0.0028[/C][C]10.1381[/C][C]0.8448[/C][C]0.9192[/C][/ROW]
[ROW][C]50[/C][C]0.1402[/C][C]-0.0187[/C][C]0.0016[/C][C]3.0786[/C][C]0.2566[/C][C]0.5065[/C][/ROW]
[ROW][C]51[/C][C]0.1822[/C][C]9e-04[/C][C]1e-04[/C][C]0.0066[/C][C]6e-04[/C][C]0.0235[/C][/ROW]
[ROW][C]52[/C][C]0.2197[/C][C]0.0934[/C][C]0.0078[/C][C]77.0499[/C][C]6.4208[/C][C]2.5339[/C][/ROW]
[ROW][C]53[/C][C]0.2545[/C][C]0.1663[/C][C]0.0139[/C][C]244.5265[/C][C]20.3772[/C][C]4.5141[/C][/ROW]
[ROW][C]54[/C][C]0.2875[/C][C]0.3195[/C][C]0.0266[/C][C]902.2382[/C][C]75.1865[/C][C]8.671[/C][/ROW]
[ROW][C]55[/C][C]0.3193[/C][C]0.4114[/C][C]0.0343[/C][C]1495.9313[/C][C]124.6609[/C][C]11.1652[/C][/ROW]
[ROW][C]56[/C][C]0.3502[/C][C]0.4446[/C][C]0.037[/C][C]1747.0118[/C][C]145.5843[/C][C]12.0658[/C][/ROW]
[ROW][C]57[/C][C]0.3804[/C][C]0.2346[/C][C]0.0196[/C][C]486.5231[/C][C]40.5436[/C][C]6.3674[/C][/ROW]
[ROW][C]58[/C][C]0.4101[/C][C]0.0788[/C][C]0.0066[/C][C]54.8676[/C][C]4.5723[/C][C]2.1383[/C][/ROW]
[ROW][C]59[/C][C]0.4395[/C][C]-0.1945[/C][C]0.0162[/C][C]334.2582[/C][C]27.8549[/C][C]5.2778[/C][/ROW]
[ROW][C]60[/C][C]0.4685[/C][C]-0.4099[/C][C]0.0342[/C][C]1484.7713[/C][C]123.7309[/C][C]11.1234[/C][/ROW]
[/TABLE]
Source: https://freestatistics.org/blog/index.php?pk=36062&T=2

Globally Unique Identifier (entire table): ba.freestatistics.org/blog/index.php?pk=36062&T=2

As an alternative you can also use a QR Code:  

The GUIDs for individual cells are displayed in the table below:

Univariate ARIMA Extrapolation Forecast Performance
time% S.E.PEMAPESq.EMSERMSE
490.0898-0.0340.002810.13810.84480.9192
500.1402-0.01870.00163.07860.25660.5065
510.18229e-041e-040.00666e-040.0235
520.21970.09340.007877.04996.42082.5339
530.25450.16630.0139244.526520.37724.5141
540.28750.31950.0266902.238275.18658.671
550.31930.41140.03431495.9313124.660911.1652
560.35020.44460.0371747.0118145.584312.0658
570.38040.23460.0196486.523140.54366.3674
580.41010.07880.006654.86764.57232.1383
590.4395-0.19450.0162334.258227.85495.2778
600.4685-0.40990.03421484.7713123.730911.1234


Parameters (Session):
par1 = 12 ; par2 = -0.2 ; par3 = 1 ; par4 = 0 ; par5 = 12 ; par6 = 2 ; par7 = 1 ; par8 = 0 ; par9 = 0 ; par10 = FALSE ;
Parameters (R input):
par1 = 12 ; par2 = -0.2 ; par3 = 1 ; par4 = 0 ; par5 = 12 ; par6 = 2 ; par7 = 1 ; par8 = 0 ; par9 = 0 ; par10 = FALSE ;
R code (references can be found in the software module):
par1 <- as.numeric(par1) #cut off periods
par2 <- as.numeric(par2) #lambda
par3 <- as.numeric(par3) #degree of non-seasonal differencing
par4 <- as.numeric(par4) #degree of seasonal differencing
par5 <- as.numeric(par5) #seasonal period
par6 <- as.numeric(par6) #p
par7 <- as.numeric(par7) #q
par8 <- as.numeric(par8) #P
par9 <- as.numeric(par9) #Q
if (par10 == 'TRUE') par10 <- TRUE
if (par10 == 'FALSE') par10 <- FALSE
if (par2 == 0) x <- log(x)
if (par2 != 0) x <- x^par2
lx <- length(x)
first <- lx - 2*par1
nx <- lx - par1
nx1 <- nx + 1
fx <- lx - nx
if (fx < 1) {
fx <- par5
nx1 <- lx + fx - 1
first <- lx - 2*fx
}
first <- 1
if (fx < 3) fx <- round(lx/10,0)
(arima.out <- arima(x[1:nx], order=c(par6,par3,par7), seasonal=list(order=c(par8,par4,par9), period=par5), include.mean=par10, method='ML'))
(forecast <- predict(arima.out,fx))
(lb <- forecast$pred - 1.96 * forecast$se)
(ub <- forecast$pred + 1.96 * forecast$se)
if (par2 == 0) {
x <- exp(x)
forecast$pred <- exp(forecast$pred)
lb <- exp(lb)
ub <- exp(ub)
}
if (par2 != 0) {
x <- x^(1/par2)
forecast$pred <- forecast$pred^(1/par2)
lb <- lb^(1/par2)
ub <- ub^(1/par2)
}
if (par2 < 0) {
olb <- lb
lb <- ub
ub <- olb
}
(actandfor <- c(x[1:nx], forecast$pred))
(perc.se <- (ub-forecast$pred)/1.96/forecast$pred)
bitmap(file='test1.png')
opar <- par(mar=c(4,4,2,2),las=1)
ylim <- c( min(x[first:nx],lb), max(x[first:nx],ub))
plot(x,ylim=ylim,type='n',xlim=c(first,lx))
usr <- par('usr')
rect(usr[1],usr[3],nx+1,usr[4],border=NA,col='lemonchiffon')
rect(nx1,usr[3],usr[2],usr[4],border=NA,col='lavender')
abline(h= (-3:3)*2 , col ='gray', lty =3)
polygon( c(nx1:lx,lx:nx1), c(lb,rev(ub)), col = 'orange', lty=2,border=NA)
lines(nx1:lx, lb , lty=2)
lines(nx1:lx, ub , lty=2)
lines(x, lwd=2)
lines(nx1:lx, forecast$pred , lwd=2 , col ='white')
box()
par(opar)
dev.off()
prob.dec <- array(NA, dim=fx)
prob.sdec <- array(NA, dim=fx)
prob.ldec <- array(NA, dim=fx)
prob.pval <- array(NA, dim=fx)
perf.pe <- array(0, dim=fx)
perf.mape <- array(0, dim=fx)
perf.se <- array(0, dim=fx)
perf.mse <- array(0, dim=fx)
perf.rmse <- array(0, dim=fx)
for (i in 1:fx) {
locSD <- (ub[i] - forecast$pred[i]) / 1.96
perf.pe[i] = (x[nx+i] - forecast$pred[i]) / forecast$pred[i]
perf.mape[i] = perf.mape[i] + abs(perf.pe[i])
perf.se[i] = (x[nx+i] - forecast$pred[i])^2
perf.mse[i] = perf.mse[i] + perf.se[i]
prob.dec[i] = pnorm((x[nx+i-1] - forecast$pred[i]) / locSD)
prob.sdec[i] = pnorm((x[nx+i-par5] - forecast$pred[i]) / locSD)
prob.ldec[i] = pnorm((x[nx] - forecast$pred[i]) / locSD)
prob.pval[i] = pnorm(abs(x[nx+i] - forecast$pred[i]) / locSD)
}
perf.mape = perf.mape / fx
perf.mse = perf.mse / fx
perf.rmse = sqrt(perf.mse)
bitmap(file='test2.png')
plot(forecast$pred, pch=19, type='b',main='ARIMA Extrapolation Forecast', ylab='Forecast and 95% CI', xlab='time',ylim=c(min(lb),max(ub)))
dum <- forecast$pred
dum[1:12] <- x[(nx+1):lx]
lines(dum, lty=1)
lines(ub,lty=3)
lines(lb,lty=3)
dev.off()
load(file='createtable')
a<-table.start()
a<-table.row.start(a)
a<-table.element(a,'Univariate ARIMA Extrapolation Forecast',9,TRUE)
a<-table.row.end(a)
a<-table.row.start(a)
a<-table.element(a,'time',1,header=TRUE)
a<-table.element(a,'Y[t]',1,header=TRUE)
a<-table.element(a,'F[t]',1,header=TRUE)
a<-table.element(a,'95% LB',1,header=TRUE)
a<-table.element(a,'95% UB',1,header=TRUE)
a<-table.element(a,'p-value
(H0: Y[t] = F[t])',1,header=TRUE)
a<-table.element(a,'P(F[t]>Y[t-1])',1,header=TRUE)
a<-table.element(a,'P(F[t]>Y[t-s])',1,header=TRUE)
mylab <- paste('P(F[t]>Y[',nx,sep='')
mylab <- paste(mylab,'])',sep='')
a<-table.element(a,mylab,1,header=TRUE)
a<-table.row.end(a)
for (i in (nx-par5):nx) {
a<-table.row.start(a)
a<-table.element(a,i,header=TRUE)
a<-table.element(a,x[i])
a<-table.element(a,'-')
a<-table.row.end(a)
}
for (i in 1:fx) {
a<-table.row.start(a)
a<-table.element(a,nx+i,header=TRUE)
a<-table.element(a,round(x[nx+i],4))
a<-table.element(a,round(forecast$pred[i],4))
a<-table.element(a,round(lb[i],4))
a<-table.element(a,round(ub[i],4))
a<-table.element(a,round((1-prob.pval[i]),4))
a<-table.element(a,round((1-prob.dec[i]),4))
a<-table.element(a,round((1-prob.sdec[i]),4))
a<-table.element(a,round((1-prob.ldec[i]),4))
a<-table.row.end(a)
}
a<-table.end(a)
table.save(a,file='mytable.tab')
a<-table.start()
a<-table.row.start(a)
a<-table.element(a,'Univariate ARIMA Extrapolation Forecast Performance',7,TRUE)
a<-table.row.end(a)
a<-table.row.start(a)
a<-table.element(a,'time',1,header=TRUE)
a<-table.element(a,'% S.E.',1,header=TRUE)
a<-table.element(a,'PE',1,header=TRUE)
a<-table.element(a,'MAPE',1,header=TRUE)
a<-table.element(a,'Sq.E',1,header=TRUE)
a<-table.element(a,'MSE',1,header=TRUE)
a<-table.element(a,'RMSE',1,header=TRUE)
a<-table.row.end(a)
for (i in 1:fx) {
a<-table.row.start(a)
a<-table.element(a,nx+i,header=TRUE)
a<-table.element(a,round(perc.se[i],4))
a<-table.element(a,round(perf.pe[i],4))
a<-table.element(a,round(perf.mape[i],4))
a<-table.element(a,round(perf.se[i],4))
a<-table.element(a,round(perf.mse[i],4))
a<-table.element(a,round(perf.rmse[i],4))
a<-table.row.end(a)
}
a<-table.end(a)
table.save(a,file='mytable1.tab')