Free Statistics

of Irreproducible Research!

Author's title

Author*The author of this computation has been verified*
R Software Modulerwasp_autocorrelation.wasp
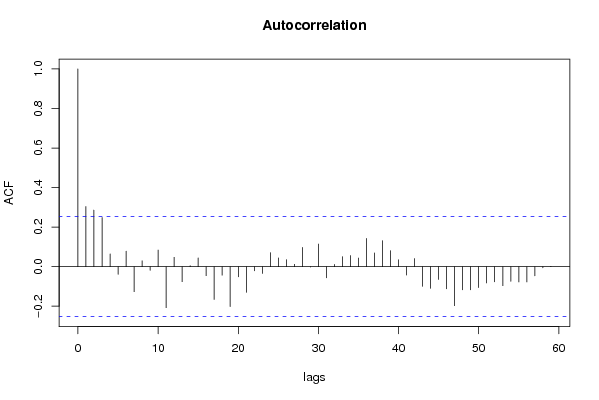
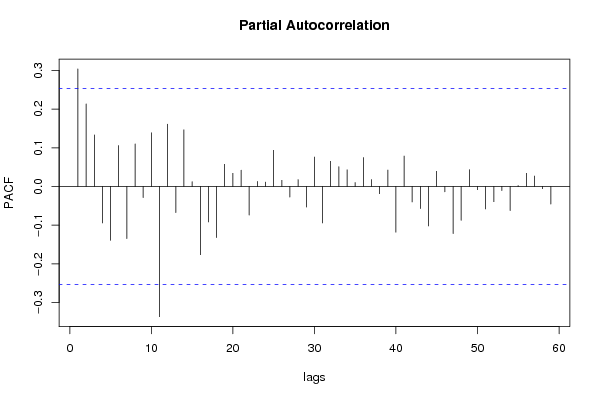
Title produced by software(Partial) Autocorrelation Function
Date of computationMon, 22 Dec 2008 05:33:54 -0700
Cite this page as followsStatistical Computations at FreeStatistics.org, Office for Research Development and Education, URL https://freestatistics.org/blog/index.php?v=date/2008/Dec/22/t12299497275ips5q7eznrxq47.htm/, Retrieved Mon, 13 May 2024 14:17:51 +0000
Statistical Computations at FreeStatistics.org, Office for Research Development and Education, URL https://freestatistics.org/blog/index.php?pk=36026, Retrieved Mon, 13 May 2024 14:17:51 +0000
QR Codes:

Original text written by user:
IsPrivate?No (this computation is public)
User-defined keywords
Estimated Impact186
Family? (F = Feedback message, R = changed R code, M = changed R Module, P = changed Parameters, D = changed Data)
-     [(Partial) Autocorrelation Function] [paper auto 1] [2007-12-01 12:01:15] [22f18fc6a98517db16300404be421f9a]
- R PD  [(Partial) Autocorrelation Function] [Paper - autocorre...] [2008-12-21 15:54:30] [1848c1c05ef454c234bcbe26cf08badc]
-   P       [(Partial) Autocorrelation Function] [Paper - ACF lambd...] [2008-12-22 12:33:54] [73ec5abea95a9c3c8c3a1ac44cab1f72] [Current]
Feedback Forum

Post a new message
Dataseries X:
2490
3266
3475
3127
2955
3870
2852
3142
3029
3180
2560
2733
2452
2553
2777
2520
2318
2873
2311
2395
2099
2268
2316
2181
2175
2627
2578
3090
2634
3225
2938
3174
3350
2588
2061
2691
2061
2918
2223
2651
2379
3146
2883
2768
3258
2839
2470
5072
1463
1600
2203
2013
2169
2640
2411
2528
2292
1988
1774
2279


Summary of computational transaction
Raw Inputview raw input (R code)
Raw Outputview raw output of R engine
Computing time1 seconds
R Server'Gwilym Jenkins' @ 72.249.127.135

\begin{tabular}{lllllllll}
\hline
Summary of computational transaction \tabularnewline
Raw Input & view raw input (R code)  \tabularnewline
Raw Output & view raw output of R engine  \tabularnewline
Computing time & 1 seconds \tabularnewline
R Server & 'Gwilym Jenkins' @ 72.249.127.135 \tabularnewline
\hline
\end{tabular}
%Source: https://freestatistics.org/blog/index.php?pk=36026&T=0

[TABLE]
[ROW][C]Summary of computational transaction[/C][/ROW]
[ROW][C]Raw Input[/C][C]view raw input (R code) [/C][/ROW]
[ROW][C]Raw Output[/C][C]view raw output of R engine [/C][/ROW]
[ROW][C]Computing time[/C][C]1 seconds[/C][/ROW]
[ROW][C]R Server[/C][C]'Gwilym Jenkins' @ 72.249.127.135[/C][/ROW]
[/TABLE]
Source: https://freestatistics.org/blog/index.php?pk=36026&T=0

Globally Unique Identifier (entire table): ba.freestatistics.org/blog/index.php?pk=36026&T=0

As an alternative you can also use a QR Code:  

The GUIDs for individual cells are displayed in the table below:

Summary of computational transaction
Raw Inputview raw input (R code)
Raw Outputview raw output of R engine
Computing time1 seconds
R Server'Gwilym Jenkins' @ 72.249.127.135


Autocorrelation Function
Time lag kACF(k)T-STATP-value
10.3037872.35310.010956
20.2858732.21440.015307
30.2485191.9250.029486
40.0643980.49880.309862
5-0.038675-0.29960.382769
60.0780370.60450.273906
7-0.126521-0.980.165505
80.0294150.22780.41027
9-0.018383-0.14240.443624
100.0840470.6510.258757
11-0.207565-1.60780.056565
120.0471060.36490.358242
13-0.075901-0.58790.279394
140.0048660.03770.485029
150.0442810.3430.366399
16-0.045652-0.35360.362431
17-0.166019-1.2860.101696
18-0.043376-0.3360.369025
19-0.20174-1.56270.061695
20-0.051567-0.39940.345495
21-0.129638-1.00420.159664
22-0.021052-0.16310.435507
23-0.034657-0.26850.394635
240.0703730.54510.293849
250.0439270.34030.367424
260.0353730.2740.392513
270.0118380.09170.463623
280.0972860.75360.227026
29-0.002311-0.01790.492887
300.1140120.88310.190345
31-0.056729-0.43940.330967
320.0110710.08580.465972
330.0501380.38840.349558
340.0560930.43450.332743
350.0435460.33730.368532
360.1425721.10440.136924
370.0691630.53570.297062
380.130991.01460.157175
390.0805710.62410.267464
400.0347920.26950.394234
41-0.042535-0.32950.371472
420.0408560.31650.376374
43-0.099813-0.77310.221235
44-0.10993-0.85150.198934
45-0.064834-0.50220.308682
46-0.11198-0.86740.19459
47-0.197328-1.52850.065822
48-0.117517-0.91030.183158
49-0.117224-0.9080.183751
50-0.105938-0.82060.207564
51-0.082487-0.63890.262645
52-0.076545-0.59290.277734
53-0.096514-0.74760.228813
54-0.074296-0.57550.283553
55-0.077584-0.6010.275065
56-0.077421-0.59970.275482
57-0.046727-0.36190.359332
58-0.00606-0.04690.481357
590.0015910.01230.495105
60NANANA

\begin{tabular}{lllllllll}
\hline
Autocorrelation Function \tabularnewline
Time lag k & ACF(k) & T-STAT & P-value \tabularnewline
1 & 0.303787 & 2.3531 & 0.010956 \tabularnewline
2 & 0.285873 & 2.2144 & 0.015307 \tabularnewline
3 & 0.248519 & 1.925 & 0.029486 \tabularnewline
4 & 0.064398 & 0.4988 & 0.309862 \tabularnewline
5 & -0.038675 & -0.2996 & 0.382769 \tabularnewline
6 & 0.078037 & 0.6045 & 0.273906 \tabularnewline
7 & -0.126521 & -0.98 & 0.165505 \tabularnewline
8 & 0.029415 & 0.2278 & 0.41027 \tabularnewline
9 & -0.018383 & -0.1424 & 0.443624 \tabularnewline
10 & 0.084047 & 0.651 & 0.258757 \tabularnewline
11 & -0.207565 & -1.6078 & 0.056565 \tabularnewline
12 & 0.047106 & 0.3649 & 0.358242 \tabularnewline
13 & -0.075901 & -0.5879 & 0.279394 \tabularnewline
14 & 0.004866 & 0.0377 & 0.485029 \tabularnewline
15 & 0.044281 & 0.343 & 0.366399 \tabularnewline
16 & -0.045652 & -0.3536 & 0.362431 \tabularnewline
17 & -0.166019 & -1.286 & 0.101696 \tabularnewline
18 & -0.043376 & -0.336 & 0.369025 \tabularnewline
19 & -0.20174 & -1.5627 & 0.061695 \tabularnewline
20 & -0.051567 & -0.3994 & 0.345495 \tabularnewline
21 & -0.129638 & -1.0042 & 0.159664 \tabularnewline
22 & -0.021052 & -0.1631 & 0.435507 \tabularnewline
23 & -0.034657 & -0.2685 & 0.394635 \tabularnewline
24 & 0.070373 & 0.5451 & 0.293849 \tabularnewline
25 & 0.043927 & 0.3403 & 0.367424 \tabularnewline
26 & 0.035373 & 0.274 & 0.392513 \tabularnewline
27 & 0.011838 & 0.0917 & 0.463623 \tabularnewline
28 & 0.097286 & 0.7536 & 0.227026 \tabularnewline
29 & -0.002311 & -0.0179 & 0.492887 \tabularnewline
30 & 0.114012 & 0.8831 & 0.190345 \tabularnewline
31 & -0.056729 & -0.4394 & 0.330967 \tabularnewline
32 & 0.011071 & 0.0858 & 0.465972 \tabularnewline
33 & 0.050138 & 0.3884 & 0.349558 \tabularnewline
34 & 0.056093 & 0.4345 & 0.332743 \tabularnewline
35 & 0.043546 & 0.3373 & 0.368532 \tabularnewline
36 & 0.142572 & 1.1044 & 0.136924 \tabularnewline
37 & 0.069163 & 0.5357 & 0.297062 \tabularnewline
38 & 0.13099 & 1.0146 & 0.157175 \tabularnewline
39 & 0.080571 & 0.6241 & 0.267464 \tabularnewline
40 & 0.034792 & 0.2695 & 0.394234 \tabularnewline
41 & -0.042535 & -0.3295 & 0.371472 \tabularnewline
42 & 0.040856 & 0.3165 & 0.376374 \tabularnewline
43 & -0.099813 & -0.7731 & 0.221235 \tabularnewline
44 & -0.10993 & -0.8515 & 0.198934 \tabularnewline
45 & -0.064834 & -0.5022 & 0.308682 \tabularnewline
46 & -0.11198 & -0.8674 & 0.19459 \tabularnewline
47 & -0.197328 & -1.5285 & 0.065822 \tabularnewline
48 & -0.117517 & -0.9103 & 0.183158 \tabularnewline
49 & -0.117224 & -0.908 & 0.183751 \tabularnewline
50 & -0.105938 & -0.8206 & 0.207564 \tabularnewline
51 & -0.082487 & -0.6389 & 0.262645 \tabularnewline
52 & -0.076545 & -0.5929 & 0.277734 \tabularnewline
53 & -0.096514 & -0.7476 & 0.228813 \tabularnewline
54 & -0.074296 & -0.5755 & 0.283553 \tabularnewline
55 & -0.077584 & -0.601 & 0.275065 \tabularnewline
56 & -0.077421 & -0.5997 & 0.275482 \tabularnewline
57 & -0.046727 & -0.3619 & 0.359332 \tabularnewline
58 & -0.00606 & -0.0469 & 0.481357 \tabularnewline
59 & 0.001591 & 0.0123 & 0.495105 \tabularnewline
60 & NA & NA & NA \tabularnewline
\hline
\end{tabular}
%Source: https://freestatistics.org/blog/index.php?pk=36026&T=1

[TABLE]
[ROW][C]Autocorrelation Function[/C][/ROW]
[ROW][C]Time lag k[/C][C]ACF(k)[/C][C]T-STAT[/C][C]P-value[/C][/ROW]
[ROW][C]1[/C][C]0.303787[/C][C]2.3531[/C][C]0.010956[/C][/ROW]
[ROW][C]2[/C][C]0.285873[/C][C]2.2144[/C][C]0.015307[/C][/ROW]
[ROW][C]3[/C][C]0.248519[/C][C]1.925[/C][C]0.029486[/C][/ROW]
[ROW][C]4[/C][C]0.064398[/C][C]0.4988[/C][C]0.309862[/C][/ROW]
[ROW][C]5[/C][C]-0.038675[/C][C]-0.2996[/C][C]0.382769[/C][/ROW]
[ROW][C]6[/C][C]0.078037[/C][C]0.6045[/C][C]0.273906[/C][/ROW]
[ROW][C]7[/C][C]-0.126521[/C][C]-0.98[/C][C]0.165505[/C][/ROW]
[ROW][C]8[/C][C]0.029415[/C][C]0.2278[/C][C]0.41027[/C][/ROW]
[ROW][C]9[/C][C]-0.018383[/C][C]-0.1424[/C][C]0.443624[/C][/ROW]
[ROW][C]10[/C][C]0.084047[/C][C]0.651[/C][C]0.258757[/C][/ROW]
[ROW][C]11[/C][C]-0.207565[/C][C]-1.6078[/C][C]0.056565[/C][/ROW]
[ROW][C]12[/C][C]0.047106[/C][C]0.3649[/C][C]0.358242[/C][/ROW]
[ROW][C]13[/C][C]-0.075901[/C][C]-0.5879[/C][C]0.279394[/C][/ROW]
[ROW][C]14[/C][C]0.004866[/C][C]0.0377[/C][C]0.485029[/C][/ROW]
[ROW][C]15[/C][C]0.044281[/C][C]0.343[/C][C]0.366399[/C][/ROW]
[ROW][C]16[/C][C]-0.045652[/C][C]-0.3536[/C][C]0.362431[/C][/ROW]
[ROW][C]17[/C][C]-0.166019[/C][C]-1.286[/C][C]0.101696[/C][/ROW]
[ROW][C]18[/C][C]-0.043376[/C][C]-0.336[/C][C]0.369025[/C][/ROW]
[ROW][C]19[/C][C]-0.20174[/C][C]-1.5627[/C][C]0.061695[/C][/ROW]
[ROW][C]20[/C][C]-0.051567[/C][C]-0.3994[/C][C]0.345495[/C][/ROW]
[ROW][C]21[/C][C]-0.129638[/C][C]-1.0042[/C][C]0.159664[/C][/ROW]
[ROW][C]22[/C][C]-0.021052[/C][C]-0.1631[/C][C]0.435507[/C][/ROW]
[ROW][C]23[/C][C]-0.034657[/C][C]-0.2685[/C][C]0.394635[/C][/ROW]
[ROW][C]24[/C][C]0.070373[/C][C]0.5451[/C][C]0.293849[/C][/ROW]
[ROW][C]25[/C][C]0.043927[/C][C]0.3403[/C][C]0.367424[/C][/ROW]
[ROW][C]26[/C][C]0.035373[/C][C]0.274[/C][C]0.392513[/C][/ROW]
[ROW][C]27[/C][C]0.011838[/C][C]0.0917[/C][C]0.463623[/C][/ROW]
[ROW][C]28[/C][C]0.097286[/C][C]0.7536[/C][C]0.227026[/C][/ROW]
[ROW][C]29[/C][C]-0.002311[/C][C]-0.0179[/C][C]0.492887[/C][/ROW]
[ROW][C]30[/C][C]0.114012[/C][C]0.8831[/C][C]0.190345[/C][/ROW]
[ROW][C]31[/C][C]-0.056729[/C][C]-0.4394[/C][C]0.330967[/C][/ROW]
[ROW][C]32[/C][C]0.011071[/C][C]0.0858[/C][C]0.465972[/C][/ROW]
[ROW][C]33[/C][C]0.050138[/C][C]0.3884[/C][C]0.349558[/C][/ROW]
[ROW][C]34[/C][C]0.056093[/C][C]0.4345[/C][C]0.332743[/C][/ROW]
[ROW][C]35[/C][C]0.043546[/C][C]0.3373[/C][C]0.368532[/C][/ROW]
[ROW][C]36[/C][C]0.142572[/C][C]1.1044[/C][C]0.136924[/C][/ROW]
[ROW][C]37[/C][C]0.069163[/C][C]0.5357[/C][C]0.297062[/C][/ROW]
[ROW][C]38[/C][C]0.13099[/C][C]1.0146[/C][C]0.157175[/C][/ROW]
[ROW][C]39[/C][C]0.080571[/C][C]0.6241[/C][C]0.267464[/C][/ROW]
[ROW][C]40[/C][C]0.034792[/C][C]0.2695[/C][C]0.394234[/C][/ROW]
[ROW][C]41[/C][C]-0.042535[/C][C]-0.3295[/C][C]0.371472[/C][/ROW]
[ROW][C]42[/C][C]0.040856[/C][C]0.3165[/C][C]0.376374[/C][/ROW]
[ROW][C]43[/C][C]-0.099813[/C][C]-0.7731[/C][C]0.221235[/C][/ROW]
[ROW][C]44[/C][C]-0.10993[/C][C]-0.8515[/C][C]0.198934[/C][/ROW]
[ROW][C]45[/C][C]-0.064834[/C][C]-0.5022[/C][C]0.308682[/C][/ROW]
[ROW][C]46[/C][C]-0.11198[/C][C]-0.8674[/C][C]0.19459[/C][/ROW]
[ROW][C]47[/C][C]-0.197328[/C][C]-1.5285[/C][C]0.065822[/C][/ROW]
[ROW][C]48[/C][C]-0.117517[/C][C]-0.9103[/C][C]0.183158[/C][/ROW]
[ROW][C]49[/C][C]-0.117224[/C][C]-0.908[/C][C]0.183751[/C][/ROW]
[ROW][C]50[/C][C]-0.105938[/C][C]-0.8206[/C][C]0.207564[/C][/ROW]
[ROW][C]51[/C][C]-0.082487[/C][C]-0.6389[/C][C]0.262645[/C][/ROW]
[ROW][C]52[/C][C]-0.076545[/C][C]-0.5929[/C][C]0.277734[/C][/ROW]
[ROW][C]53[/C][C]-0.096514[/C][C]-0.7476[/C][C]0.228813[/C][/ROW]
[ROW][C]54[/C][C]-0.074296[/C][C]-0.5755[/C][C]0.283553[/C][/ROW]
[ROW][C]55[/C][C]-0.077584[/C][C]-0.601[/C][C]0.275065[/C][/ROW]
[ROW][C]56[/C][C]-0.077421[/C][C]-0.5997[/C][C]0.275482[/C][/ROW]
[ROW][C]57[/C][C]-0.046727[/C][C]-0.3619[/C][C]0.359332[/C][/ROW]
[ROW][C]58[/C][C]-0.00606[/C][C]-0.0469[/C][C]0.481357[/C][/ROW]
[ROW][C]59[/C][C]0.001591[/C][C]0.0123[/C][C]0.495105[/C][/ROW]
[ROW][C]60[/C][C]NA[/C][C]NA[/C][C]NA[/C][/ROW]
[/TABLE]
Source: https://freestatistics.org/blog/index.php?pk=36026&T=1

Globally Unique Identifier (entire table): ba.freestatistics.org/blog/index.php?pk=36026&T=1

As an alternative you can also use a QR Code:  

The GUIDs for individual cells are displayed in the table below:

Autocorrelation Function
Time lag kACF(k)T-STATP-value
10.3037872.35310.010956
20.2858732.21440.015307
30.2485191.9250.029486
40.0643980.49880.309862
5-0.038675-0.29960.382769
60.0780370.60450.273906
7-0.126521-0.980.165505
80.0294150.22780.41027
9-0.018383-0.14240.443624
100.0840470.6510.258757
11-0.207565-1.60780.056565
120.0471060.36490.358242
13-0.075901-0.58790.279394
140.0048660.03770.485029
150.0442810.3430.366399
16-0.045652-0.35360.362431
17-0.166019-1.2860.101696
18-0.043376-0.3360.369025
19-0.20174-1.56270.061695
20-0.051567-0.39940.345495
21-0.129638-1.00420.159664
22-0.021052-0.16310.435507
23-0.034657-0.26850.394635
240.0703730.54510.293849
250.0439270.34030.367424
260.0353730.2740.392513
270.0118380.09170.463623
280.0972860.75360.227026
29-0.002311-0.01790.492887
300.1140120.88310.190345
31-0.056729-0.43940.330967
320.0110710.08580.465972
330.0501380.38840.349558
340.0560930.43450.332743
350.0435460.33730.368532
360.1425721.10440.136924
370.0691630.53570.297062
380.130991.01460.157175
390.0805710.62410.267464
400.0347920.26950.394234
41-0.042535-0.32950.371472
420.0408560.31650.376374
43-0.099813-0.77310.221235
44-0.10993-0.85150.198934
45-0.064834-0.50220.308682
46-0.11198-0.86740.19459
47-0.197328-1.52850.065822
48-0.117517-0.91030.183158
49-0.117224-0.9080.183751
50-0.105938-0.82060.207564
51-0.082487-0.63890.262645
52-0.076545-0.59290.277734
53-0.096514-0.74760.228813
54-0.074296-0.57550.283553
55-0.077584-0.6010.275065
56-0.077421-0.59970.275482
57-0.046727-0.36190.359332
58-0.00606-0.04690.481357
590.0015910.01230.495105
60NANANA


Partial Autocorrelation Function
Time lag kPACF(k)T-STATP-value
10.3037872.35310.010956
20.2132681.6520.051883
30.1331991.03180.153164
4-0.094317-0.73060.233942
5-0.139293-1.0790.142462
60.1057650.81930.207943
7-0.134705-1.04340.15047
80.1098620.8510.199079
9-0.028943-0.22420.411686
100.1386421.07390.143579
11-0.336788-2.60880.005727
120.160861.2460.108801
13-0.067644-0.5240.301115
140.1464791.13460.130524
150.012420.09620.461839
16-0.176575-1.36770.088247
17-0.091834-0.71130.239814
18-0.132373-1.02540.154655
190.0572480.44340.329522
200.0338160.26190.397133
210.0419240.32470.373254
22-0.074039-0.57350.284223
230.012740.09870.460858
240.0111250.08620.465808
250.0933470.72310.236225
260.0159320.12340.451097
27-0.027524-0.21320.415945
280.0175930.13630.446029
29-0.053373-0.41340.340385
300.0760610.58920.278981
31-0.094298-0.73040.233986
320.0648940.50270.308519
330.0511480.39620.346685
340.0430840.33370.369875
350.0101320.07850.468853
360.0747670.57910.28233
370.0176760.13690.445777
38-0.01864-0.14440.442839
390.0422980.32760.372162
40-0.118198-0.91560.181782
410.0785460.60840.272605
42-0.040237-0.31170.378185
43-0.05714-0.44260.329822
44-0.10221-0.79170.215822
450.0391340.30310.38142
46-0.013856-0.10730.457443
47-0.121945-0.94460.17433
48-0.087588-0.67850.250046
490.043320.33560.369188
50-0.008397-0.0650.474179
51-0.0584-0.45240.32632
52-0.039539-0.30630.380232
53-0.010576-0.08190.467492
54-0.062472-0.48390.315108
550.0023650.01830.492722
560.0338240.2620.397109
570.0269310.20860.41773
58-0.005902-0.04570.481843
59-0.045593-0.35320.362602
60NANANA

\begin{tabular}{lllllllll}
\hline
Partial Autocorrelation Function \tabularnewline
Time lag k & PACF(k) & T-STAT & P-value \tabularnewline
1 & 0.303787 & 2.3531 & 0.010956 \tabularnewline
2 & 0.213268 & 1.652 & 0.051883 \tabularnewline
3 & 0.133199 & 1.0318 & 0.153164 \tabularnewline
4 & -0.094317 & -0.7306 & 0.233942 \tabularnewline
5 & -0.139293 & -1.079 & 0.142462 \tabularnewline
6 & 0.105765 & 0.8193 & 0.207943 \tabularnewline
7 & -0.134705 & -1.0434 & 0.15047 \tabularnewline
8 & 0.109862 & 0.851 & 0.199079 \tabularnewline
9 & -0.028943 & -0.2242 & 0.411686 \tabularnewline
10 & 0.138642 & 1.0739 & 0.143579 \tabularnewline
11 & -0.336788 & -2.6088 & 0.005727 \tabularnewline
12 & 0.16086 & 1.246 & 0.108801 \tabularnewline
13 & -0.067644 & -0.524 & 0.301115 \tabularnewline
14 & 0.146479 & 1.1346 & 0.130524 \tabularnewline
15 & 0.01242 & 0.0962 & 0.461839 \tabularnewline
16 & -0.176575 & -1.3677 & 0.088247 \tabularnewline
17 & -0.091834 & -0.7113 & 0.239814 \tabularnewline
18 & -0.132373 & -1.0254 & 0.154655 \tabularnewline
19 & 0.057248 & 0.4434 & 0.329522 \tabularnewline
20 & 0.033816 & 0.2619 & 0.397133 \tabularnewline
21 & 0.041924 & 0.3247 & 0.373254 \tabularnewline
22 & -0.074039 & -0.5735 & 0.284223 \tabularnewline
23 & 0.01274 & 0.0987 & 0.460858 \tabularnewline
24 & 0.011125 & 0.0862 & 0.465808 \tabularnewline
25 & 0.093347 & 0.7231 & 0.236225 \tabularnewline
26 & 0.015932 & 0.1234 & 0.451097 \tabularnewline
27 & -0.027524 & -0.2132 & 0.415945 \tabularnewline
28 & 0.017593 & 0.1363 & 0.446029 \tabularnewline
29 & -0.053373 & -0.4134 & 0.340385 \tabularnewline
30 & 0.076061 & 0.5892 & 0.278981 \tabularnewline
31 & -0.094298 & -0.7304 & 0.233986 \tabularnewline
32 & 0.064894 & 0.5027 & 0.308519 \tabularnewline
33 & 0.051148 & 0.3962 & 0.346685 \tabularnewline
34 & 0.043084 & 0.3337 & 0.369875 \tabularnewline
35 & 0.010132 & 0.0785 & 0.468853 \tabularnewline
36 & 0.074767 & 0.5791 & 0.28233 \tabularnewline
37 & 0.017676 & 0.1369 & 0.445777 \tabularnewline
38 & -0.01864 & -0.1444 & 0.442839 \tabularnewline
39 & 0.042298 & 0.3276 & 0.372162 \tabularnewline
40 & -0.118198 & -0.9156 & 0.181782 \tabularnewline
41 & 0.078546 & 0.6084 & 0.272605 \tabularnewline
42 & -0.040237 & -0.3117 & 0.378185 \tabularnewline
43 & -0.05714 & -0.4426 & 0.329822 \tabularnewline
44 & -0.10221 & -0.7917 & 0.215822 \tabularnewline
45 & 0.039134 & 0.3031 & 0.38142 \tabularnewline
46 & -0.013856 & -0.1073 & 0.457443 \tabularnewline
47 & -0.121945 & -0.9446 & 0.17433 \tabularnewline
48 & -0.087588 & -0.6785 & 0.250046 \tabularnewline
49 & 0.04332 & 0.3356 & 0.369188 \tabularnewline
50 & -0.008397 & -0.065 & 0.474179 \tabularnewline
51 & -0.0584 & -0.4524 & 0.32632 \tabularnewline
52 & -0.039539 & -0.3063 & 0.380232 \tabularnewline
53 & -0.010576 & -0.0819 & 0.467492 \tabularnewline
54 & -0.062472 & -0.4839 & 0.315108 \tabularnewline
55 & 0.002365 & 0.0183 & 0.492722 \tabularnewline
56 & 0.033824 & 0.262 & 0.397109 \tabularnewline
57 & 0.026931 & 0.2086 & 0.41773 \tabularnewline
58 & -0.005902 & -0.0457 & 0.481843 \tabularnewline
59 & -0.045593 & -0.3532 & 0.362602 \tabularnewline
60 & NA & NA & NA \tabularnewline
\hline
\end{tabular}
%Source: https://freestatistics.org/blog/index.php?pk=36026&T=2

[TABLE]
[ROW][C]Partial Autocorrelation Function[/C][/ROW]
[ROW][C]Time lag k[/C][C]PACF(k)[/C][C]T-STAT[/C][C]P-value[/C][/ROW]
[ROW][C]1[/C][C]0.303787[/C][C]2.3531[/C][C]0.010956[/C][/ROW]
[ROW][C]2[/C][C]0.213268[/C][C]1.652[/C][C]0.051883[/C][/ROW]
[ROW][C]3[/C][C]0.133199[/C][C]1.0318[/C][C]0.153164[/C][/ROW]
[ROW][C]4[/C][C]-0.094317[/C][C]-0.7306[/C][C]0.233942[/C][/ROW]
[ROW][C]5[/C][C]-0.139293[/C][C]-1.079[/C][C]0.142462[/C][/ROW]
[ROW][C]6[/C][C]0.105765[/C][C]0.8193[/C][C]0.207943[/C][/ROW]
[ROW][C]7[/C][C]-0.134705[/C][C]-1.0434[/C][C]0.15047[/C][/ROW]
[ROW][C]8[/C][C]0.109862[/C][C]0.851[/C][C]0.199079[/C][/ROW]
[ROW][C]9[/C][C]-0.028943[/C][C]-0.2242[/C][C]0.411686[/C][/ROW]
[ROW][C]10[/C][C]0.138642[/C][C]1.0739[/C][C]0.143579[/C][/ROW]
[ROW][C]11[/C][C]-0.336788[/C][C]-2.6088[/C][C]0.005727[/C][/ROW]
[ROW][C]12[/C][C]0.16086[/C][C]1.246[/C][C]0.108801[/C][/ROW]
[ROW][C]13[/C][C]-0.067644[/C][C]-0.524[/C][C]0.301115[/C][/ROW]
[ROW][C]14[/C][C]0.146479[/C][C]1.1346[/C][C]0.130524[/C][/ROW]
[ROW][C]15[/C][C]0.01242[/C][C]0.0962[/C][C]0.461839[/C][/ROW]
[ROW][C]16[/C][C]-0.176575[/C][C]-1.3677[/C][C]0.088247[/C][/ROW]
[ROW][C]17[/C][C]-0.091834[/C][C]-0.7113[/C][C]0.239814[/C][/ROW]
[ROW][C]18[/C][C]-0.132373[/C][C]-1.0254[/C][C]0.154655[/C][/ROW]
[ROW][C]19[/C][C]0.057248[/C][C]0.4434[/C][C]0.329522[/C][/ROW]
[ROW][C]20[/C][C]0.033816[/C][C]0.2619[/C][C]0.397133[/C][/ROW]
[ROW][C]21[/C][C]0.041924[/C][C]0.3247[/C][C]0.373254[/C][/ROW]
[ROW][C]22[/C][C]-0.074039[/C][C]-0.5735[/C][C]0.284223[/C][/ROW]
[ROW][C]23[/C][C]0.01274[/C][C]0.0987[/C][C]0.460858[/C][/ROW]
[ROW][C]24[/C][C]0.011125[/C][C]0.0862[/C][C]0.465808[/C][/ROW]
[ROW][C]25[/C][C]0.093347[/C][C]0.7231[/C][C]0.236225[/C][/ROW]
[ROW][C]26[/C][C]0.015932[/C][C]0.1234[/C][C]0.451097[/C][/ROW]
[ROW][C]27[/C][C]-0.027524[/C][C]-0.2132[/C][C]0.415945[/C][/ROW]
[ROW][C]28[/C][C]0.017593[/C][C]0.1363[/C][C]0.446029[/C][/ROW]
[ROW][C]29[/C][C]-0.053373[/C][C]-0.4134[/C][C]0.340385[/C][/ROW]
[ROW][C]30[/C][C]0.076061[/C][C]0.5892[/C][C]0.278981[/C][/ROW]
[ROW][C]31[/C][C]-0.094298[/C][C]-0.7304[/C][C]0.233986[/C][/ROW]
[ROW][C]32[/C][C]0.064894[/C][C]0.5027[/C][C]0.308519[/C][/ROW]
[ROW][C]33[/C][C]0.051148[/C][C]0.3962[/C][C]0.346685[/C][/ROW]
[ROW][C]34[/C][C]0.043084[/C][C]0.3337[/C][C]0.369875[/C][/ROW]
[ROW][C]35[/C][C]0.010132[/C][C]0.0785[/C][C]0.468853[/C][/ROW]
[ROW][C]36[/C][C]0.074767[/C][C]0.5791[/C][C]0.28233[/C][/ROW]
[ROW][C]37[/C][C]0.017676[/C][C]0.1369[/C][C]0.445777[/C][/ROW]
[ROW][C]38[/C][C]-0.01864[/C][C]-0.1444[/C][C]0.442839[/C][/ROW]
[ROW][C]39[/C][C]0.042298[/C][C]0.3276[/C][C]0.372162[/C][/ROW]
[ROW][C]40[/C][C]-0.118198[/C][C]-0.9156[/C][C]0.181782[/C][/ROW]
[ROW][C]41[/C][C]0.078546[/C][C]0.6084[/C][C]0.272605[/C][/ROW]
[ROW][C]42[/C][C]-0.040237[/C][C]-0.3117[/C][C]0.378185[/C][/ROW]
[ROW][C]43[/C][C]-0.05714[/C][C]-0.4426[/C][C]0.329822[/C][/ROW]
[ROW][C]44[/C][C]-0.10221[/C][C]-0.7917[/C][C]0.215822[/C][/ROW]
[ROW][C]45[/C][C]0.039134[/C][C]0.3031[/C][C]0.38142[/C][/ROW]
[ROW][C]46[/C][C]-0.013856[/C][C]-0.1073[/C][C]0.457443[/C][/ROW]
[ROW][C]47[/C][C]-0.121945[/C][C]-0.9446[/C][C]0.17433[/C][/ROW]
[ROW][C]48[/C][C]-0.087588[/C][C]-0.6785[/C][C]0.250046[/C][/ROW]
[ROW][C]49[/C][C]0.04332[/C][C]0.3356[/C][C]0.369188[/C][/ROW]
[ROW][C]50[/C][C]-0.008397[/C][C]-0.065[/C][C]0.474179[/C][/ROW]
[ROW][C]51[/C][C]-0.0584[/C][C]-0.4524[/C][C]0.32632[/C][/ROW]
[ROW][C]52[/C][C]-0.039539[/C][C]-0.3063[/C][C]0.380232[/C][/ROW]
[ROW][C]53[/C][C]-0.010576[/C][C]-0.0819[/C][C]0.467492[/C][/ROW]
[ROW][C]54[/C][C]-0.062472[/C][C]-0.4839[/C][C]0.315108[/C][/ROW]
[ROW][C]55[/C][C]0.002365[/C][C]0.0183[/C][C]0.492722[/C][/ROW]
[ROW][C]56[/C][C]0.033824[/C][C]0.262[/C][C]0.397109[/C][/ROW]
[ROW][C]57[/C][C]0.026931[/C][C]0.2086[/C][C]0.41773[/C][/ROW]
[ROW][C]58[/C][C]-0.005902[/C][C]-0.0457[/C][C]0.481843[/C][/ROW]
[ROW][C]59[/C][C]-0.045593[/C][C]-0.3532[/C][C]0.362602[/C][/ROW]
[ROW][C]60[/C][C]NA[/C][C]NA[/C][C]NA[/C][/ROW]
[/TABLE]
Source: https://freestatistics.org/blog/index.php?pk=36026&T=2

Globally Unique Identifier (entire table): ba.freestatistics.org/blog/index.php?pk=36026&T=2

As an alternative you can also use a QR Code:  

The GUIDs for individual cells are displayed in the table below:

Partial Autocorrelation Function
Time lag kPACF(k)T-STATP-value
10.3037872.35310.010956
20.2132681.6520.051883
30.1331991.03180.153164
4-0.094317-0.73060.233942
5-0.139293-1.0790.142462
60.1057650.81930.207943
7-0.134705-1.04340.15047
80.1098620.8510.199079
9-0.028943-0.22420.411686
100.1386421.07390.143579
11-0.336788-2.60880.005727
120.160861.2460.108801
13-0.067644-0.5240.301115
140.1464791.13460.130524
150.012420.09620.461839
16-0.176575-1.36770.088247
17-0.091834-0.71130.239814
18-0.132373-1.02540.154655
190.0572480.44340.329522
200.0338160.26190.397133
210.0419240.32470.373254
22-0.074039-0.57350.284223
230.012740.09870.460858
240.0111250.08620.465808
250.0933470.72310.236225
260.0159320.12340.451097
27-0.027524-0.21320.415945
280.0175930.13630.446029
29-0.053373-0.41340.340385
300.0760610.58920.278981
31-0.094298-0.73040.233986
320.0648940.50270.308519
330.0511480.39620.346685
340.0430840.33370.369875
350.0101320.07850.468853
360.0747670.57910.28233
370.0176760.13690.445777
38-0.01864-0.14440.442839
390.0422980.32760.372162
40-0.118198-0.91560.181782
410.0785460.60840.272605
42-0.040237-0.31170.378185
43-0.05714-0.44260.329822
44-0.10221-0.79170.215822
450.0391340.30310.38142
46-0.013856-0.10730.457443
47-0.121945-0.94460.17433
48-0.087588-0.67850.250046
490.043320.33560.369188
50-0.008397-0.0650.474179
51-0.0584-0.45240.32632
52-0.039539-0.30630.380232
53-0.010576-0.08190.467492
54-0.062472-0.48390.315108
550.0023650.01830.492722
560.0338240.2620.397109
570.0269310.20860.41773
58-0.005902-0.04570.481843
59-0.045593-0.35320.362602
60NANANA


Parameters (Session):
par1 = 60 ; par2 = -0.4 ; par3 = 0 ; par4 = 0 ; par5 = 12 ;
Parameters (R input):
par1 = 60 ; par2 = -0.4 ; par3 = 0 ; par4 = 0 ; par5 = 12 ;
R code (references can be found in the software module):
if (par1 == 'Default') {
par1 = 10*log10(length(x))
} else {
par1 <- as.numeric(par1)
}
par2 <- as.numeric(par2)
par3 <- as.numeric(par3)
par4 <- as.numeric(par4)
par5 <- as.numeric(par5)
if (par2 == 0) {
x <- log(x)
} else {
x <- (x ^ par2 - 1) / par2
}
if (par3 > 0) x <- diff(x,lag=1,difference=par3)
if (par4 > 0) x <- diff(x,lag=par5,difference=par4)
bitmap(file='pic1.png')
racf <- acf(x,par1,main='Autocorrelation',xlab='lags',ylab='ACF')
dev.off()
bitmap(file='pic2.png')
rpacf <- pacf(x,par1,main='Partial Autocorrelation',xlab='lags',ylab='PACF')
dev.off()
(myacf <- c(racf$acf))
(mypacf <- c(rpacf$acf))
lengthx <- length(x)
sqrtn <- sqrt(lengthx)
load(file='createtable')
a<-table.start()
a<-table.row.start(a)
a<-table.element(a,'Autocorrelation Function',4,TRUE)
a<-table.row.end(a)
a<-table.row.start(a)
a<-table.element(a,'Time lag k',header=TRUE)
a<-table.element(a,hyperlink('basics.htm','ACF(k)','click here for more information about the Autocorrelation Function'),header=TRUE)
a<-table.element(a,'T-STAT',header=TRUE)
a<-table.element(a,'P-value',header=TRUE)
a<-table.row.end(a)
for (i in 2:(par1+1)) {
a<-table.row.start(a)
a<-table.element(a,i-1,header=TRUE)
a<-table.element(a,round(myacf[i],6))
mytstat <- myacf[i]*sqrtn
a<-table.element(a,round(mytstat,4))
a<-table.element(a,round(1-pt(abs(mytstat),lengthx),6))
a<-table.row.end(a)
}
a<-table.end(a)
table.save(a,file='mytable.tab')
a<-table.start()
a<-table.row.start(a)
a<-table.element(a,'Partial Autocorrelation Function',4,TRUE)
a<-table.row.end(a)
a<-table.row.start(a)
a<-table.element(a,'Time lag k',header=TRUE)
a<-table.element(a,hyperlink('basics.htm','PACF(k)','click here for more information about the Partial Autocorrelation Function'),header=TRUE)
a<-table.element(a,'T-STAT',header=TRUE)
a<-table.element(a,'P-value',header=TRUE)
a<-table.row.end(a)
for (i in 1:par1) {
a<-table.row.start(a)
a<-table.element(a,i,header=TRUE)
a<-table.element(a,round(mypacf[i],6))
mytstat <- mypacf[i]*sqrtn
a<-table.element(a,round(mytstat,4))
a<-table.element(a,round(1-pt(abs(mytstat),lengthx),6))
a<-table.row.end(a)
}
a<-table.end(a)
table.save(a,file='mytable1.tab')