Free Statistics

of Irreproducible Research!

Author's title

Author*The author of this computation has been verified*
R Software Modulerwasp_autocorrelation.wasp
Title produced by software(Partial) Autocorrelation Function
Date of computationMon, 22 Dec 2008 05:31:57 -0700
Cite this page as followsStatistical Computations at FreeStatistics.org, Office for Research Development and Education, URL https://freestatistics.org/blog/index.php?v=date/2008/Dec/22/t1229949208frgokgjkndg6l40.htm/, Retrieved Sun, 12 May 2024 17:11:31 +0000
Statistical Computations at FreeStatistics.org, Office for Research Development and Education, URL https://freestatistics.org/blog/index.php?pk=36021, Retrieved Sun, 12 May 2024 17:11:31 +0000
QR Codes:

Original text written by user:
IsPrivate?No (this computation is public)
User-defined keywords
Estimated Impact179
Family? (F = Feedback message, R = changed R code, M = changed R Module, P = changed Parameters, D = changed Data)
-     [(Partial) Autocorrelation Function] [(P)ACF werkloosheid] [2008-12-21 22:54:14] [7a4703cb85a198d9845d72899eff0288]
-   P   [(Partial) Autocorrelation Function] [(P)ACF werkloosheid] [2008-12-21 23:29:15] [7a4703cb85a198d9845d72899eff0288]
-   P     [(Partial) Autocorrelation Function] [(P)ACF werklooshe...] [2008-12-22 12:23:56] [7a4703cb85a198d9845d72899eff0288]
-   P         [(Partial) Autocorrelation Function] [(P)ACF Werklooshe...] [2008-12-22 12:31:57] [9f72e095d5529918bf5b0810c01bf6ce] [Current]
Feedback Forum

Post a new message
Dataseries X:
467
460
448
443
436
431
484
510
513
503
471
471
476
475
470
461
455
456
517
525
523
519
509
512
519
517
510
509
501
507
569
580
578
565
547
555


Summary of computational transaction
Raw Inputview raw input (R code)
Raw Outputview raw output of R engine
Computing time1 seconds
R Server'Gwilym Jenkins' @ 72.249.127.135

\begin{tabular}{lllllllll}
\hline
Summary of computational transaction \tabularnewline
Raw Input & view raw input (R code)  \tabularnewline
Raw Output & view raw output of R engine  \tabularnewline
Computing time & 1 seconds \tabularnewline
R Server & 'Gwilym Jenkins' @ 72.249.127.135 \tabularnewline
\hline
\end{tabular}
%Source: https://freestatistics.org/blog/index.php?pk=36021&T=0

[TABLE]
[ROW][C]Summary of computational transaction[/C][/ROW]
[ROW][C]Raw Input[/C][C]view raw input (R code) [/C][/ROW]
[ROW][C]Raw Output[/C][C]view raw output of R engine [/C][/ROW]
[ROW][C]Computing time[/C][C]1 seconds[/C][/ROW]
[ROW][C]R Server[/C][C]'Gwilym Jenkins' @ 72.249.127.135[/C][/ROW]
[/TABLE]
Source: https://freestatistics.org/blog/index.php?pk=36021&T=0

Globally Unique Identifier (entire table): ba.freestatistics.org/blog/index.php?pk=36021&T=0

As an alternative you can also use a QR Code:  

The GUIDs for individual cells are displayed in the table below:

Summary of computational transaction
Raw Inputview raw input (R code)
Raw Outputview raw output of R engine
Computing time1 seconds
R Server'Gwilym Jenkins' @ 72.249.127.135


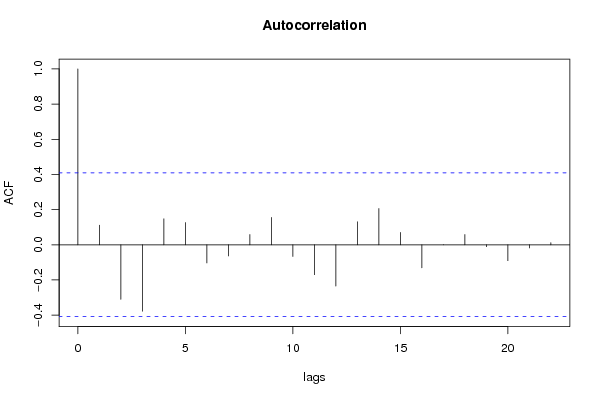
Autocorrelation Function
Time lag kACF(k)T-STATP-value
10.1111610.53310.299535
2-0.31016-1.48750.075236
3-0.377553-1.81070.041637
40.1479270.70940.242593
50.1266720.60750.274736
6-0.103466-0.49620.312229
7-0.063368-0.30390.381967
80.0582010.27910.391323
90.1554080.74530.231817
10-0.066145-0.31720.376968
11-0.169999-0.81530.211635
12-0.235006-1.1270.135672
130.1307460.6270.268405
140.2057460.98670.167023
150.0704370.33780.369287
16-0.131229-0.62940.26766
17-0.000412-0.0020.49922
180.0583790.280.390999
19-0.010903-0.05230.479374
20-0.090726-0.43510.33377
21-0.017848-0.08560.466264
220.012140.05820.477038
23NANANA
24NANANA
25NANANA
26NANANA
27NANANA
28NANANA
29NANANA
30NANANA
31NANANA
32NANANA
33NANANA
34NANANA
35NANANA
36NANANA

\begin{tabular}{lllllllll}
\hline
Autocorrelation Function \tabularnewline
Time lag k & ACF(k) & T-STAT & P-value \tabularnewline
1 & 0.111161 & 0.5331 & 0.299535 \tabularnewline
2 & -0.31016 & -1.4875 & 0.075236 \tabularnewline
3 & -0.377553 & -1.8107 & 0.041637 \tabularnewline
4 & 0.147927 & 0.7094 & 0.242593 \tabularnewline
5 & 0.126672 & 0.6075 & 0.274736 \tabularnewline
6 & -0.103466 & -0.4962 & 0.312229 \tabularnewline
7 & -0.063368 & -0.3039 & 0.381967 \tabularnewline
8 & 0.058201 & 0.2791 & 0.391323 \tabularnewline
9 & 0.155408 & 0.7453 & 0.231817 \tabularnewline
10 & -0.066145 & -0.3172 & 0.376968 \tabularnewline
11 & -0.169999 & -0.8153 & 0.211635 \tabularnewline
12 & -0.235006 & -1.127 & 0.135672 \tabularnewline
13 & 0.130746 & 0.627 & 0.268405 \tabularnewline
14 & 0.205746 & 0.9867 & 0.167023 \tabularnewline
15 & 0.070437 & 0.3378 & 0.369287 \tabularnewline
16 & -0.131229 & -0.6294 & 0.26766 \tabularnewline
17 & -0.000412 & -0.002 & 0.49922 \tabularnewline
18 & 0.058379 & 0.28 & 0.390999 \tabularnewline
19 & -0.010903 & -0.0523 & 0.479374 \tabularnewline
20 & -0.090726 & -0.4351 & 0.33377 \tabularnewline
21 & -0.017848 & -0.0856 & 0.466264 \tabularnewline
22 & 0.01214 & 0.0582 & 0.477038 \tabularnewline
23 & NA & NA & NA \tabularnewline
24 & NA & NA & NA \tabularnewline
25 & NA & NA & NA \tabularnewline
26 & NA & NA & NA \tabularnewline
27 & NA & NA & NA \tabularnewline
28 & NA & NA & NA \tabularnewline
29 & NA & NA & NA \tabularnewline
30 & NA & NA & NA \tabularnewline
31 & NA & NA & NA \tabularnewline
32 & NA & NA & NA \tabularnewline
33 & NA & NA & NA \tabularnewline
34 & NA & NA & NA \tabularnewline
35 & NA & NA & NA \tabularnewline
36 & NA & NA & NA \tabularnewline
\hline
\end{tabular}
%Source: https://freestatistics.org/blog/index.php?pk=36021&T=1

[TABLE]
[ROW][C]Autocorrelation Function[/C][/ROW]
[ROW][C]Time lag k[/C][C]ACF(k)[/C][C]T-STAT[/C][C]P-value[/C][/ROW]
[ROW][C]1[/C][C]0.111161[/C][C]0.5331[/C][C]0.299535[/C][/ROW]
[ROW][C]2[/C][C]-0.31016[/C][C]-1.4875[/C][C]0.075236[/C][/ROW]
[ROW][C]3[/C][C]-0.377553[/C][C]-1.8107[/C][C]0.041637[/C][/ROW]
[ROW][C]4[/C][C]0.147927[/C][C]0.7094[/C][C]0.242593[/C][/ROW]
[ROW][C]5[/C][C]0.126672[/C][C]0.6075[/C][C]0.274736[/C][/ROW]
[ROW][C]6[/C][C]-0.103466[/C][C]-0.4962[/C][C]0.312229[/C][/ROW]
[ROW][C]7[/C][C]-0.063368[/C][C]-0.3039[/C][C]0.381967[/C][/ROW]
[ROW][C]8[/C][C]0.058201[/C][C]0.2791[/C][C]0.391323[/C][/ROW]
[ROW][C]9[/C][C]0.155408[/C][C]0.7453[/C][C]0.231817[/C][/ROW]
[ROW][C]10[/C][C]-0.066145[/C][C]-0.3172[/C][C]0.376968[/C][/ROW]
[ROW][C]11[/C][C]-0.169999[/C][C]-0.8153[/C][C]0.211635[/C][/ROW]
[ROW][C]12[/C][C]-0.235006[/C][C]-1.127[/C][C]0.135672[/C][/ROW]
[ROW][C]13[/C][C]0.130746[/C][C]0.627[/C][C]0.268405[/C][/ROW]
[ROW][C]14[/C][C]0.205746[/C][C]0.9867[/C][C]0.167023[/C][/ROW]
[ROW][C]15[/C][C]0.070437[/C][C]0.3378[/C][C]0.369287[/C][/ROW]
[ROW][C]16[/C][C]-0.131229[/C][C]-0.6294[/C][C]0.26766[/C][/ROW]
[ROW][C]17[/C][C]-0.000412[/C][C]-0.002[/C][C]0.49922[/C][/ROW]
[ROW][C]18[/C][C]0.058379[/C][C]0.28[/C][C]0.390999[/C][/ROW]
[ROW][C]19[/C][C]-0.010903[/C][C]-0.0523[/C][C]0.479374[/C][/ROW]
[ROW][C]20[/C][C]-0.090726[/C][C]-0.4351[/C][C]0.33377[/C][/ROW]
[ROW][C]21[/C][C]-0.017848[/C][C]-0.0856[/C][C]0.466264[/C][/ROW]
[ROW][C]22[/C][C]0.01214[/C][C]0.0582[/C][C]0.477038[/C][/ROW]
[ROW][C]23[/C][C]NA[/C][C]NA[/C][C]NA[/C][/ROW]
[ROW][C]24[/C][C]NA[/C][C]NA[/C][C]NA[/C][/ROW]
[ROW][C]25[/C][C]NA[/C][C]NA[/C][C]NA[/C][/ROW]
[ROW][C]26[/C][C]NA[/C][C]NA[/C][C]NA[/C][/ROW]
[ROW][C]27[/C][C]NA[/C][C]NA[/C][C]NA[/C][/ROW]
[ROW][C]28[/C][C]NA[/C][C]NA[/C][C]NA[/C][/ROW]
[ROW][C]29[/C][C]NA[/C][C]NA[/C][C]NA[/C][/ROW]
[ROW][C]30[/C][C]NA[/C][C]NA[/C][C]NA[/C][/ROW]
[ROW][C]31[/C][C]NA[/C][C]NA[/C][C]NA[/C][/ROW]
[ROW][C]32[/C][C]NA[/C][C]NA[/C][C]NA[/C][/ROW]
[ROW][C]33[/C][C]NA[/C][C]NA[/C][C]NA[/C][/ROW]
[ROW][C]34[/C][C]NA[/C][C]NA[/C][C]NA[/C][/ROW]
[ROW][C]35[/C][C]NA[/C][C]NA[/C][C]NA[/C][/ROW]
[ROW][C]36[/C][C]NA[/C][C]NA[/C][C]NA[/C][/ROW]
[/TABLE]
Source: https://freestatistics.org/blog/index.php?pk=36021&T=1

Globally Unique Identifier (entire table): ba.freestatistics.org/blog/index.php?pk=36021&T=1

As an alternative you can also use a QR Code:  

The GUIDs for individual cells are displayed in the table below:

Autocorrelation Function
Time lag kACF(k)T-STATP-value
10.1111610.53310.299535
2-0.31016-1.48750.075236
3-0.377553-1.81070.041637
40.1479270.70940.242593
50.1266720.60750.274736
6-0.103466-0.49620.312229
7-0.063368-0.30390.381967
80.0582010.27910.391323
90.1554080.74530.231817
10-0.066145-0.31720.376968
11-0.169999-0.81530.211635
12-0.235006-1.1270.135672
130.1307460.6270.268405
140.2057460.98670.167023
150.0704370.33780.369287
16-0.131229-0.62940.26766
17-0.000412-0.0020.49922
180.0583790.280.390999
19-0.010903-0.05230.479374
20-0.090726-0.43510.33377
21-0.017848-0.08560.466264
220.012140.05820.477038
23NANANA
24NANANA
25NANANA
26NANANA
27NANANA
28NANANA
29NANANA
30NANANA
31NANANA
32NANANA
33NANANA
34NANANA
35NANANA
36NANANA


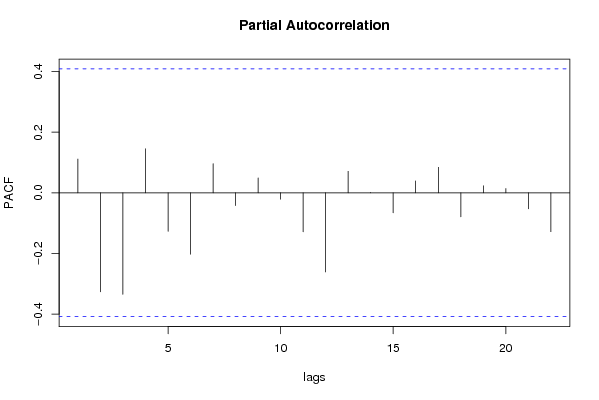
Partial Autocorrelation Function
Time lag kPACF(k)T-STATP-value
10.1111610.53310.299535
2-0.326552-1.56610.065492
3-0.33493-1.60630.060929
40.1449860.69530.246908
5-0.126915-0.60870.274356
6-0.202421-0.97080.17088
70.095980.46030.32481
8-0.042226-0.20250.420649
90.049120.23560.407926
10-0.021136-0.10140.460069
11-0.12879-0.61770.271434
12-0.261112-1.25220.111532
130.0709920.34050.368298
140.0009630.00460.498177
15-0.066132-0.31720.376992
160.0389890.1870.426656
170.0843220.40440.344829
18-0.079264-0.38010.353666
190.0228950.10980.45676
200.0139960.06710.473532
21-0.052698-0.25270.40136
22-0.128309-0.61540.272182
23NANANA
24NANANA
25NANANA
26NANANA
27NANANA
28NANANA
29NANANA
30NANANA
31NANANA
32NANANA
33NANANA
34NANANA
35NANANA
36NANANA

\begin{tabular}{lllllllll}
\hline
Partial Autocorrelation Function \tabularnewline
Time lag k & PACF(k) & T-STAT & P-value \tabularnewline
1 & 0.111161 & 0.5331 & 0.299535 \tabularnewline
2 & -0.326552 & -1.5661 & 0.065492 \tabularnewline
3 & -0.33493 & -1.6063 & 0.060929 \tabularnewline
4 & 0.144986 & 0.6953 & 0.246908 \tabularnewline
5 & -0.126915 & -0.6087 & 0.274356 \tabularnewline
6 & -0.202421 & -0.9708 & 0.17088 \tabularnewline
7 & 0.09598 & 0.4603 & 0.32481 \tabularnewline
8 & -0.042226 & -0.2025 & 0.420649 \tabularnewline
9 & 0.04912 & 0.2356 & 0.407926 \tabularnewline
10 & -0.021136 & -0.1014 & 0.460069 \tabularnewline
11 & -0.12879 & -0.6177 & 0.271434 \tabularnewline
12 & -0.261112 & -1.2522 & 0.111532 \tabularnewline
13 & 0.070992 & 0.3405 & 0.368298 \tabularnewline
14 & 0.000963 & 0.0046 & 0.498177 \tabularnewline
15 & -0.066132 & -0.3172 & 0.376992 \tabularnewline
16 & 0.038989 & 0.187 & 0.426656 \tabularnewline
17 & 0.084322 & 0.4044 & 0.344829 \tabularnewline
18 & -0.079264 & -0.3801 & 0.353666 \tabularnewline
19 & 0.022895 & 0.1098 & 0.45676 \tabularnewline
20 & 0.013996 & 0.0671 & 0.473532 \tabularnewline
21 & -0.052698 & -0.2527 & 0.40136 \tabularnewline
22 & -0.128309 & -0.6154 & 0.272182 \tabularnewline
23 & NA & NA & NA \tabularnewline
24 & NA & NA & NA \tabularnewline
25 & NA & NA & NA \tabularnewline
26 & NA & NA & NA \tabularnewline
27 & NA & NA & NA \tabularnewline
28 & NA & NA & NA \tabularnewline
29 & NA & NA & NA \tabularnewline
30 & NA & NA & NA \tabularnewline
31 & NA & NA & NA \tabularnewline
32 & NA & NA & NA \tabularnewline
33 & NA & NA & NA \tabularnewline
34 & NA & NA & NA \tabularnewline
35 & NA & NA & NA \tabularnewline
36 & NA & NA & NA \tabularnewline
\hline
\end{tabular}
%Source: https://freestatistics.org/blog/index.php?pk=36021&T=2

[TABLE]
[ROW][C]Partial Autocorrelation Function[/C][/ROW]
[ROW][C]Time lag k[/C][C]PACF(k)[/C][C]T-STAT[/C][C]P-value[/C][/ROW]
[ROW][C]1[/C][C]0.111161[/C][C]0.5331[/C][C]0.299535[/C][/ROW]
[ROW][C]2[/C][C]-0.326552[/C][C]-1.5661[/C][C]0.065492[/C][/ROW]
[ROW][C]3[/C][C]-0.33493[/C][C]-1.6063[/C][C]0.060929[/C][/ROW]
[ROW][C]4[/C][C]0.144986[/C][C]0.6953[/C][C]0.246908[/C][/ROW]
[ROW][C]5[/C][C]-0.126915[/C][C]-0.6087[/C][C]0.274356[/C][/ROW]
[ROW][C]6[/C][C]-0.202421[/C][C]-0.9708[/C][C]0.17088[/C][/ROW]
[ROW][C]7[/C][C]0.09598[/C][C]0.4603[/C][C]0.32481[/C][/ROW]
[ROW][C]8[/C][C]-0.042226[/C][C]-0.2025[/C][C]0.420649[/C][/ROW]
[ROW][C]9[/C][C]0.04912[/C][C]0.2356[/C][C]0.407926[/C][/ROW]
[ROW][C]10[/C][C]-0.021136[/C][C]-0.1014[/C][C]0.460069[/C][/ROW]
[ROW][C]11[/C][C]-0.12879[/C][C]-0.6177[/C][C]0.271434[/C][/ROW]
[ROW][C]12[/C][C]-0.261112[/C][C]-1.2522[/C][C]0.111532[/C][/ROW]
[ROW][C]13[/C][C]0.070992[/C][C]0.3405[/C][C]0.368298[/C][/ROW]
[ROW][C]14[/C][C]0.000963[/C][C]0.0046[/C][C]0.498177[/C][/ROW]
[ROW][C]15[/C][C]-0.066132[/C][C]-0.3172[/C][C]0.376992[/C][/ROW]
[ROW][C]16[/C][C]0.038989[/C][C]0.187[/C][C]0.426656[/C][/ROW]
[ROW][C]17[/C][C]0.084322[/C][C]0.4044[/C][C]0.344829[/C][/ROW]
[ROW][C]18[/C][C]-0.079264[/C][C]-0.3801[/C][C]0.353666[/C][/ROW]
[ROW][C]19[/C][C]0.022895[/C][C]0.1098[/C][C]0.45676[/C][/ROW]
[ROW][C]20[/C][C]0.013996[/C][C]0.0671[/C][C]0.473532[/C][/ROW]
[ROW][C]21[/C][C]-0.052698[/C][C]-0.2527[/C][C]0.40136[/C][/ROW]
[ROW][C]22[/C][C]-0.128309[/C][C]-0.6154[/C][C]0.272182[/C][/ROW]
[ROW][C]23[/C][C]NA[/C][C]NA[/C][C]NA[/C][/ROW]
[ROW][C]24[/C][C]NA[/C][C]NA[/C][C]NA[/C][/ROW]
[ROW][C]25[/C][C]NA[/C][C]NA[/C][C]NA[/C][/ROW]
[ROW][C]26[/C][C]NA[/C][C]NA[/C][C]NA[/C][/ROW]
[ROW][C]27[/C][C]NA[/C][C]NA[/C][C]NA[/C][/ROW]
[ROW][C]28[/C][C]NA[/C][C]NA[/C][C]NA[/C][/ROW]
[ROW][C]29[/C][C]NA[/C][C]NA[/C][C]NA[/C][/ROW]
[ROW][C]30[/C][C]NA[/C][C]NA[/C][C]NA[/C][/ROW]
[ROW][C]31[/C][C]NA[/C][C]NA[/C][C]NA[/C][/ROW]
[ROW][C]32[/C][C]NA[/C][C]NA[/C][C]NA[/C][/ROW]
[ROW][C]33[/C][C]NA[/C][C]NA[/C][C]NA[/C][/ROW]
[ROW][C]34[/C][C]NA[/C][C]NA[/C][C]NA[/C][/ROW]
[ROW][C]35[/C][C]NA[/C][C]NA[/C][C]NA[/C][/ROW]
[ROW][C]36[/C][C]NA[/C][C]NA[/C][C]NA[/C][/ROW]
[/TABLE]
Source: https://freestatistics.org/blog/index.php?pk=36021&T=2

Globally Unique Identifier (entire table): ba.freestatistics.org/blog/index.php?pk=36021&T=2

As an alternative you can also use a QR Code:  

The GUIDs for individual cells are displayed in the table below:

Partial Autocorrelation Function
Time lag kPACF(k)T-STATP-value
10.1111610.53310.299535
2-0.326552-1.56610.065492
3-0.33493-1.60630.060929
40.1449860.69530.246908
5-0.126915-0.60870.274356
6-0.202421-0.97080.17088
70.095980.46030.32481
8-0.042226-0.20250.420649
90.049120.23560.407926
10-0.021136-0.10140.460069
11-0.12879-0.61770.271434
12-0.261112-1.25220.111532
130.0709920.34050.368298
140.0009630.00460.498177
15-0.066132-0.31720.376992
160.0389890.1870.426656
170.0843220.40440.344829
18-0.079264-0.38010.353666
190.0228950.10980.45676
200.0139960.06710.473532
21-0.052698-0.25270.40136
22-0.128309-0.61540.272182
23NANANA
24NANANA
25NANANA
26NANANA
27NANANA
28NANANA
29NANANA
30NANANA
31NANANA
32NANANA
33NANANA
34NANANA
35NANANA
36NANANA


Parameters (Session):
par1 = 36 ; par2 = 1 ; par3 = 1 ; par4 = 1 ; par5 = 12 ;
Parameters (R input):
par1 = 36 ; par2 = 1 ; par3 = 1 ; par4 = 1 ; par5 = 12 ;
R code (references can be found in the software module):
if (par1 == 'Default') {
par1 = 10*log10(length(x))
} else {
par1 <- as.numeric(par1)
}
par2 <- as.numeric(par2)
par3 <- as.numeric(par3)
par4 <- as.numeric(par4)
par5 <- as.numeric(par5)
if (par2 == 0) {
x <- log(x)
} else {
x <- (x ^ par2 - 1) / par2
}
if (par3 > 0) x <- diff(x,lag=1,difference=par3)
if (par4 > 0) x <- diff(x,lag=par5,difference=par4)
bitmap(file='pic1.png')
racf <- acf(x,par1,main='Autocorrelation',xlab='lags',ylab='ACF')
dev.off()
bitmap(file='pic2.png')
rpacf <- pacf(x,par1,main='Partial Autocorrelation',xlab='lags',ylab='PACF')
dev.off()
(myacf <- c(racf$acf))
(mypacf <- c(rpacf$acf))
lengthx <- length(x)
sqrtn <- sqrt(lengthx)
load(file='createtable')
a<-table.start()
a<-table.row.start(a)
a<-table.element(a,'Autocorrelation Function',4,TRUE)
a<-table.row.end(a)
a<-table.row.start(a)
a<-table.element(a,'Time lag k',header=TRUE)
a<-table.element(a,hyperlink('basics.htm','ACF(k)','click here for more information about the Autocorrelation Function'),header=TRUE)
a<-table.element(a,'T-STAT',header=TRUE)
a<-table.element(a,'P-value',header=TRUE)
a<-table.row.end(a)
for (i in 2:(par1+1)) {
a<-table.row.start(a)
a<-table.element(a,i-1,header=TRUE)
a<-table.element(a,round(myacf[i],6))
mytstat <- myacf[i]*sqrtn
a<-table.element(a,round(mytstat,4))
a<-table.element(a,round(1-pt(abs(mytstat),lengthx),6))
a<-table.row.end(a)
}
a<-table.end(a)
table.save(a,file='mytable.tab')
a<-table.start()
a<-table.row.start(a)
a<-table.element(a,'Partial Autocorrelation Function',4,TRUE)
a<-table.row.end(a)
a<-table.row.start(a)
a<-table.element(a,'Time lag k',header=TRUE)
a<-table.element(a,hyperlink('basics.htm','PACF(k)','click here for more information about the Partial Autocorrelation Function'),header=TRUE)
a<-table.element(a,'T-STAT',header=TRUE)
a<-table.element(a,'P-value',header=TRUE)
a<-table.row.end(a)
for (i in 1:par1) {
a<-table.row.start(a)
a<-table.element(a,i,header=TRUE)
a<-table.element(a,round(mypacf[i],6))
mytstat <- mypacf[i]*sqrtn
a<-table.element(a,round(mytstat,4))
a<-table.element(a,round(1-pt(abs(mytstat),lengthx),6))
a<-table.row.end(a)
}
a<-table.end(a)
table.save(a,file='mytable1.tab')