Free Statistics

of Irreproducible Research!

Author's title

Author*The author of this computation has been verified*
R Software Modulerwasp_autocorrelation.wasp
Title produced by software(Partial) Autocorrelation Function
Date of computationMon, 22 Dec 2008 05:26:09 -0700
Cite this page as followsStatistical Computations at FreeStatistics.org, Office for Research Development and Education, URL https://freestatistics.org/blog/index.php?v=date/2008/Dec/22/t1229948830qd6o2fpmaelya5r.htm/, Retrieved Mon, 13 May 2024 17:25:43 +0000
Statistical Computations at FreeStatistics.org, Office for Research Development and Education, URL https://freestatistics.org/blog/index.php?pk=36020, Retrieved Mon, 13 May 2024 17:25:43 +0000
QR Codes:

Original text written by user:in samenwerking met katrien bourdiaudhy, stéphanie claes en kevin engels
IsPrivate?No (this computation is public)
User-defined keywords
Estimated Impact170
Family? (F = Feedback message, R = changed R code, M = changed R Module, P = changed Parameters, D = changed Data)
F     [Univariate Data Series] [blog 1e tijdreeks...] [2008-10-13 19:23:31] [7173087adebe3e3a714c80ea2417b3eb]
-   PD  [Univariate Data Series] [tijdreeksen opnie...] [2008-10-19 17:18:46] [7173087adebe3e3a714c80ea2417b3eb]
- RMP     [Central Tendency] [tijdreeks 2 centr...] [2008-10-19 17:39:42] [7173087adebe3e3a714c80ea2417b3eb]
- RMP       [(Partial) Autocorrelation Function] [ACF aanvragen hyp...] [2008-12-16 14:51:47] [7d3039e6253bb5fb3b26df1537d500b4]
-   P           [(Partial) Autocorrelation Function] [autocorrelatie op...] [2008-12-22 12:26:09] [95d95b0e883740fcbc85e18ec42dcafb] [Current]
Feedback Forum

Post a new message
Dataseries X:
2400
4700
3700
2900
2800
3000
3100
3700
3000
2000
1900
1900
1800
3400
3800
2800
3100
2100
2000
2500
2400
2500
3300
3100
3700
5600
3700
2900
4000
2900
2400
3300
3800
4400
4000
3100
2700
5200
4600
3700
3200
2400
2200
3200
3100
2300
2500
2900
2700
5000
3500
3000
3800
2800
2400
2700
2800
2700
2600
3100


Summary of computational transaction
Raw Inputview raw input (R code)
Raw Outputview raw output of R engine
Computing time1 seconds
R Server'Gwilym Jenkins' @ 72.249.127.135

\begin{tabular}{lllllllll}
\hline
Summary of computational transaction \tabularnewline
Raw Input & view raw input (R code)  \tabularnewline
Raw Output & view raw output of R engine  \tabularnewline
Computing time & 1 seconds \tabularnewline
R Server & 'Gwilym Jenkins' @ 72.249.127.135 \tabularnewline
\hline
\end{tabular}
%Source: https://freestatistics.org/blog/index.php?pk=36020&T=0

[TABLE]
[ROW][C]Summary of computational transaction[/C][/ROW]
[ROW][C]Raw Input[/C][C]view raw input (R code) [/C][/ROW]
[ROW][C]Raw Output[/C][C]view raw output of R engine [/C][/ROW]
[ROW][C]Computing time[/C][C]1 seconds[/C][/ROW]
[ROW][C]R Server[/C][C]'Gwilym Jenkins' @ 72.249.127.135[/C][/ROW]
[/TABLE]
Source: https://freestatistics.org/blog/index.php?pk=36020&T=0

Globally Unique Identifier (entire table): ba.freestatistics.org/blog/index.php?pk=36020&T=0

As an alternative you can also use a QR Code:  

The GUIDs for individual cells are displayed in the table below:

Summary of computational transaction
Raw Inputview raw input (R code)
Raw Outputview raw output of R engine
Computing time1 seconds
R Server'Gwilym Jenkins' @ 72.249.127.135


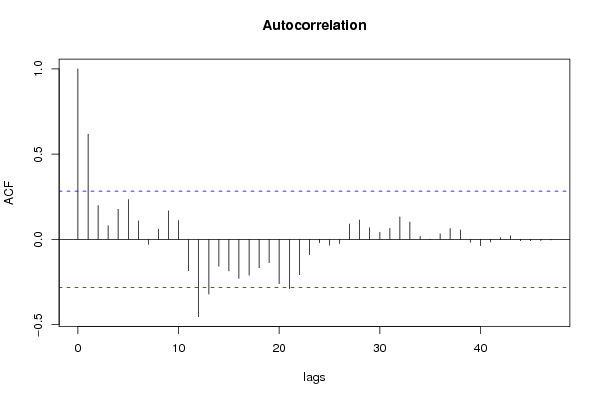
Autocorrelation Function
Time lag kACF(k)T-STATP-value
10.6174934.27814.5e-05
20.1985771.37580.087638
30.0808090.55990.289089
40.1765481.22320.11362
50.2341671.62240.055639
60.1091340.75610.226642
7-0.028175-0.19520.423029
80.0603410.41810.338886
90.1679181.16340.125216
100.1116320.77340.221537
11-0.182775-1.26630.105758
12-0.45263-3.13590.001462
13-0.320127-2.21790.015664
14-0.156851-1.08670.141299
15-0.184744-1.27990.103358
16-0.228754-1.58490.059783
17-0.209424-1.45090.076651
18-0.165251-1.14490.128966
19-0.135837-0.94110.175682
20-0.259638-1.79880.039168
21-0.288199-1.99670.025773
22-0.206656-1.43180.079347
23-0.090144-0.62450.267616
24-0.019582-0.13570.446324
25-0.033697-0.23350.408199
26-0.023907-0.16560.43457
270.0902040.62490.267482
280.1137510.78810.21726
290.0686130.47540.318341
300.0429120.29730.383758
310.065040.45060.32715
320.1319690.91430.182562
330.1022390.70830.241082
340.0179780.12460.450697
350.0018810.0130.494829
360.0334240.23160.408929
370.0641950.44480.329249
380.0561340.38890.349531
39-0.016936-0.11730.453541
40-0.036124-0.25030.401722
41-0.014247-0.09870.460892
420.0105320.0730.471066
430.0215330.14920.441017
44-0.007029-0.04870.480682
45-0.00749-0.05190.479416
46-0.00626-0.04340.482794
47-0.002545-0.01760.493002
48NANANA
49NANANA
50NANANA
51NANANA
52NANANA
53NANANA
54NANANA
55NANANA
56NANANA
57NANANA
58NANANA
59NANANA
60NANANA

\begin{tabular}{lllllllll}
\hline
Autocorrelation Function \tabularnewline
Time lag k & ACF(k) & T-STAT & P-value \tabularnewline
1 & 0.617493 & 4.2781 & 4.5e-05 \tabularnewline
2 & 0.198577 & 1.3758 & 0.087638 \tabularnewline
3 & 0.080809 & 0.5599 & 0.289089 \tabularnewline
4 & 0.176548 & 1.2232 & 0.11362 \tabularnewline
5 & 0.234167 & 1.6224 & 0.055639 \tabularnewline
6 & 0.109134 & 0.7561 & 0.226642 \tabularnewline
7 & -0.028175 & -0.1952 & 0.423029 \tabularnewline
8 & 0.060341 & 0.4181 & 0.338886 \tabularnewline
9 & 0.167918 & 1.1634 & 0.125216 \tabularnewline
10 & 0.111632 & 0.7734 & 0.221537 \tabularnewline
11 & -0.182775 & -1.2663 & 0.105758 \tabularnewline
12 & -0.45263 & -3.1359 & 0.001462 \tabularnewline
13 & -0.320127 & -2.2179 & 0.015664 \tabularnewline
14 & -0.156851 & -1.0867 & 0.141299 \tabularnewline
15 & -0.184744 & -1.2799 & 0.103358 \tabularnewline
16 & -0.228754 & -1.5849 & 0.059783 \tabularnewline
17 & -0.209424 & -1.4509 & 0.076651 \tabularnewline
18 & -0.165251 & -1.1449 & 0.128966 \tabularnewline
19 & -0.135837 & -0.9411 & 0.175682 \tabularnewline
20 & -0.259638 & -1.7988 & 0.039168 \tabularnewline
21 & -0.288199 & -1.9967 & 0.025773 \tabularnewline
22 & -0.206656 & -1.4318 & 0.079347 \tabularnewline
23 & -0.090144 & -0.6245 & 0.267616 \tabularnewline
24 & -0.019582 & -0.1357 & 0.446324 \tabularnewline
25 & -0.033697 & -0.2335 & 0.408199 \tabularnewline
26 & -0.023907 & -0.1656 & 0.43457 \tabularnewline
27 & 0.090204 & 0.6249 & 0.267482 \tabularnewline
28 & 0.113751 & 0.7881 & 0.21726 \tabularnewline
29 & 0.068613 & 0.4754 & 0.318341 \tabularnewline
30 & 0.042912 & 0.2973 & 0.383758 \tabularnewline
31 & 0.06504 & 0.4506 & 0.32715 \tabularnewline
32 & 0.131969 & 0.9143 & 0.182562 \tabularnewline
33 & 0.102239 & 0.7083 & 0.241082 \tabularnewline
34 & 0.017978 & 0.1246 & 0.450697 \tabularnewline
35 & 0.001881 & 0.013 & 0.494829 \tabularnewline
36 & 0.033424 & 0.2316 & 0.408929 \tabularnewline
37 & 0.064195 & 0.4448 & 0.329249 \tabularnewline
38 & 0.056134 & 0.3889 & 0.349531 \tabularnewline
39 & -0.016936 & -0.1173 & 0.453541 \tabularnewline
40 & -0.036124 & -0.2503 & 0.401722 \tabularnewline
41 & -0.014247 & -0.0987 & 0.460892 \tabularnewline
42 & 0.010532 & 0.073 & 0.471066 \tabularnewline
43 & 0.021533 & 0.1492 & 0.441017 \tabularnewline
44 & -0.007029 & -0.0487 & 0.480682 \tabularnewline
45 & -0.00749 & -0.0519 & 0.479416 \tabularnewline
46 & -0.00626 & -0.0434 & 0.482794 \tabularnewline
47 & -0.002545 & -0.0176 & 0.493002 \tabularnewline
48 & NA & NA & NA \tabularnewline
49 & NA & NA & NA \tabularnewline
50 & NA & NA & NA \tabularnewline
51 & NA & NA & NA \tabularnewline
52 & NA & NA & NA \tabularnewline
53 & NA & NA & NA \tabularnewline
54 & NA & NA & NA \tabularnewline
55 & NA & NA & NA \tabularnewline
56 & NA & NA & NA \tabularnewline
57 & NA & NA & NA \tabularnewline
58 & NA & NA & NA \tabularnewline
59 & NA & NA & NA \tabularnewline
60 & NA & NA & NA \tabularnewline
\hline
\end{tabular}
%Source: https://freestatistics.org/blog/index.php?pk=36020&T=1

[TABLE]
[ROW][C]Autocorrelation Function[/C][/ROW]
[ROW][C]Time lag k[/C][C]ACF(k)[/C][C]T-STAT[/C][C]P-value[/C][/ROW]
[ROW][C]1[/C][C]0.617493[/C][C]4.2781[/C][C]4.5e-05[/C][/ROW]
[ROW][C]2[/C][C]0.198577[/C][C]1.3758[/C][C]0.087638[/C][/ROW]
[ROW][C]3[/C][C]0.080809[/C][C]0.5599[/C][C]0.289089[/C][/ROW]
[ROW][C]4[/C][C]0.176548[/C][C]1.2232[/C][C]0.11362[/C][/ROW]
[ROW][C]5[/C][C]0.234167[/C][C]1.6224[/C][C]0.055639[/C][/ROW]
[ROW][C]6[/C][C]0.109134[/C][C]0.7561[/C][C]0.226642[/C][/ROW]
[ROW][C]7[/C][C]-0.028175[/C][C]-0.1952[/C][C]0.423029[/C][/ROW]
[ROW][C]8[/C][C]0.060341[/C][C]0.4181[/C][C]0.338886[/C][/ROW]
[ROW][C]9[/C][C]0.167918[/C][C]1.1634[/C][C]0.125216[/C][/ROW]
[ROW][C]10[/C][C]0.111632[/C][C]0.7734[/C][C]0.221537[/C][/ROW]
[ROW][C]11[/C][C]-0.182775[/C][C]-1.2663[/C][C]0.105758[/C][/ROW]
[ROW][C]12[/C][C]-0.45263[/C][C]-3.1359[/C][C]0.001462[/C][/ROW]
[ROW][C]13[/C][C]-0.320127[/C][C]-2.2179[/C][C]0.015664[/C][/ROW]
[ROW][C]14[/C][C]-0.156851[/C][C]-1.0867[/C][C]0.141299[/C][/ROW]
[ROW][C]15[/C][C]-0.184744[/C][C]-1.2799[/C][C]0.103358[/C][/ROW]
[ROW][C]16[/C][C]-0.228754[/C][C]-1.5849[/C][C]0.059783[/C][/ROW]
[ROW][C]17[/C][C]-0.209424[/C][C]-1.4509[/C][C]0.076651[/C][/ROW]
[ROW][C]18[/C][C]-0.165251[/C][C]-1.1449[/C][C]0.128966[/C][/ROW]
[ROW][C]19[/C][C]-0.135837[/C][C]-0.9411[/C][C]0.175682[/C][/ROW]
[ROW][C]20[/C][C]-0.259638[/C][C]-1.7988[/C][C]0.039168[/C][/ROW]
[ROW][C]21[/C][C]-0.288199[/C][C]-1.9967[/C][C]0.025773[/C][/ROW]
[ROW][C]22[/C][C]-0.206656[/C][C]-1.4318[/C][C]0.079347[/C][/ROW]
[ROW][C]23[/C][C]-0.090144[/C][C]-0.6245[/C][C]0.267616[/C][/ROW]
[ROW][C]24[/C][C]-0.019582[/C][C]-0.1357[/C][C]0.446324[/C][/ROW]
[ROW][C]25[/C][C]-0.033697[/C][C]-0.2335[/C][C]0.408199[/C][/ROW]
[ROW][C]26[/C][C]-0.023907[/C][C]-0.1656[/C][C]0.43457[/C][/ROW]
[ROW][C]27[/C][C]0.090204[/C][C]0.6249[/C][C]0.267482[/C][/ROW]
[ROW][C]28[/C][C]0.113751[/C][C]0.7881[/C][C]0.21726[/C][/ROW]
[ROW][C]29[/C][C]0.068613[/C][C]0.4754[/C][C]0.318341[/C][/ROW]
[ROW][C]30[/C][C]0.042912[/C][C]0.2973[/C][C]0.383758[/C][/ROW]
[ROW][C]31[/C][C]0.06504[/C][C]0.4506[/C][C]0.32715[/C][/ROW]
[ROW][C]32[/C][C]0.131969[/C][C]0.9143[/C][C]0.182562[/C][/ROW]
[ROW][C]33[/C][C]0.102239[/C][C]0.7083[/C][C]0.241082[/C][/ROW]
[ROW][C]34[/C][C]0.017978[/C][C]0.1246[/C][C]0.450697[/C][/ROW]
[ROW][C]35[/C][C]0.001881[/C][C]0.013[/C][C]0.494829[/C][/ROW]
[ROW][C]36[/C][C]0.033424[/C][C]0.2316[/C][C]0.408929[/C][/ROW]
[ROW][C]37[/C][C]0.064195[/C][C]0.4448[/C][C]0.329249[/C][/ROW]
[ROW][C]38[/C][C]0.056134[/C][C]0.3889[/C][C]0.349531[/C][/ROW]
[ROW][C]39[/C][C]-0.016936[/C][C]-0.1173[/C][C]0.453541[/C][/ROW]
[ROW][C]40[/C][C]-0.036124[/C][C]-0.2503[/C][C]0.401722[/C][/ROW]
[ROW][C]41[/C][C]-0.014247[/C][C]-0.0987[/C][C]0.460892[/C][/ROW]
[ROW][C]42[/C][C]0.010532[/C][C]0.073[/C][C]0.471066[/C][/ROW]
[ROW][C]43[/C][C]0.021533[/C][C]0.1492[/C][C]0.441017[/C][/ROW]
[ROW][C]44[/C][C]-0.007029[/C][C]-0.0487[/C][C]0.480682[/C][/ROW]
[ROW][C]45[/C][C]-0.00749[/C][C]-0.0519[/C][C]0.479416[/C][/ROW]
[ROW][C]46[/C][C]-0.00626[/C][C]-0.0434[/C][C]0.482794[/C][/ROW]
[ROW][C]47[/C][C]-0.002545[/C][C]-0.0176[/C][C]0.493002[/C][/ROW]
[ROW][C]48[/C][C]NA[/C][C]NA[/C][C]NA[/C][/ROW]
[ROW][C]49[/C][C]NA[/C][C]NA[/C][C]NA[/C][/ROW]
[ROW][C]50[/C][C]NA[/C][C]NA[/C][C]NA[/C][/ROW]
[ROW][C]51[/C][C]NA[/C][C]NA[/C][C]NA[/C][/ROW]
[ROW][C]52[/C][C]NA[/C][C]NA[/C][C]NA[/C][/ROW]
[ROW][C]53[/C][C]NA[/C][C]NA[/C][C]NA[/C][/ROW]
[ROW][C]54[/C][C]NA[/C][C]NA[/C][C]NA[/C][/ROW]
[ROW][C]55[/C][C]NA[/C][C]NA[/C][C]NA[/C][/ROW]
[ROW][C]56[/C][C]NA[/C][C]NA[/C][C]NA[/C][/ROW]
[ROW][C]57[/C][C]NA[/C][C]NA[/C][C]NA[/C][/ROW]
[ROW][C]58[/C][C]NA[/C][C]NA[/C][C]NA[/C][/ROW]
[ROW][C]59[/C][C]NA[/C][C]NA[/C][C]NA[/C][/ROW]
[ROW][C]60[/C][C]NA[/C][C]NA[/C][C]NA[/C][/ROW]
[/TABLE]
Source: https://freestatistics.org/blog/index.php?pk=36020&T=1

Globally Unique Identifier (entire table): ba.freestatistics.org/blog/index.php?pk=36020&T=1

As an alternative you can also use a QR Code:  

The GUIDs for individual cells are displayed in the table below:

Autocorrelation Function
Time lag kACF(k)T-STATP-value
10.6174934.27814.5e-05
20.1985771.37580.087638
30.0808090.55990.289089
40.1765481.22320.11362
50.2341671.62240.055639
60.1091340.75610.226642
7-0.028175-0.19520.423029
80.0603410.41810.338886
90.1679181.16340.125216
100.1116320.77340.221537
11-0.182775-1.26630.105758
12-0.45263-3.13590.001462
13-0.320127-2.21790.015664
14-0.156851-1.08670.141299
15-0.184744-1.27990.103358
16-0.228754-1.58490.059783
17-0.209424-1.45090.076651
18-0.165251-1.14490.128966
19-0.135837-0.94110.175682
20-0.259638-1.79880.039168
21-0.288199-1.99670.025773
22-0.206656-1.43180.079347
23-0.090144-0.62450.267616
24-0.019582-0.13570.446324
25-0.033697-0.23350.408199
26-0.023907-0.16560.43457
270.0902040.62490.267482
280.1137510.78810.21726
290.0686130.47540.318341
300.0429120.29730.383758
310.065040.45060.32715
320.1319690.91430.182562
330.1022390.70830.241082
340.0179780.12460.450697
350.0018810.0130.494829
360.0334240.23160.408929
370.0641950.44480.329249
380.0561340.38890.349531
39-0.016936-0.11730.453541
40-0.036124-0.25030.401722
41-0.014247-0.09870.460892
420.0105320.0730.471066
430.0215330.14920.441017
44-0.007029-0.04870.480682
45-0.00749-0.05190.479416
46-0.00626-0.04340.482794
47-0.002545-0.01760.493002
48NANANA
49NANANA
50NANANA
51NANANA
52NANANA
53NANANA
54NANANA
55NANANA
56NANANA
57NANANA
58NANANA
59NANANA
60NANANA


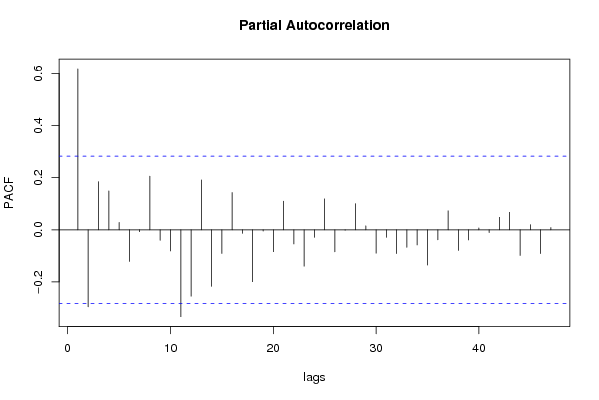
Partial Autocorrelation Function
Time lag kPACF(k)T-STATP-value
10.6174934.27814.5e-05
2-0.295329-2.04610.023123
30.1847571.280.103343
40.1492471.0340.153156
50.0283630.19650.422522
6-0.121297-0.84040.202433
7-0.00703-0.04870.480678
80.2059131.42660.080083
9-0.039982-0.2770.391483
10-0.080845-0.56010.289003
11-0.333141-2.30810.012674
12-0.25445-1.76290.042143
130.1913451.32570.09561
14-0.216888-1.50260.069741
15-0.090352-0.6260.267148
160.1432340.99240.163001
17-0.013242-0.09170.463642
18-0.199013-1.37880.087174
19-0.004476-0.0310.487694
20-0.083899-0.58130.28189
210.1097920.76070.22529
22-0.054175-0.37530.354533
23-0.139649-0.96750.169068
24-0.028739-0.19910.42151
250.1188810.82360.20711
26-0.084272-0.58390.281025
27-0.001098-0.00760.496981
280.1003820.69550.245058
290.0152450.10560.458161
30-0.089445-0.61970.269195
31-0.028458-0.19720.422267
32-0.09115-0.63150.265354
33-0.066851-0.46320.322672
34-0.057781-0.40030.345349
35-0.134955-0.9350.177236
36-0.038155-0.26430.396324
370.07290.50510.307913
38-0.078986-0.54720.293379
39-0.038531-0.2670.395325
400.0074480.05160.479531
41-0.010583-0.07330.470927
420.0483290.33480.369606
430.067380.46680.321369
44-0.098177-0.68020.249825
450.0198380.13740.445628
46-0.090936-0.630.265833
470.0087390.06050.475986
48NANANA
49NANANA
50NANANA
51NANANA
52NANANA
53NANANA
54NANANA
55NANANA
56NANANA
57NANANA
58NANANA
59NANANA
60NANANA

\begin{tabular}{lllllllll}
\hline
Partial Autocorrelation Function \tabularnewline
Time lag k & PACF(k) & T-STAT & P-value \tabularnewline
1 & 0.617493 & 4.2781 & 4.5e-05 \tabularnewline
2 & -0.295329 & -2.0461 & 0.023123 \tabularnewline
3 & 0.184757 & 1.28 & 0.103343 \tabularnewline
4 & 0.149247 & 1.034 & 0.153156 \tabularnewline
5 & 0.028363 & 0.1965 & 0.422522 \tabularnewline
6 & -0.121297 & -0.8404 & 0.202433 \tabularnewline
7 & -0.00703 & -0.0487 & 0.480678 \tabularnewline
8 & 0.205913 & 1.4266 & 0.080083 \tabularnewline
9 & -0.039982 & -0.277 & 0.391483 \tabularnewline
10 & -0.080845 & -0.5601 & 0.289003 \tabularnewline
11 & -0.333141 & -2.3081 & 0.012674 \tabularnewline
12 & -0.25445 & -1.7629 & 0.042143 \tabularnewline
13 & 0.191345 & 1.3257 & 0.09561 \tabularnewline
14 & -0.216888 & -1.5026 & 0.069741 \tabularnewline
15 & -0.090352 & -0.626 & 0.267148 \tabularnewline
16 & 0.143234 & 0.9924 & 0.163001 \tabularnewline
17 & -0.013242 & -0.0917 & 0.463642 \tabularnewline
18 & -0.199013 & -1.3788 & 0.087174 \tabularnewline
19 & -0.004476 & -0.031 & 0.487694 \tabularnewline
20 & -0.083899 & -0.5813 & 0.28189 \tabularnewline
21 & 0.109792 & 0.7607 & 0.22529 \tabularnewline
22 & -0.054175 & -0.3753 & 0.354533 \tabularnewline
23 & -0.139649 & -0.9675 & 0.169068 \tabularnewline
24 & -0.028739 & -0.1991 & 0.42151 \tabularnewline
25 & 0.118881 & 0.8236 & 0.20711 \tabularnewline
26 & -0.084272 & -0.5839 & 0.281025 \tabularnewline
27 & -0.001098 & -0.0076 & 0.496981 \tabularnewline
28 & 0.100382 & 0.6955 & 0.245058 \tabularnewline
29 & 0.015245 & 0.1056 & 0.458161 \tabularnewline
30 & -0.089445 & -0.6197 & 0.269195 \tabularnewline
31 & -0.028458 & -0.1972 & 0.422267 \tabularnewline
32 & -0.09115 & -0.6315 & 0.265354 \tabularnewline
33 & -0.066851 & -0.4632 & 0.322672 \tabularnewline
34 & -0.057781 & -0.4003 & 0.345349 \tabularnewline
35 & -0.134955 & -0.935 & 0.177236 \tabularnewline
36 & -0.038155 & -0.2643 & 0.396324 \tabularnewline
37 & 0.0729 & 0.5051 & 0.307913 \tabularnewline
38 & -0.078986 & -0.5472 & 0.293379 \tabularnewline
39 & -0.038531 & -0.267 & 0.395325 \tabularnewline
40 & 0.007448 & 0.0516 & 0.479531 \tabularnewline
41 & -0.010583 & -0.0733 & 0.470927 \tabularnewline
42 & 0.048329 & 0.3348 & 0.369606 \tabularnewline
43 & 0.06738 & 0.4668 & 0.321369 \tabularnewline
44 & -0.098177 & -0.6802 & 0.249825 \tabularnewline
45 & 0.019838 & 0.1374 & 0.445628 \tabularnewline
46 & -0.090936 & -0.63 & 0.265833 \tabularnewline
47 & 0.008739 & 0.0605 & 0.475986 \tabularnewline
48 & NA & NA & NA \tabularnewline
49 & NA & NA & NA \tabularnewline
50 & NA & NA & NA \tabularnewline
51 & NA & NA & NA \tabularnewline
52 & NA & NA & NA \tabularnewline
53 & NA & NA & NA \tabularnewline
54 & NA & NA & NA \tabularnewline
55 & NA & NA & NA \tabularnewline
56 & NA & NA & NA \tabularnewline
57 & NA & NA & NA \tabularnewline
58 & NA & NA & NA \tabularnewline
59 & NA & NA & NA \tabularnewline
60 & NA & NA & NA \tabularnewline
\hline
\end{tabular}
%Source: https://freestatistics.org/blog/index.php?pk=36020&T=2

[TABLE]
[ROW][C]Partial Autocorrelation Function[/C][/ROW]
[ROW][C]Time lag k[/C][C]PACF(k)[/C][C]T-STAT[/C][C]P-value[/C][/ROW]
[ROW][C]1[/C][C]0.617493[/C][C]4.2781[/C][C]4.5e-05[/C][/ROW]
[ROW][C]2[/C][C]-0.295329[/C][C]-2.0461[/C][C]0.023123[/C][/ROW]
[ROW][C]3[/C][C]0.184757[/C][C]1.28[/C][C]0.103343[/C][/ROW]
[ROW][C]4[/C][C]0.149247[/C][C]1.034[/C][C]0.153156[/C][/ROW]
[ROW][C]5[/C][C]0.028363[/C][C]0.1965[/C][C]0.422522[/C][/ROW]
[ROW][C]6[/C][C]-0.121297[/C][C]-0.8404[/C][C]0.202433[/C][/ROW]
[ROW][C]7[/C][C]-0.00703[/C][C]-0.0487[/C][C]0.480678[/C][/ROW]
[ROW][C]8[/C][C]0.205913[/C][C]1.4266[/C][C]0.080083[/C][/ROW]
[ROW][C]9[/C][C]-0.039982[/C][C]-0.277[/C][C]0.391483[/C][/ROW]
[ROW][C]10[/C][C]-0.080845[/C][C]-0.5601[/C][C]0.289003[/C][/ROW]
[ROW][C]11[/C][C]-0.333141[/C][C]-2.3081[/C][C]0.012674[/C][/ROW]
[ROW][C]12[/C][C]-0.25445[/C][C]-1.7629[/C][C]0.042143[/C][/ROW]
[ROW][C]13[/C][C]0.191345[/C][C]1.3257[/C][C]0.09561[/C][/ROW]
[ROW][C]14[/C][C]-0.216888[/C][C]-1.5026[/C][C]0.069741[/C][/ROW]
[ROW][C]15[/C][C]-0.090352[/C][C]-0.626[/C][C]0.267148[/C][/ROW]
[ROW][C]16[/C][C]0.143234[/C][C]0.9924[/C][C]0.163001[/C][/ROW]
[ROW][C]17[/C][C]-0.013242[/C][C]-0.0917[/C][C]0.463642[/C][/ROW]
[ROW][C]18[/C][C]-0.199013[/C][C]-1.3788[/C][C]0.087174[/C][/ROW]
[ROW][C]19[/C][C]-0.004476[/C][C]-0.031[/C][C]0.487694[/C][/ROW]
[ROW][C]20[/C][C]-0.083899[/C][C]-0.5813[/C][C]0.28189[/C][/ROW]
[ROW][C]21[/C][C]0.109792[/C][C]0.7607[/C][C]0.22529[/C][/ROW]
[ROW][C]22[/C][C]-0.054175[/C][C]-0.3753[/C][C]0.354533[/C][/ROW]
[ROW][C]23[/C][C]-0.139649[/C][C]-0.9675[/C][C]0.169068[/C][/ROW]
[ROW][C]24[/C][C]-0.028739[/C][C]-0.1991[/C][C]0.42151[/C][/ROW]
[ROW][C]25[/C][C]0.118881[/C][C]0.8236[/C][C]0.20711[/C][/ROW]
[ROW][C]26[/C][C]-0.084272[/C][C]-0.5839[/C][C]0.281025[/C][/ROW]
[ROW][C]27[/C][C]-0.001098[/C][C]-0.0076[/C][C]0.496981[/C][/ROW]
[ROW][C]28[/C][C]0.100382[/C][C]0.6955[/C][C]0.245058[/C][/ROW]
[ROW][C]29[/C][C]0.015245[/C][C]0.1056[/C][C]0.458161[/C][/ROW]
[ROW][C]30[/C][C]-0.089445[/C][C]-0.6197[/C][C]0.269195[/C][/ROW]
[ROW][C]31[/C][C]-0.028458[/C][C]-0.1972[/C][C]0.422267[/C][/ROW]
[ROW][C]32[/C][C]-0.09115[/C][C]-0.6315[/C][C]0.265354[/C][/ROW]
[ROW][C]33[/C][C]-0.066851[/C][C]-0.4632[/C][C]0.322672[/C][/ROW]
[ROW][C]34[/C][C]-0.057781[/C][C]-0.4003[/C][C]0.345349[/C][/ROW]
[ROW][C]35[/C][C]-0.134955[/C][C]-0.935[/C][C]0.177236[/C][/ROW]
[ROW][C]36[/C][C]-0.038155[/C][C]-0.2643[/C][C]0.396324[/C][/ROW]
[ROW][C]37[/C][C]0.0729[/C][C]0.5051[/C][C]0.307913[/C][/ROW]
[ROW][C]38[/C][C]-0.078986[/C][C]-0.5472[/C][C]0.293379[/C][/ROW]
[ROW][C]39[/C][C]-0.038531[/C][C]-0.267[/C][C]0.395325[/C][/ROW]
[ROW][C]40[/C][C]0.007448[/C][C]0.0516[/C][C]0.479531[/C][/ROW]
[ROW][C]41[/C][C]-0.010583[/C][C]-0.0733[/C][C]0.470927[/C][/ROW]
[ROW][C]42[/C][C]0.048329[/C][C]0.3348[/C][C]0.369606[/C][/ROW]
[ROW][C]43[/C][C]0.06738[/C][C]0.4668[/C][C]0.321369[/C][/ROW]
[ROW][C]44[/C][C]-0.098177[/C][C]-0.6802[/C][C]0.249825[/C][/ROW]
[ROW][C]45[/C][C]0.019838[/C][C]0.1374[/C][C]0.445628[/C][/ROW]
[ROW][C]46[/C][C]-0.090936[/C][C]-0.63[/C][C]0.265833[/C][/ROW]
[ROW][C]47[/C][C]0.008739[/C][C]0.0605[/C][C]0.475986[/C][/ROW]
[ROW][C]48[/C][C]NA[/C][C]NA[/C][C]NA[/C][/ROW]
[ROW][C]49[/C][C]NA[/C][C]NA[/C][C]NA[/C][/ROW]
[ROW][C]50[/C][C]NA[/C][C]NA[/C][C]NA[/C][/ROW]
[ROW][C]51[/C][C]NA[/C][C]NA[/C][C]NA[/C][/ROW]
[ROW][C]52[/C][C]NA[/C][C]NA[/C][C]NA[/C][/ROW]
[ROW][C]53[/C][C]NA[/C][C]NA[/C][C]NA[/C][/ROW]
[ROW][C]54[/C][C]NA[/C][C]NA[/C][C]NA[/C][/ROW]
[ROW][C]55[/C][C]NA[/C][C]NA[/C][C]NA[/C][/ROW]
[ROW][C]56[/C][C]NA[/C][C]NA[/C][C]NA[/C][/ROW]
[ROW][C]57[/C][C]NA[/C][C]NA[/C][C]NA[/C][/ROW]
[ROW][C]58[/C][C]NA[/C][C]NA[/C][C]NA[/C][/ROW]
[ROW][C]59[/C][C]NA[/C][C]NA[/C][C]NA[/C][/ROW]
[ROW][C]60[/C][C]NA[/C][C]NA[/C][C]NA[/C][/ROW]
[/TABLE]
Source: https://freestatistics.org/blog/index.php?pk=36020&T=2

Globally Unique Identifier (entire table): ba.freestatistics.org/blog/index.php?pk=36020&T=2

As an alternative you can also use a QR Code:  

The GUIDs for individual cells are displayed in the table below:

Partial Autocorrelation Function
Time lag kPACF(k)T-STATP-value
10.6174934.27814.5e-05
2-0.295329-2.04610.023123
30.1847571.280.103343
40.1492471.0340.153156
50.0283630.19650.422522
6-0.121297-0.84040.202433
7-0.00703-0.04870.480678
80.2059131.42660.080083
9-0.039982-0.2770.391483
10-0.080845-0.56010.289003
11-0.333141-2.30810.012674
12-0.25445-1.76290.042143
130.1913451.32570.09561
14-0.216888-1.50260.069741
15-0.090352-0.6260.267148
160.1432340.99240.163001
17-0.013242-0.09170.463642
18-0.199013-1.37880.087174
19-0.004476-0.0310.487694
20-0.083899-0.58130.28189
210.1097920.76070.22529
22-0.054175-0.37530.354533
23-0.139649-0.96750.169068
24-0.028739-0.19910.42151
250.1188810.82360.20711
26-0.084272-0.58390.281025
27-0.001098-0.00760.496981
280.1003820.69550.245058
290.0152450.10560.458161
30-0.089445-0.61970.269195
31-0.028458-0.19720.422267
32-0.09115-0.63150.265354
33-0.066851-0.46320.322672
34-0.057781-0.40030.345349
35-0.134955-0.9350.177236
36-0.038155-0.26430.396324
370.07290.50510.307913
38-0.078986-0.54720.293379
39-0.038531-0.2670.395325
400.0074480.05160.479531
41-0.010583-0.07330.470927
420.0483290.33480.369606
430.067380.46680.321369
44-0.098177-0.68020.249825
450.0198380.13740.445628
46-0.090936-0.630.265833
470.0087390.06050.475986
48NANANA
49NANANA
50NANANA
51NANANA
52NANANA
53NANANA
54NANANA
55NANANA
56NANANA
57NANANA
58NANANA
59NANANA
60NANANA


Parameters (Session):
par1 = 60 ; par2 = 1 ; par3 = 0 ; par4 = 1 ; par5 = 12 ;
Parameters (R input):
par1 = 60 ; par2 = 1 ; par3 = 0 ; par4 = 1 ; par5 = 12 ;
R code (references can be found in the software module):
if (par1 == 'Default') {
par1 = 10*log10(length(x))
} else {
par1 <- as.numeric(par1)
}
par2 <- as.numeric(par2)
par3 <- as.numeric(par3)
par4 <- as.numeric(par4)
par5 <- as.numeric(par5)
if (par2 == 0) {
x <- log(x)
} else {
x <- (x ^ par2 - 1) / par2
}
if (par3 > 0) x <- diff(x,lag=1,difference=par3)
if (par4 > 0) x <- diff(x,lag=par5,difference=par4)
bitmap(file='pic1.png')
racf <- acf(x,par1,main='Autocorrelation',xlab='lags',ylab='ACF')
dev.off()
bitmap(file='pic2.png')
rpacf <- pacf(x,par1,main='Partial Autocorrelation',xlab='lags',ylab='PACF')
dev.off()
(myacf <- c(racf$acf))
(mypacf <- c(rpacf$acf))
lengthx <- length(x)
sqrtn <- sqrt(lengthx)
load(file='createtable')
a<-table.start()
a<-table.row.start(a)
a<-table.element(a,'Autocorrelation Function',4,TRUE)
a<-table.row.end(a)
a<-table.row.start(a)
a<-table.element(a,'Time lag k',header=TRUE)
a<-table.element(a,hyperlink('basics.htm','ACF(k)','click here for more information about the Autocorrelation Function'),header=TRUE)
a<-table.element(a,'T-STAT',header=TRUE)
a<-table.element(a,'P-value',header=TRUE)
a<-table.row.end(a)
for (i in 2:(par1+1)) {
a<-table.row.start(a)
a<-table.element(a,i-1,header=TRUE)
a<-table.element(a,round(myacf[i],6))
mytstat <- myacf[i]*sqrtn
a<-table.element(a,round(mytstat,4))
a<-table.element(a,round(1-pt(abs(mytstat),lengthx),6))
a<-table.row.end(a)
}
a<-table.end(a)
table.save(a,file='mytable.tab')
a<-table.start()
a<-table.row.start(a)
a<-table.element(a,'Partial Autocorrelation Function',4,TRUE)
a<-table.row.end(a)
a<-table.row.start(a)
a<-table.element(a,'Time lag k',header=TRUE)
a<-table.element(a,hyperlink('basics.htm','PACF(k)','click here for more information about the Partial Autocorrelation Function'),header=TRUE)
a<-table.element(a,'T-STAT',header=TRUE)
a<-table.element(a,'P-value',header=TRUE)
a<-table.row.end(a)
for (i in 1:par1) {
a<-table.row.start(a)
a<-table.element(a,i,header=TRUE)
a<-table.element(a,round(mypacf[i],6))
mytstat <- mypacf[i]*sqrtn
a<-table.element(a,round(mytstat,4))
a<-table.element(a,round(1-pt(abs(mytstat),lengthx),6))
a<-table.row.end(a)
}
a<-table.end(a)
table.save(a,file='mytable1.tab')