Free Statistics

of Irreproducible Research!

Author's title

Author*The author of this computation has been verified*
R Software Modulerwasp_smp.wasp
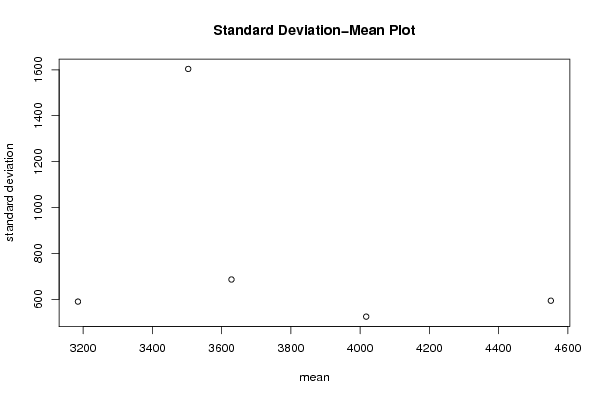
Title produced by softwareStandard Deviation-Mean Plot
Date of computationMon, 22 Dec 2008 01:11:01 -0700
Cite this page as followsStatistical Computations at FreeStatistics.org, Office for Research Development and Education, URL https://freestatistics.org/blog/index.php?v=date/2008/Dec/22/t1229941959xbviaxvsa0pmtlu.htm/, Retrieved Mon, 13 May 2024 19:02:14 +0000
Statistical Computations at FreeStatistics.org, Office for Research Development and Education, URL https://freestatistics.org/blog/index.php?pk=35986, Retrieved Mon, 13 May 2024 19:02:14 +0000
QR Codes:

Original text written by user:
IsPrivate?No (this computation is public)
User-defined keywords
Estimated Impact183
Family? (F = Feedback message, R = changed R code, M = changed R Module, P = changed Parameters, D = changed Data)
F     [Univariate Data Series] [blog 1e tijdreeks...] [2008-10-13 19:23:31] [7173087adebe3e3a714c80ea2417b3eb]
-   PD  [Univariate Data Series] [tijdreeksen opnie...] [2008-10-19 17:13:12] [7173087adebe3e3a714c80ea2417b3eb]
-   PD    [Univariate Data Series] [tijdreeksen opnie...] [2008-10-19 18:55:20] [7173087adebe3e3a714c80ea2417b3eb]
- RM        [Central Tendency] [central tendency ...] [2008-10-19 19:10:37] [7173087adebe3e3a714c80ea2417b3eb]
- RMP         [Standard Deviation-Mean Plot] [own data step 1 SMP] [2008-12-08 20:37:29] [7173087adebe3e3a714c80ea2417b3eb]
-    D            [Standard Deviation-Mean Plot] [] [2008-12-22 08:11:01] [0e4dd4b7713a9edf1ca3fab1bbbafcc9] [Current]
Feedback Forum

Post a new message
Dataseries X:
3999
4864
5134
5410
4669
3546
5040
4850
4808
4441
4227
3620
3153
3936
4159
4209
4282
3174
4686
4131
4486
4625
3971
3397
3228
3441
3832
5267
3580
2617
3874
3431
4023
4151
3180
2916
2640
2700
3603
4348
3322
2312
3472
3592
3481
3451
2725
2574
2429
3160
3371
3448
3229
1986
2955
3000
8255
4191
3520
2497


Summary of computational transaction
Raw Inputview raw input (R code)
Raw Outputview raw output of R engine
Computing time1 seconds
R Server'Gwilym Jenkins' @ 72.249.127.135

\begin{tabular}{lllllllll}
\hline
Summary of computational transaction \tabularnewline
Raw Input & view raw input (R code)  \tabularnewline
Raw Output & view raw output of R engine  \tabularnewline
Computing time & 1 seconds \tabularnewline
R Server & 'Gwilym Jenkins' @ 72.249.127.135 \tabularnewline
\hline
\end{tabular}
%Source: https://freestatistics.org/blog/index.php?pk=35986&T=0

[TABLE]
[ROW][C]Summary of computational transaction[/C][/ROW]
[ROW][C]Raw Input[/C][C]view raw input (R code) [/C][/ROW]
[ROW][C]Raw Output[/C][C]view raw output of R engine [/C][/ROW]
[ROW][C]Computing time[/C][C]1 seconds[/C][/ROW]
[ROW][C]R Server[/C][C]'Gwilym Jenkins' @ 72.249.127.135[/C][/ROW]
[/TABLE]
Source: https://freestatistics.org/blog/index.php?pk=35986&T=0

Globally Unique Identifier (entire table): ba.freestatistics.org/blog/index.php?pk=35986&T=0

As an alternative you can also use a QR Code:  

The GUIDs for individual cells are displayed in the table below:

Summary of computational transaction
Raw Inputview raw input (R code)
Raw Outputview raw output of R engine
Computing time1 seconds
R Server'Gwilym Jenkins' @ 72.249.127.135


Standard Deviation-Mean Plot
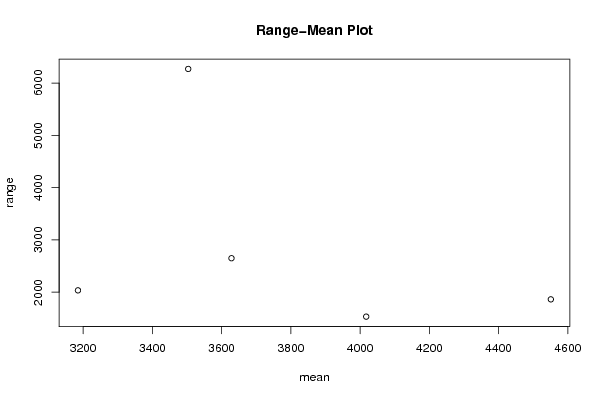
SectionMeanStandard DeviationRange
14550.66666666667594.1226278889711864
24017.41666666667524.6344975891371533
33628.33333333333686.4835737071192650
43185590.204278965422036
53503.416666666671603.644228189686269

\begin{tabular}{lllllllll}
\hline
Standard Deviation-Mean Plot \tabularnewline
Section & Mean & Standard Deviation & Range \tabularnewline
1 & 4550.66666666667 & 594.122627888971 & 1864 \tabularnewline
2 & 4017.41666666667 & 524.634497589137 & 1533 \tabularnewline
3 & 3628.33333333333 & 686.483573707119 & 2650 \tabularnewline
4 & 3185 & 590.20427896542 & 2036 \tabularnewline
5 & 3503.41666666667 & 1603.64422818968 & 6269 \tabularnewline
\hline
\end{tabular}
%Source: https://freestatistics.org/blog/index.php?pk=35986&T=1

[TABLE]
[ROW][C]Standard Deviation-Mean Plot[/C][/ROW]
[ROW][C]Section[/C][C]Mean[/C][C]Standard Deviation[/C][C]Range[/C][/ROW]
[ROW][C]1[/C][C]4550.66666666667[/C][C]594.122627888971[/C][C]1864[/C][/ROW]
[ROW][C]2[/C][C]4017.41666666667[/C][C]524.634497589137[/C][C]1533[/C][/ROW]
[ROW][C]3[/C][C]3628.33333333333[/C][C]686.483573707119[/C][C]2650[/C][/ROW]
[ROW][C]4[/C][C]3185[/C][C]590.20427896542[/C][C]2036[/C][/ROW]
[ROW][C]5[/C][C]3503.41666666667[/C][C]1603.64422818968[/C][C]6269[/C][/ROW]
[/TABLE]
Source: https://freestatistics.org/blog/index.php?pk=35986&T=1

Globally Unique Identifier (entire table): ba.freestatistics.org/blog/index.php?pk=35986&T=1

As an alternative you can also use a QR Code:  

The GUIDs for individual cells are displayed in the table below:

Standard Deviation-Mean Plot
SectionMeanStandard DeviationRange
14550.66666666667594.1226278889711864
24017.41666666667524.6344975891371533
33628.33333333333686.4835737071192650
43185590.204278965422036
53503.416666666671603.644228189686269


Regression: S.E.(k) = alpha + beta * Mean(k)
alpha1840.99401130932
beta-0.275664643596163
S.D.0.471798217756538
T-STAT-0.584285046490816
p-value0.600062028270292

\begin{tabular}{lllllllll}
\hline
Regression: S.E.(k) = alpha + beta * Mean(k) \tabularnewline
alpha & 1840.99401130932 \tabularnewline
beta & -0.275664643596163 \tabularnewline
S.D. & 0.471798217756538 \tabularnewline
T-STAT & -0.584285046490816 \tabularnewline
p-value & 0.600062028270292 \tabularnewline
\hline
\end{tabular}
%Source: https://freestatistics.org/blog/index.php?pk=35986&T=2

[TABLE]
[ROW][C]Regression: S.E.(k) = alpha + beta * Mean(k)[/C][/ROW]
[ROW][C]alpha[/C][C]1840.99401130932[/C][/ROW]
[ROW][C]beta[/C][C]-0.275664643596163[/C][/ROW]
[ROW][C]S.D.[/C][C]0.471798217756538[/C][/ROW]
[ROW][C]T-STAT[/C][C]-0.584285046490816[/C][/ROW]
[ROW][C]p-value[/C][C]0.600062028270292[/C][/ROW]
[/TABLE]
Source: https://freestatistics.org/blog/index.php?pk=35986&T=2

Globally Unique Identifier (entire table): ba.freestatistics.org/blog/index.php?pk=35986&T=2

As an alternative you can also use a QR Code:  

The GUIDs for individual cells are displayed in the table below:

Regression: S.E.(k) = alpha + beta * Mean(k)
alpha1840.99401130932
beta-0.275664643596163
S.D.0.471798217756538
T-STAT-0.584285046490816
p-value0.600062028270292


Regression: ln S.E.(k) = alpha + beta * ln Mean(k)
alpha15.3507326187382
beta-1.06479753587245
S.D.1.81277630714713
T-STAT-0.587384958460859
p-value0.598227113582187
Lambda2.06479753587245

\begin{tabular}{lllllllll}
\hline
Regression: ln S.E.(k) = alpha + beta * ln Mean(k) \tabularnewline
alpha & 15.3507326187382 \tabularnewline
beta & -1.06479753587245 \tabularnewline
S.D. & 1.81277630714713 \tabularnewline
T-STAT & -0.587384958460859 \tabularnewline
p-value & 0.598227113582187 \tabularnewline
Lambda & 2.06479753587245 \tabularnewline
\hline
\end{tabular}
%Source: https://freestatistics.org/blog/index.php?pk=35986&T=3

[TABLE]
[ROW][C]Regression: ln S.E.(k) = alpha + beta * ln Mean(k)[/C][/ROW]
[ROW][C]alpha[/C][C]15.3507326187382[/C][/ROW]
[ROW][C]beta[/C][C]-1.06479753587245[/C][/ROW]
[ROW][C]S.D.[/C][C]1.81277630714713[/C][/ROW]
[ROW][C]T-STAT[/C][C]-0.587384958460859[/C][/ROW]
[ROW][C]p-value[/C][C]0.598227113582187[/C][/ROW]
[ROW][C]Lambda[/C][C]2.06479753587245[/C][/ROW]
[/TABLE]
Source: https://freestatistics.org/blog/index.php?pk=35986&T=3

Globally Unique Identifier (entire table): ba.freestatistics.org/blog/index.php?pk=35986&T=3

As an alternative you can also use a QR Code:  

The GUIDs for individual cells are displayed in the table below:

Regression: ln S.E.(k) = alpha + beta * ln Mean(k)
alpha15.3507326187382
beta-1.06479753587245
S.D.1.81277630714713
T-STAT-0.587384958460859
p-value0.598227113582187
Lambda2.06479753587245


Parameters (Session):
par1 = 12 ;
Parameters (R input):
par1 = 12 ;
R code (references can be found in the software module):
par1 <- as.numeric(par1)
(n <- length(x))
(np <- floor(n / par1))
arr <- array(NA,dim=c(par1,np))
j <- 0
k <- 1
for (i in 1:(np*par1))
{
j = j + 1
arr[j,k] <- x[i]
if (j == par1) {
j = 0
k=k+1
}
}
arr
arr.mean <- array(NA,dim=np)
arr.sd <- array(NA,dim=np)
arr.range <- array(NA,dim=np)
for (j in 1:np)
{
arr.mean[j] <- mean(arr[,j],na.rm=TRUE)
arr.sd[j] <- sd(arr[,j],na.rm=TRUE)
arr.range[j] <- max(arr[,j],na.rm=TRUE) - min(arr[,j],na.rm=TRUE)
}
arr.mean
arr.sd
arr.range
(lm1 <- lm(arr.sd~arr.mean))
(lnlm1 <- lm(log(arr.sd)~log(arr.mean)))
(lm2 <- lm(arr.range~arr.mean))
bitmap(file='test1.png')
plot(arr.mean,arr.sd,main='Standard Deviation-Mean Plot',xlab='mean',ylab='standard deviation')
dev.off()
bitmap(file='test2.png')
plot(arr.mean,arr.range,main='Range-Mean Plot',xlab='mean',ylab='range')
dev.off()
load(file='createtable')
a<-table.start()
a<-table.row.start(a)
a<-table.element(a,'Standard Deviation-Mean Plot',4,TRUE)
a<-table.row.end(a)
a<-table.row.start(a)
a<-table.element(a,'Section',header=TRUE)
a<-table.element(a,'Mean',header=TRUE)
a<-table.element(a,'Standard Deviation',header=TRUE)
a<-table.element(a,'Range',header=TRUE)
a<-table.row.end(a)
for (j in 1:np) {
a<-table.row.start(a)
a<-table.element(a,j,header=TRUE)
a<-table.element(a,arr.mean[j])
a<-table.element(a,arr.sd[j] )
a<-table.element(a,arr.range[j] )
a<-table.row.end(a)
}
a<-table.end(a)
table.save(a,file='mytable.tab')
a<-table.start()
a<-table.row.start(a)
a<-table.element(a,'Regression: S.E.(k) = alpha + beta * Mean(k)',2,TRUE)
a<-table.row.end(a)
a<-table.row.start(a)
a<-table.element(a,'alpha',header=TRUE)
a<-table.element(a,lm1$coefficients[[1]])
a<-table.row.end(a)
a<-table.row.start(a)
a<-table.element(a,'beta',header=TRUE)
a<-table.element(a,lm1$coefficients[[2]])
a<-table.row.end(a)
a<-table.row.start(a)
a<-table.element(a,'S.D.',header=TRUE)
a<-table.element(a,summary(lm1)$coefficients[2,2])
a<-table.row.end(a)
a<-table.row.start(a)
a<-table.element(a,'T-STAT',header=TRUE)
a<-table.element(a,summary(lm1)$coefficients[2,3])
a<-table.row.end(a)
a<-table.row.start(a)
a<-table.element(a,'p-value',header=TRUE)
a<-table.element(a,summary(lm1)$coefficients[2,4])
a<-table.row.end(a)
a<-table.end(a)
table.save(a,file='mytable1.tab')
a<-table.start()
a<-table.row.start(a)
a<-table.element(a,'Regression: ln S.E.(k) = alpha + beta * ln Mean(k)',2,TRUE)
a<-table.row.end(a)
a<-table.row.start(a)
a<-table.element(a,'alpha',header=TRUE)
a<-table.element(a,lnlm1$coefficients[[1]])
a<-table.row.end(a)
a<-table.row.start(a)
a<-table.element(a,'beta',header=TRUE)
a<-table.element(a,lnlm1$coefficients[[2]])
a<-table.row.end(a)
a<-table.row.start(a)
a<-table.element(a,'S.D.',header=TRUE)
a<-table.element(a,summary(lnlm1)$coefficients[2,2])
a<-table.row.end(a)
a<-table.row.start(a)
a<-table.element(a,'T-STAT',header=TRUE)
a<-table.element(a,summary(lnlm1)$coefficients[2,3])
a<-table.row.end(a)
a<-table.row.start(a)
a<-table.element(a,'p-value',header=TRUE)
a<-table.element(a,summary(lnlm1)$coefficients[2,4])
a<-table.row.end(a)
a<-table.row.start(a)
a<-table.element(a,'Lambda',header=TRUE)
a<-table.element(a,1-lnlm1$coefficients[[2]])
a<-table.row.end(a)
a<-table.end(a)
table.save(a,file='mytable2.tab')