Free Statistics
of Irreproducible Research!
Description of Statistical Computation | |||||||||||||||||||||||||||||||||||||||||||||||||||||||||||||||||||||||||||||||||||||||||||||||||||||||||||||||||||||||||||||||||||||||||||||
|---|---|---|---|---|---|---|---|---|---|---|---|---|---|---|---|---|---|---|---|---|---|---|---|---|---|---|---|---|---|---|---|---|---|---|---|---|---|---|---|---|---|---|---|---|---|---|---|---|---|---|---|---|---|---|---|---|---|---|---|---|---|---|---|---|---|---|---|---|---|---|---|---|---|---|---|---|---|---|---|---|---|---|---|---|---|---|---|---|---|---|---|---|---|---|---|---|---|---|---|---|---|---|---|---|---|---|---|---|---|---|---|---|---|---|---|---|---|---|---|---|---|---|---|---|---|---|---|---|---|---|---|---|---|---|---|---|---|---|---|---|---|
| Author's title | |||||||||||||||||||||||||||||||||||||||||||||||||||||||||||||||||||||||||||||||||||||||||||||||||||||||||||||||||||||||||||||||||||||||||||||
| Author | *Unverified author* | ||||||||||||||||||||||||||||||||||||||||||||||||||||||||||||||||||||||||||||||||||||||||||||||||||||||||||||||||||||||||||||||||||||||||||||
| R Software Module | rwasp_notchedbox1.wasp | ||||||||||||||||||||||||||||||||||||||||||||||||||||||||||||||||||||||||||||||||||||||||||||||||||||||||||||||||||||||||||||||||||||||||||||
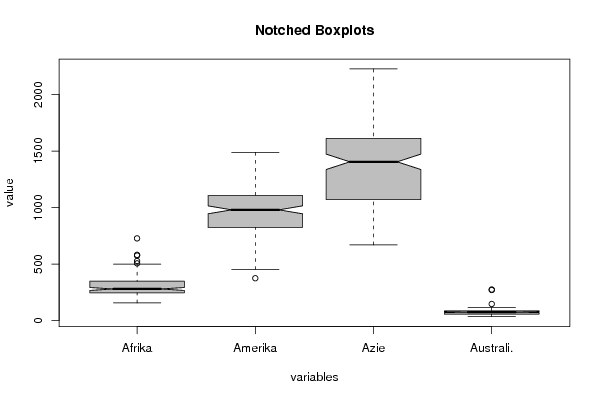
| Title produced by software | Notched Boxplots | ||||||||||||||||||||||||||||||||||||||||||||||||||||||||||||||||||||||||||||||||||||||||||||||||||||||||||||||||||||||||||||||||||||||||||||
| Date of computation | Mon, 22 Dec 2008 02:27:53 -0700 | ||||||||||||||||||||||||||||||||||||||||||||||||||||||||||||||||||||||||||||||||||||||||||||||||||||||||||||||||||||||||||||||||||||||||||||
| Cite this page as follows | Statistical Computations at FreeStatistics.org, Office for Research Development and Education, URL https://freestatistics.org/blog/index.php?v=date/2008/Dec/22/t1229938151s2lmynpbmk35bsh.htm/, Retrieved Mon, 13 May 2024 13:53:59 +0000 | ||||||||||||||||||||||||||||||||||||||||||||||||||||||||||||||||||||||||||||||||||||||||||||||||||||||||||||||||||||||||||||||||||||||||||||
| Statistical Computations at FreeStatistics.org, Office for Research Development and Education, URL https://freestatistics.org/blog/index.php?pk=35958, Retrieved Mon, 13 May 2024 13:53:59 +0000 | |||||||||||||||||||||||||||||||||||||||||||||||||||||||||||||||||||||||||||||||||||||||||||||||||||||||||||||||||||||||||||||||||||||||||||||
| QR Codes: | |||||||||||||||||||||||||||||||||||||||||||||||||||||||||||||||||||||||||||||||||||||||||||||||||||||||||||||||||||||||||||||||||||||||||||||
|
| |||||||||||||||||||||||||||||||||||||||||||||||||||||||||||||||||||||||||||||||||||||||||||||||||||||||||||||||||||||||||||||||||||||||||||||
| Original text written by user: | |||||||||||||||||||||||||||||||||||||||||||||||||||||||||||||||||||||||||||||||||||||||||||||||||||||||||||||||||||||||||||||||||||||||||||||
| IsPrivate? | No (this computation is public) | ||||||||||||||||||||||||||||||||||||||||||||||||||||||||||||||||||||||||||||||||||||||||||||||||||||||||||||||||||||||||||||||||||||||||||||
| User-defined keywords | |||||||||||||||||||||||||||||||||||||||||||||||||||||||||||||||||||||||||||||||||||||||||||||||||||||||||||||||||||||||||||||||||||||||||||||
| Estimated Impact | 161 | ||||||||||||||||||||||||||||||||||||||||||||||||||||||||||||||||||||||||||||||||||||||||||||||||||||||||||||||||||||||||||||||||||||||||||||
Tree of Dependent Computations | |||||||||||||||||||||||||||||||||||||||||||||||||||||||||||||||||||||||||||||||||||||||||||||||||||||||||||||||||||||||||||||||||||||||||||||
| Family? (F = Feedback message, R = changed R code, M = changed R Module, P = changed Parameters, D = changed Data) | |||||||||||||||||||||||||||||||||||||||||||||||||||||||||||||||||||||||||||||||||||||||||||||||||||||||||||||||||||||||||||||||||||||||||||||
| - [Notched Boxplots] [Paper] [2008-12-22 09:27:53] [80e37024345c6a903bf645806b7fbe14] [Current] | |||||||||||||||||||||||||||||||||||||||||||||||||||||||||||||||||||||||||||||||||||||||||||||||||||||||||||||||||||||||||||||||||||||||||||||
| Feedback Forum | |||||||||||||||||||||||||||||||||||||||||||||||||||||||||||||||||||||||||||||||||||||||||||||||||||||||||||||||||||||||||||||||||||||||||||||
Post a new message | |||||||||||||||||||||||||||||||||||||||||||||||||||||||||||||||||||||||||||||||||||||||||||||||||||||||||||||||||||||||||||||||||||||||||||||
Dataset | |||||||||||||||||||||||||||||||||||||||||||||||||||||||||||||||||||||||||||||||||||||||||||||||||||||||||||||||||||||||||||||||||||||||||||||
| Dataseries X: | |||||||||||||||||||||||||||||||||||||||||||||||||||||||||||||||||||||||||||||||||||||||||||||||||||||||||||||||||||||||||||||||||||||||||||||
184 522.9 1025.5 46.4 155 374.1 691.2 44.6 201.8 529.1 971.6 46.6 224.6 590.9 926 54.1 204.9 521.7 997.1 35.3 190.8 450.8 964.9 38.6 199 493.6 860 37.3 179.9 543.5 948 41.2 211.9 574.5 951.4 44.7 200.1 537.8 827.3 41.4 208.6 628.5 994 51 232.6 615.7 944.5 54.1 199.5 648.6 976.2 48.9 169.1 496.4 668.8 34 194.4 654.5 939.9 54.7 227.9 699.5 1096.1 51 224 601.9 977.7 44.9 258.1 509.8 1096.9 44.5 207.6 610.6 1060.8 53.9 228 719.9 1121.4 49.8 221 742.5 1190.9 47.6 247.3 775.7 1177.9 59.9 214.3 729.4 1108.1 45.3 252.5 669.7 1045.6 58.4 256.7 895.7 1263.9 58.9 194.9 577.1 911 49.3 264.6 878.1 1175.9 66.6 277.1 919.3 1091.3 74.5 236.6 807.4 1027.7 47.3 271.6 849.4 1081.7 57.6 216.3 863.5 879.7 47 241.1 825.6 955.5 51 265.8 842.2 1037.9 61.9 280.6 716.9 959.9 61.5 276.8 827 931.8 47.2 263.7 940.5 1062.2 47.9 231.3 886 1077.2 58.2 190.9 727.5 668.4 46.3 250.9 900.3 954.3 55.6 252.8 872.8 797.2 65.1 214.4 781.9 829.2 44.8 268.2 696.4 957.3 62.7 178 673 844.2 40.7 215.6 755.6 893.6 45.2 241.3 983.1 1132 53.7 228.3 812.5 898.8 55 236.5 807.3 1064 44.5 263.5 948 1279.7 62.8 238.8 1076.8 1382.5 56.4 215.1 711.9 824.1 61.2 244.6 936.7 1304.1 64.5 263.5 977.7 1253.5 63.7 242.7 844.4 1136.3 55.8 253.4 854.6 1414.7 69.1 197.3 880.8 1293.2 71.1 250.5 959.8 1325.7 71.7 290.8 1273.7 1463.8 78.4 245.9 897.2 1244.2 60.2 299.5 1186.8 1573.6 69.6 295.8 917.2 1327.3 66.3 264.1 1213.3 1418.5 68.5 262.7 854.9 1042.2 51.8 297.1 1488.2 1384.8 76 345.1 1232.9 1474.8 89 293.9 1192.3 1556.5 83.2 269.4 1081.6 1466.2 73.3 244.9 1015.9 1221.7 71.8 274.2 1157.1 1279.7 60.1 312.5 1195 1348.4 94.1 279 957.3 1189.8 86 327.3 1106.6 1296.6 69.5 289.2 1091 1417.6 79.4 285.4 1161.4 1513.9 88 248.9 774.6 1006.1 53.1 240.6 934.5 1202.8 76.9 308.5 1161.1 1258.8 79.4 285.6 1056.5 1211.5 74 284.4 885.2 1283.3 63 253.6 1039.2 1332.3 65.2 286.3 1033.2 1374.3 77 302.2 1118.9 1406.1 80.5 278 1125.7 1419.1 83.5 304.3 1152.4 1554.4 93.5 304.6 961.9 1499.8 95.8 283.7 1190.8 1609.6 105 253.8 728.8 1033.9 55.3 266.6 995.6 1550.5 95 345.7 1260.3 1491.4 97.1 287 994 1368.9 73 282.1 957.3 1537.1 78.3 268.1 975.6 1492.3 67 274.6 884.9 1504.1 81.3 275.9 908.4 1301.2 88.7 287.5 1022.8 1344.2 86.4 276 958.6 1319.1 82.2 270.8 825.1 1420.3 96.5 295.3 1116.6 1582.9 99.4 246.5 724.2 1002.6 55.7 271.8 1004.5 1559.1 95.7 335.2 1058.9 1462.7 95.4 253.3 854.7 1414.8 79.1 297.2 943.4 1537.5 95.9 245.4 792.4 1455.9 77.2 271.6 873.2 1619.9 85.1 316.1 1101.4 1667.2 86.8 304.4 987.1 1488.9 63.2 289.1 1038.8 1442.5 61.1 370.6 1060.7 1779.6 73.5 300 1047.7 1801.9 80.5 269.6 840 1233.4 69.2 346.3 1044 1581.1 81.3 348.2 1097.4 1515 88.3 317.9 987.5 1439.2 75.3 365.8 934 1585.8 77.1 260.4 977 1488.8 70.4 292.8 881.1 1601.3 82 404.3 1083.3 1646.8 78.7 341.4 1074.7 1630.2 69.9 351.1 1182.2 1720.7 86.1 384.7 1117.5 2013.5 86.3 358.8 1117.4 2051.2 99 332.8 936.2 1404.7 67.9 381.1 1246.3 2015.9 112.9 340.8 1175.1 1544.1 80 348.6 1177.7 1816.6 78.7 356.9 1035.8 1773.4 77.6 321.7 1091.6 1577.4 94.5 360.1 998.7 1709.8 84.2 399.4 1247.9 1810.2 86.1 340.4 1034.7 1520.5 63.7 430.4 1287.7 1798.6 77.4 463.1 994 1666.8 84 423 1122.8 1730.4 90.5 416.1 1017.3 1147.8 77.2 364 1106 1777 93.4 379.9 1191.8 1700 96.7 395.8 1030.1 1907.4 88.8 418.8 989.4 1745.8 114 396.4 979.6 1771.6 86.8 407.9 1088 1790.2 79 487.9 1389.2 1958.7 87.8 458.2 1043.9 1560.4 84.8 432.1 1182.1 1752.1 81.4 498.5 1109.6 2011.6 100.1 448.3 1463.3 2082.8 96 410.8 1276.2 1616.4 83.3 406 1082.4 1846.1 102.3 441 1365.5 1824.9 113.5 388.9 1134.1 1711.3 91.5 390.5 1041.3 1805 85.3 427.8 1085.7 1737.6 87.5 442.1 1011.6 1939.6 70.9 427 1181.6 1711.4 84.1 526.7 1338.1 1964.8 112.4 464.4 1257 1864.4 274.1 574.4 1194 1980.7 146.3 727 1402.7 2226.7 115.8 506 992.6 1433.3 93.6 581.2 1474.1 1960.7 269.9 | |||||||||||||||||||||||||||||||||||||||||||||||||||||||||||||||||||||||||||||||||||||||||||||||||||||||||||||||||||||||||||||||||||||||||||||
Tables (Output of Computation) | |||||||||||||||||||||||||||||||||||||||||||||||||||||||||||||||||||||||||||||||||||||||||||||||||||||||||||||||||||||||||||||||||||||||||||||
| |||||||||||||||||||||||||||||||||||||||||||||||||||||||||||||||||||||||||||||||||||||||||||||||||||||||||||||||||||||||||||||||||||||||||||||
Figures (Output of Computation) | |||||||||||||||||||||||||||||||||||||||||||||||||||||||||||||||||||||||||||||||||||||||||||||||||||||||||||||||||||||||||||||||||||||||||||||
Input Parameters & R Code | |||||||||||||||||||||||||||||||||||||||||||||||||||||||||||||||||||||||||||||||||||||||||||||||||||||||||||||||||||||||||||||||||||||||||||||
| Parameters (Session): | |||||||||||||||||||||||||||||||||||||||||||||||||||||||||||||||||||||||||||||||||||||||||||||||||||||||||||||||||||||||||||||||||||||||||||||
| par1 = grey ; | |||||||||||||||||||||||||||||||||||||||||||||||||||||||||||||||||||||||||||||||||||||||||||||||||||||||||||||||||||||||||||||||||||||||||||||
| Parameters (R input): | |||||||||||||||||||||||||||||||||||||||||||||||||||||||||||||||||||||||||||||||||||||||||||||||||||||||||||||||||||||||||||||||||||||||||||||
| par1 = grey ; | |||||||||||||||||||||||||||||||||||||||||||||||||||||||||||||||||||||||||||||||||||||||||||||||||||||||||||||||||||||||||||||||||||||||||||||
| R code (references can be found in the software module): | |||||||||||||||||||||||||||||||||||||||||||||||||||||||||||||||||||||||||||||||||||||||||||||||||||||||||||||||||||||||||||||||||||||||||||||
z <- as.data.frame(t(y)) | |||||||||||||||||||||||||||||||||||||||||||||||||||||||||||||||||||||||||||||||||||||||||||||||||||||||||||||||||||||||||||||||||||||||||||||