Free Statistics

of Irreproducible Research!

Author's title

Author*Unverified author*
R Software Modulerwasp_autocorrelation.wasp
Title produced by software(Partial) Autocorrelation Function
Date of computationMon, 22 Dec 2008 00:48:52 -0700
Cite this page as followsStatistical Computations at FreeStatistics.org, Office for Research Development and Education, URL https://freestatistics.org/blog/index.php?v=date/2008/Dec/22/t1229932714yr56986rrnkp7y2.htm/, Retrieved Sun, 12 May 2024 19:50:17 +0000
Statistical Computations at FreeStatistics.org, Office for Research Development and Education, URL https://freestatistics.org/blog/index.php?pk=35939, Retrieved Sun, 12 May 2024 19:50:17 +0000
QR Codes:

Original text written by user:
IsPrivate?No (this computation is public)
User-defined keywords
Estimated Impact198
Family? (F = Feedback message, R = changed R code, M = changed R Module, P = changed Parameters, D = changed Data)
-     [(Partial) Autocorrelation Function] [paper auto 1] [2007-12-01 12:01:15] [22f18fc6a98517db16300404be421f9a]
- R PD    [(Partial) Autocorrelation Function] [Autocorrelation e...] [2008-12-22 07:48:52] [d41d8cd98f00b204e9800998ecf8427e] [Current]
Feedback Forum

Post a new message
Dataseries X:
104
107,9
113,8
113,8
123,1
125,1
137,6
134
140,3
152,1
150,6
167,3
153,2
142
154,4
158,5
180,9
181,3
172,4
192
199,3
215,4
214,3
201,5
190,5
196
215,7
209,4
214,1
237,8
239
237,8
251,5
248,8
215,4
201,2
203,1
214,2
188,9
203
213,3
228,5
228,2
240,9
258,8
248,5
269,2
289,6
323,4
317,2
322,8
340,9
368,2
388,5
441,2
474,3
483,9
417,9
365,9
263
199,4


Summary of computational transaction
Raw Inputview raw input (R code)
Raw Outputview raw output of R engine
Computing time2 seconds
R Server'Sir Ronald Aylmer Fisher' @ 193.190.124.24

\begin{tabular}{lllllllll}
\hline
Summary of computational transaction \tabularnewline
Raw Input & view raw input (R code)  \tabularnewline
Raw Output & view raw output of R engine  \tabularnewline
Computing time & 2 seconds \tabularnewline
R Server & 'Sir Ronald Aylmer Fisher' @ 193.190.124.24 \tabularnewline
\hline
\end{tabular}
%Source: https://freestatistics.org/blog/index.php?pk=35939&T=0

[TABLE]
[ROW][C]Summary of computational transaction[/C][/ROW]
[ROW][C]Raw Input[/C][C]view raw input (R code) [/C][/ROW]
[ROW][C]Raw Output[/C][C]view raw output of R engine [/C][/ROW]
[ROW][C]Computing time[/C][C]2 seconds[/C][/ROW]
[ROW][C]R Server[/C][C]'Sir Ronald Aylmer Fisher' @ 193.190.124.24[/C][/ROW]
[/TABLE]
Source: https://freestatistics.org/blog/index.php?pk=35939&T=0

Globally Unique Identifier (entire table): ba.freestatistics.org/blog/index.php?pk=35939&T=0

As an alternative you can also use a QR Code:  

The GUIDs for individual cells are displayed in the table below:

Summary of computational transaction
Raw Inputview raw input (R code)
Raw Outputview raw output of R engine
Computing time2 seconds
R Server'Sir Ronald Aylmer Fisher' @ 193.190.124.24


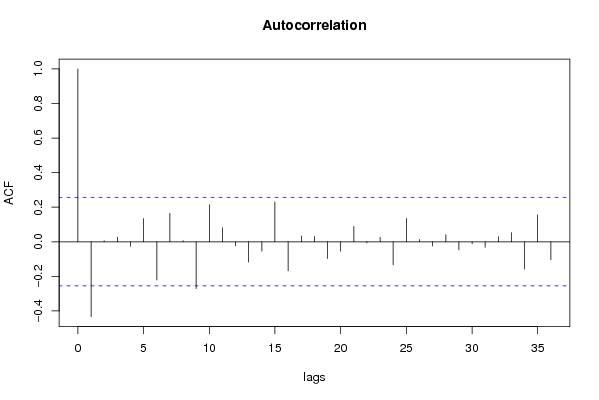
Autocorrelation Function
Time lag kACF(k)T-STATP-value
1-0.433073-3.32650.000759
20.0060660.04660.481499
30.0265230.20370.419634
4-0.026039-0.20.421082
50.1344011.03240.15306
6-0.220816-1.69610.047567
70.1640541.26010.106293
80.0062730.04820.480865
9-0.270418-2.07710.021076
100.2136861.64140.053023
110.0814440.62560.267002
12-0.022296-0.17130.432303
13-0.117005-0.89870.186225
14-0.05418-0.41620.339399
150.2299811.76650.041241
16-0.16813-1.29140.100795
170.0334030.25660.3992
180.030660.23550.407315
19-0.097142-0.74620.229265
20-0.05431-0.41720.339038
210.0884570.67940.249756
22-0.006294-0.04830.480803
230.0257130.19750.422055
24-0.132971-1.02140.155624
250.1347131.03480.152504
260.0134720.10350.458967
27-0.02472-0.18990.425029
280.0408460.31370.377411
29-0.046751-0.35910.360401
30-0.011588-0.0890.464689
31-0.031265-0.24020.405523
320.0284720.21870.413821
330.0527370.40510.343441
34-0.15728-1.20810.115916
350.15491.18980.119444
36-0.103478-0.79480.214949

\begin{tabular}{lllllllll}
\hline
Autocorrelation Function \tabularnewline
Time lag k & ACF(k) & T-STAT & P-value \tabularnewline
1 & -0.433073 & -3.3265 & 0.000759 \tabularnewline
2 & 0.006066 & 0.0466 & 0.481499 \tabularnewline
3 & 0.026523 & 0.2037 & 0.419634 \tabularnewline
4 & -0.026039 & -0.2 & 0.421082 \tabularnewline
5 & 0.134401 & 1.0324 & 0.15306 \tabularnewline
6 & -0.220816 & -1.6961 & 0.047567 \tabularnewline
7 & 0.164054 & 1.2601 & 0.106293 \tabularnewline
8 & 0.006273 & 0.0482 & 0.480865 \tabularnewline
9 & -0.270418 & -2.0771 & 0.021076 \tabularnewline
10 & 0.213686 & 1.6414 & 0.053023 \tabularnewline
11 & 0.081444 & 0.6256 & 0.267002 \tabularnewline
12 & -0.022296 & -0.1713 & 0.432303 \tabularnewline
13 & -0.117005 & -0.8987 & 0.186225 \tabularnewline
14 & -0.05418 & -0.4162 & 0.339399 \tabularnewline
15 & 0.229981 & 1.7665 & 0.041241 \tabularnewline
16 & -0.16813 & -1.2914 & 0.100795 \tabularnewline
17 & 0.033403 & 0.2566 & 0.3992 \tabularnewline
18 & 0.03066 & 0.2355 & 0.407315 \tabularnewline
19 & -0.097142 & -0.7462 & 0.229265 \tabularnewline
20 & -0.05431 & -0.4172 & 0.339038 \tabularnewline
21 & 0.088457 & 0.6794 & 0.249756 \tabularnewline
22 & -0.006294 & -0.0483 & 0.480803 \tabularnewline
23 & 0.025713 & 0.1975 & 0.422055 \tabularnewline
24 & -0.132971 & -1.0214 & 0.155624 \tabularnewline
25 & 0.134713 & 1.0348 & 0.152504 \tabularnewline
26 & 0.013472 & 0.1035 & 0.458967 \tabularnewline
27 & -0.02472 & -0.1899 & 0.425029 \tabularnewline
28 & 0.040846 & 0.3137 & 0.377411 \tabularnewline
29 & -0.046751 & -0.3591 & 0.360401 \tabularnewline
30 & -0.011588 & -0.089 & 0.464689 \tabularnewline
31 & -0.031265 & -0.2402 & 0.405523 \tabularnewline
32 & 0.028472 & 0.2187 & 0.413821 \tabularnewline
33 & 0.052737 & 0.4051 & 0.343441 \tabularnewline
34 & -0.15728 & -1.2081 & 0.115916 \tabularnewline
35 & 0.1549 & 1.1898 & 0.119444 \tabularnewline
36 & -0.103478 & -0.7948 & 0.214949 \tabularnewline
\hline
\end{tabular}
%Source: https://freestatistics.org/blog/index.php?pk=35939&T=1

[TABLE]
[ROW][C]Autocorrelation Function[/C][/ROW]
[ROW][C]Time lag k[/C][C]ACF(k)[/C][C]T-STAT[/C][C]P-value[/C][/ROW]
[ROW][C]1[/C][C]-0.433073[/C][C]-3.3265[/C][C]0.000759[/C][/ROW]
[ROW][C]2[/C][C]0.006066[/C][C]0.0466[/C][C]0.481499[/C][/ROW]
[ROW][C]3[/C][C]0.026523[/C][C]0.2037[/C][C]0.419634[/C][/ROW]
[ROW][C]4[/C][C]-0.026039[/C][C]-0.2[/C][C]0.421082[/C][/ROW]
[ROW][C]5[/C][C]0.134401[/C][C]1.0324[/C][C]0.15306[/C][/ROW]
[ROW][C]6[/C][C]-0.220816[/C][C]-1.6961[/C][C]0.047567[/C][/ROW]
[ROW][C]7[/C][C]0.164054[/C][C]1.2601[/C][C]0.106293[/C][/ROW]
[ROW][C]8[/C][C]0.006273[/C][C]0.0482[/C][C]0.480865[/C][/ROW]
[ROW][C]9[/C][C]-0.270418[/C][C]-2.0771[/C][C]0.021076[/C][/ROW]
[ROW][C]10[/C][C]0.213686[/C][C]1.6414[/C][C]0.053023[/C][/ROW]
[ROW][C]11[/C][C]0.081444[/C][C]0.6256[/C][C]0.267002[/C][/ROW]
[ROW][C]12[/C][C]-0.022296[/C][C]-0.1713[/C][C]0.432303[/C][/ROW]
[ROW][C]13[/C][C]-0.117005[/C][C]-0.8987[/C][C]0.186225[/C][/ROW]
[ROW][C]14[/C][C]-0.05418[/C][C]-0.4162[/C][C]0.339399[/C][/ROW]
[ROW][C]15[/C][C]0.229981[/C][C]1.7665[/C][C]0.041241[/C][/ROW]
[ROW][C]16[/C][C]-0.16813[/C][C]-1.2914[/C][C]0.100795[/C][/ROW]
[ROW][C]17[/C][C]0.033403[/C][C]0.2566[/C][C]0.3992[/C][/ROW]
[ROW][C]18[/C][C]0.03066[/C][C]0.2355[/C][C]0.407315[/C][/ROW]
[ROW][C]19[/C][C]-0.097142[/C][C]-0.7462[/C][C]0.229265[/C][/ROW]
[ROW][C]20[/C][C]-0.05431[/C][C]-0.4172[/C][C]0.339038[/C][/ROW]
[ROW][C]21[/C][C]0.088457[/C][C]0.6794[/C][C]0.249756[/C][/ROW]
[ROW][C]22[/C][C]-0.006294[/C][C]-0.0483[/C][C]0.480803[/C][/ROW]
[ROW][C]23[/C][C]0.025713[/C][C]0.1975[/C][C]0.422055[/C][/ROW]
[ROW][C]24[/C][C]-0.132971[/C][C]-1.0214[/C][C]0.155624[/C][/ROW]
[ROW][C]25[/C][C]0.134713[/C][C]1.0348[/C][C]0.152504[/C][/ROW]
[ROW][C]26[/C][C]0.013472[/C][C]0.1035[/C][C]0.458967[/C][/ROW]
[ROW][C]27[/C][C]-0.02472[/C][C]-0.1899[/C][C]0.425029[/C][/ROW]
[ROW][C]28[/C][C]0.040846[/C][C]0.3137[/C][C]0.377411[/C][/ROW]
[ROW][C]29[/C][C]-0.046751[/C][C]-0.3591[/C][C]0.360401[/C][/ROW]
[ROW][C]30[/C][C]-0.011588[/C][C]-0.089[/C][C]0.464689[/C][/ROW]
[ROW][C]31[/C][C]-0.031265[/C][C]-0.2402[/C][C]0.405523[/C][/ROW]
[ROW][C]32[/C][C]0.028472[/C][C]0.2187[/C][C]0.413821[/C][/ROW]
[ROW][C]33[/C][C]0.052737[/C][C]0.4051[/C][C]0.343441[/C][/ROW]
[ROW][C]34[/C][C]-0.15728[/C][C]-1.2081[/C][C]0.115916[/C][/ROW]
[ROW][C]35[/C][C]0.1549[/C][C]1.1898[/C][C]0.119444[/C][/ROW]
[ROW][C]36[/C][C]-0.103478[/C][C]-0.7948[/C][C]0.214949[/C][/ROW]
[/TABLE]
Source: https://freestatistics.org/blog/index.php?pk=35939&T=1

Globally Unique Identifier (entire table): ba.freestatistics.org/blog/index.php?pk=35939&T=1

As an alternative you can also use a QR Code:  

The GUIDs for individual cells are displayed in the table below:

Autocorrelation Function
Time lag kACF(k)T-STATP-value
1-0.433073-3.32650.000759
20.0060660.04660.481499
30.0265230.20370.419634
4-0.026039-0.20.421082
50.1344011.03240.15306
6-0.220816-1.69610.047567
70.1640541.26010.106293
80.0062730.04820.480865
9-0.270418-2.07710.021076
100.2136861.64140.053023
110.0814440.62560.267002
12-0.022296-0.17130.432303
13-0.117005-0.89870.186225
14-0.05418-0.41620.339399
150.2299811.76650.041241
16-0.16813-1.29140.100795
170.0334030.25660.3992
180.030660.23550.407315
19-0.097142-0.74620.229265
20-0.05431-0.41720.339038
210.0884570.67940.249756
22-0.006294-0.04830.480803
230.0257130.19750.422055
24-0.132971-1.02140.155624
250.1347131.03480.152504
260.0134720.10350.458967
27-0.02472-0.18990.425029
280.0408460.31370.377411
29-0.046751-0.35910.360401
30-0.011588-0.0890.464689
31-0.031265-0.24020.405523
320.0284720.21870.413821
330.0527370.40510.343441
34-0.15728-1.20810.115916
350.15491.18980.119444
36-0.103478-0.79480.214949


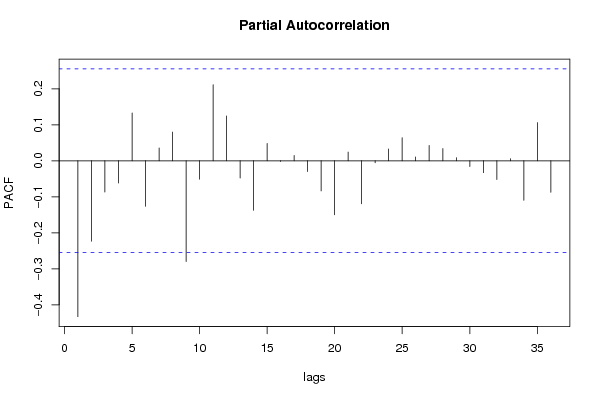
Partial Autocorrelation Function
Time lag kPACF(k)T-STATP-value
1-0.433073-3.32650.000759
2-0.223382-1.71580.04572
3-0.086803-0.66670.253767
4-0.061912-0.47560.318074
50.1329591.02130.155647
6-0.12634-0.97040.167895
70.0356080.27350.392707
80.0796360.61170.271545
9-0.280082-2.15140.017777
10-0.051072-0.39230.348128
110.2111351.62180.055093
120.1244790.95610.171451
13-0.047964-0.36840.356939
14-0.137397-1.05540.14778
150.0482950.3710.355998
16-0.001873-0.01440.494285
170.0146460.11250.455406
18-0.029755-0.22860.410003
19-0.083651-0.64250.261507
20-0.150191-1.15360.126651
210.0242170.1860.426534
22-0.119252-0.9160.1817
23-0.005344-0.0410.483698
240.0326110.25050.401541
250.0638370.49030.312854
260.010690.08210.467419
270.0426620.32770.372151
280.0338240.25980.397958
290.0085210.06540.474019
30-0.01572-0.12070.452151
31-0.032925-0.25290.400611
32-0.052014-0.39950.345475
330.0058970.04530.482012
34-0.109967-0.84470.200853
350.106040.81450.209314
36-0.087442-0.67170.252213

\begin{tabular}{lllllllll}
\hline
Partial Autocorrelation Function \tabularnewline
Time lag k & PACF(k) & T-STAT & P-value \tabularnewline
1 & -0.433073 & -3.3265 & 0.000759 \tabularnewline
2 & -0.223382 & -1.7158 & 0.04572 \tabularnewline
3 & -0.086803 & -0.6667 & 0.253767 \tabularnewline
4 & -0.061912 & -0.4756 & 0.318074 \tabularnewline
5 & 0.132959 & 1.0213 & 0.155647 \tabularnewline
6 & -0.12634 & -0.9704 & 0.167895 \tabularnewline
7 & 0.035608 & 0.2735 & 0.392707 \tabularnewline
8 & 0.079636 & 0.6117 & 0.271545 \tabularnewline
9 & -0.280082 & -2.1514 & 0.017777 \tabularnewline
10 & -0.051072 & -0.3923 & 0.348128 \tabularnewline
11 & 0.211135 & 1.6218 & 0.055093 \tabularnewline
12 & 0.124479 & 0.9561 & 0.171451 \tabularnewline
13 & -0.047964 & -0.3684 & 0.356939 \tabularnewline
14 & -0.137397 & -1.0554 & 0.14778 \tabularnewline
15 & 0.048295 & 0.371 & 0.355998 \tabularnewline
16 & -0.001873 & -0.0144 & 0.494285 \tabularnewline
17 & 0.014646 & 0.1125 & 0.455406 \tabularnewline
18 & -0.029755 & -0.2286 & 0.410003 \tabularnewline
19 & -0.083651 & -0.6425 & 0.261507 \tabularnewline
20 & -0.150191 & -1.1536 & 0.126651 \tabularnewline
21 & 0.024217 & 0.186 & 0.426534 \tabularnewline
22 & -0.119252 & -0.916 & 0.1817 \tabularnewline
23 & -0.005344 & -0.041 & 0.483698 \tabularnewline
24 & 0.032611 & 0.2505 & 0.401541 \tabularnewline
25 & 0.063837 & 0.4903 & 0.312854 \tabularnewline
26 & 0.01069 & 0.0821 & 0.467419 \tabularnewline
27 & 0.042662 & 0.3277 & 0.372151 \tabularnewline
28 & 0.033824 & 0.2598 & 0.397958 \tabularnewline
29 & 0.008521 & 0.0654 & 0.474019 \tabularnewline
30 & -0.01572 & -0.1207 & 0.452151 \tabularnewline
31 & -0.032925 & -0.2529 & 0.400611 \tabularnewline
32 & -0.052014 & -0.3995 & 0.345475 \tabularnewline
33 & 0.005897 & 0.0453 & 0.482012 \tabularnewline
34 & -0.109967 & -0.8447 & 0.200853 \tabularnewline
35 & 0.10604 & 0.8145 & 0.209314 \tabularnewline
36 & -0.087442 & -0.6717 & 0.252213 \tabularnewline
\hline
\end{tabular}
%Source: https://freestatistics.org/blog/index.php?pk=35939&T=2

[TABLE]
[ROW][C]Partial Autocorrelation Function[/C][/ROW]
[ROW][C]Time lag k[/C][C]PACF(k)[/C][C]T-STAT[/C][C]P-value[/C][/ROW]
[ROW][C]1[/C][C]-0.433073[/C][C]-3.3265[/C][C]0.000759[/C][/ROW]
[ROW][C]2[/C][C]-0.223382[/C][C]-1.7158[/C][C]0.04572[/C][/ROW]
[ROW][C]3[/C][C]-0.086803[/C][C]-0.6667[/C][C]0.253767[/C][/ROW]
[ROW][C]4[/C][C]-0.061912[/C][C]-0.4756[/C][C]0.318074[/C][/ROW]
[ROW][C]5[/C][C]0.132959[/C][C]1.0213[/C][C]0.155647[/C][/ROW]
[ROW][C]6[/C][C]-0.12634[/C][C]-0.9704[/C][C]0.167895[/C][/ROW]
[ROW][C]7[/C][C]0.035608[/C][C]0.2735[/C][C]0.392707[/C][/ROW]
[ROW][C]8[/C][C]0.079636[/C][C]0.6117[/C][C]0.271545[/C][/ROW]
[ROW][C]9[/C][C]-0.280082[/C][C]-2.1514[/C][C]0.017777[/C][/ROW]
[ROW][C]10[/C][C]-0.051072[/C][C]-0.3923[/C][C]0.348128[/C][/ROW]
[ROW][C]11[/C][C]0.211135[/C][C]1.6218[/C][C]0.055093[/C][/ROW]
[ROW][C]12[/C][C]0.124479[/C][C]0.9561[/C][C]0.171451[/C][/ROW]
[ROW][C]13[/C][C]-0.047964[/C][C]-0.3684[/C][C]0.356939[/C][/ROW]
[ROW][C]14[/C][C]-0.137397[/C][C]-1.0554[/C][C]0.14778[/C][/ROW]
[ROW][C]15[/C][C]0.048295[/C][C]0.371[/C][C]0.355998[/C][/ROW]
[ROW][C]16[/C][C]-0.001873[/C][C]-0.0144[/C][C]0.494285[/C][/ROW]
[ROW][C]17[/C][C]0.014646[/C][C]0.1125[/C][C]0.455406[/C][/ROW]
[ROW][C]18[/C][C]-0.029755[/C][C]-0.2286[/C][C]0.410003[/C][/ROW]
[ROW][C]19[/C][C]-0.083651[/C][C]-0.6425[/C][C]0.261507[/C][/ROW]
[ROW][C]20[/C][C]-0.150191[/C][C]-1.1536[/C][C]0.126651[/C][/ROW]
[ROW][C]21[/C][C]0.024217[/C][C]0.186[/C][C]0.426534[/C][/ROW]
[ROW][C]22[/C][C]-0.119252[/C][C]-0.916[/C][C]0.1817[/C][/ROW]
[ROW][C]23[/C][C]-0.005344[/C][C]-0.041[/C][C]0.483698[/C][/ROW]
[ROW][C]24[/C][C]0.032611[/C][C]0.2505[/C][C]0.401541[/C][/ROW]
[ROW][C]25[/C][C]0.063837[/C][C]0.4903[/C][C]0.312854[/C][/ROW]
[ROW][C]26[/C][C]0.01069[/C][C]0.0821[/C][C]0.467419[/C][/ROW]
[ROW][C]27[/C][C]0.042662[/C][C]0.3277[/C][C]0.372151[/C][/ROW]
[ROW][C]28[/C][C]0.033824[/C][C]0.2598[/C][C]0.397958[/C][/ROW]
[ROW][C]29[/C][C]0.008521[/C][C]0.0654[/C][C]0.474019[/C][/ROW]
[ROW][C]30[/C][C]-0.01572[/C][C]-0.1207[/C][C]0.452151[/C][/ROW]
[ROW][C]31[/C][C]-0.032925[/C][C]-0.2529[/C][C]0.400611[/C][/ROW]
[ROW][C]32[/C][C]-0.052014[/C][C]-0.3995[/C][C]0.345475[/C][/ROW]
[ROW][C]33[/C][C]0.005897[/C][C]0.0453[/C][C]0.482012[/C][/ROW]
[ROW][C]34[/C][C]-0.109967[/C][C]-0.8447[/C][C]0.200853[/C][/ROW]
[ROW][C]35[/C][C]0.10604[/C][C]0.8145[/C][C]0.209314[/C][/ROW]
[ROW][C]36[/C][C]-0.087442[/C][C]-0.6717[/C][C]0.252213[/C][/ROW]
[/TABLE]
Source: https://freestatistics.org/blog/index.php?pk=35939&T=2

Globally Unique Identifier (entire table): ba.freestatistics.org/blog/index.php?pk=35939&T=2

As an alternative you can also use a QR Code:  

The GUIDs for individual cells are displayed in the table below:

Partial Autocorrelation Function
Time lag kPACF(k)T-STATP-value
1-0.433073-3.32650.000759
2-0.223382-1.71580.04572
3-0.086803-0.66670.253767
4-0.061912-0.47560.318074
50.1329591.02130.155647
6-0.12634-0.97040.167895
70.0356080.27350.392707
80.0796360.61170.271545
9-0.280082-2.15140.017777
10-0.051072-0.39230.348128
110.2111351.62180.055093
120.1244790.95610.171451
13-0.047964-0.36840.356939
14-0.137397-1.05540.14778
150.0482950.3710.355998
16-0.001873-0.01440.494285
170.0146460.11250.455406
18-0.029755-0.22860.410003
19-0.083651-0.64250.261507
20-0.150191-1.15360.126651
210.0242170.1860.426534
22-0.119252-0.9160.1817
23-0.005344-0.0410.483698
240.0326110.25050.401541
250.0638370.49030.312854
260.010690.08210.467419
270.0426620.32770.372151
280.0338240.25980.397958
290.0085210.06540.474019
30-0.01572-0.12070.452151
31-0.032925-0.25290.400611
32-0.052014-0.39950.345475
330.0058970.04530.482012
34-0.109967-0.84470.200853
350.106040.81450.209314
36-0.087442-0.67170.252213


Parameters (Session):
par1 = 36 ; par2 = -0.2 ; par3 = 2 ; par4 = 0 ; par5 = 12 ;
Parameters (R input):
par1 = 36 ; par2 = -0.2 ; par3 = 2 ; par4 = 0 ; par5 = 12 ;
R code (references can be found in the software module):
if (par1 == 'Default') {
par1 = 10*log10(length(x))
} else {
par1 <- as.numeric(par1)
}
par2 <- as.numeric(par2)
par3 <- as.numeric(par3)
par4 <- as.numeric(par4)
par5 <- as.numeric(par5)
if (par2 == 0) {
x <- log(x)
} else {
x <- (x ^ par2 - 1) / par2
}
if (par3 > 0) x <- diff(x,lag=1,difference=par3)
if (par4 > 0) x <- diff(x,lag=par5,difference=par4)
bitmap(file='pic1.png')
racf <- acf(x,par1,main='Autocorrelation',xlab='lags',ylab='ACF')
dev.off()
bitmap(file='pic2.png')
rpacf <- pacf(x,par1,main='Partial Autocorrelation',xlab='lags',ylab='PACF')
dev.off()
(myacf <- c(racf$acf))
(mypacf <- c(rpacf$acf))
lengthx <- length(x)
sqrtn <- sqrt(lengthx)
load(file='createtable')
a<-table.start()
a<-table.row.start(a)
a<-table.element(a,'Autocorrelation Function',4,TRUE)
a<-table.row.end(a)
a<-table.row.start(a)
a<-table.element(a,'Time lag k',header=TRUE)
a<-table.element(a,hyperlink('basics.htm','ACF(k)','click here for more information about the Autocorrelation Function'),header=TRUE)
a<-table.element(a,'T-STAT',header=TRUE)
a<-table.element(a,'P-value',header=TRUE)
a<-table.row.end(a)
for (i in 2:(par1+1)) {
a<-table.row.start(a)
a<-table.element(a,i-1,header=TRUE)
a<-table.element(a,round(myacf[i],6))
mytstat <- myacf[i]*sqrtn
a<-table.element(a,round(mytstat,4))
a<-table.element(a,round(1-pt(abs(mytstat),lengthx),6))
a<-table.row.end(a)
}
a<-table.end(a)
table.save(a,file='mytable.tab')
a<-table.start()
a<-table.row.start(a)
a<-table.element(a,'Partial Autocorrelation Function',4,TRUE)
a<-table.row.end(a)
a<-table.row.start(a)
a<-table.element(a,'Time lag k',header=TRUE)
a<-table.element(a,hyperlink('basics.htm','PACF(k)','click here for more information about the Partial Autocorrelation Function'),header=TRUE)
a<-table.element(a,'T-STAT',header=TRUE)
a<-table.element(a,'P-value',header=TRUE)
a<-table.row.end(a)
for (i in 1:par1) {
a<-table.row.start(a)
a<-table.element(a,i,header=TRUE)
a<-table.element(a,round(mypacf[i],6))
mytstat <- mypacf[i]*sqrtn
a<-table.element(a,round(mytstat,4))
a<-table.element(a,round(1-pt(abs(mytstat),lengthx),6))
a<-table.row.end(a)
}
a<-table.end(a)
table.save(a,file='mytable1.tab')