Free Statistics
of Irreproducible Research!
Description of Statistical Computation | |||||||||||||||||||||||||||||||||||||||||||||||||||
|---|---|---|---|---|---|---|---|---|---|---|---|---|---|---|---|---|---|---|---|---|---|---|---|---|---|---|---|---|---|---|---|---|---|---|---|---|---|---|---|---|---|---|---|---|---|---|---|---|---|---|---|
| Author's title | |||||||||||||||||||||||||||||||||||||||||||||||||||
| Author | *The author of this computation has been verified* | ||||||||||||||||||||||||||||||||||||||||||||||||||
| R Software Module | rwasp_pairs.wasp | ||||||||||||||||||||||||||||||||||||||||||||||||||
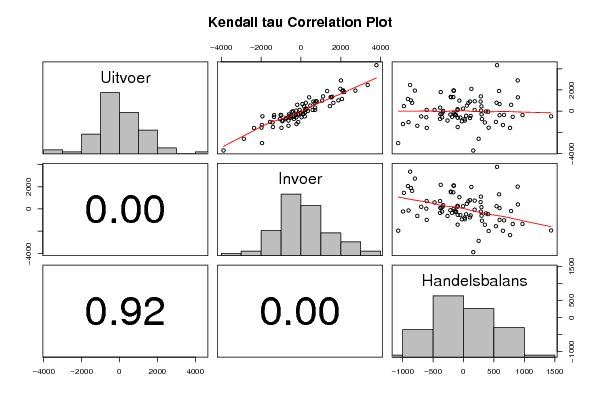
| Title produced by software | Kendall tau Correlation Matrix | ||||||||||||||||||||||||||||||||||||||||||||||||||
| Date of computation | Sun, 21 Dec 2008 19:16:19 -0700 | ||||||||||||||||||||||||||||||||||||||||||||||||||
| Cite this page as follows | Statistical Computations at FreeStatistics.org, Office for Research Development and Education, URL https://freestatistics.org/blog/index.php?v=date/2008/Dec/22/t1229912259c5kbt1ztoaebe26.htm/, Retrieved Sun, 12 May 2024 14:53:08 +0000 | ||||||||||||||||||||||||||||||||||||||||||||||||||
| Statistical Computations at FreeStatistics.org, Office for Research Development and Education, URL https://freestatistics.org/blog/index.php?pk=35929, Retrieved Sun, 12 May 2024 14:53:08 +0000 | |||||||||||||||||||||||||||||||||||||||||||||||||||
| QR Codes: | |||||||||||||||||||||||||||||||||||||||||||||||||||
|
| |||||||||||||||||||||||||||||||||||||||||||||||||||
| Original text written by user: | |||||||||||||||||||||||||||||||||||||||||||||||||||
| IsPrivate? | No (this computation is public) | ||||||||||||||||||||||||||||||||||||||||||||||||||
| User-defined keywords | |||||||||||||||||||||||||||||||||||||||||||||||||||
| Estimated Impact | 199 | ||||||||||||||||||||||||||||||||||||||||||||||||||
Tree of Dependent Computations | |||||||||||||||||||||||||||||||||||||||||||||||||||
| Family? (F = Feedback message, R = changed R code, M = changed R Module, P = changed Parameters, D = changed Data) | |||||||||||||||||||||||||||||||||||||||||||||||||||
| - [Pearson Correlation] [Investigating ass...] [2007-10-22 22:08:56] [8cd6641b921d30ebe00b648d1481bba0] F D [Pearson Correlation] [Correlatie tussen...] [2008-10-21 00:01:19] [504b73e6de93b01331326637b3288ad4] F D [Pearson Correlation] [Correlatie tussen...] [2008-10-21 00:32:08] [504b73e6de93b01331326637b3288ad4] - RM D [Kendall tau Correlation Matrix] [Kendall Tau] [2008-12-21 16:24:43] [504b73e6de93b01331326637b3288ad4] - D [Kendall tau Correlation Matrix] [Kendall Tau na di...] [2008-12-22 02:16:19] [ba85d9d0a82357dd3edf208eef933423] [Current] | |||||||||||||||||||||||||||||||||||||||||||||||||||
| Feedback Forum | |||||||||||||||||||||||||||||||||||||||||||||||||||
Post a new message | |||||||||||||||||||||||||||||||||||||||||||||||||||
Dataset | |||||||||||||||||||||||||||||||||||||||||||||||||||
| Dataseries X: | |||||||||||||||||||||||||||||||||||||||||||||||||||
450,7 156,5 294,2 -378 -1346,9 968,9 -502,8 193,2 -696 790,1 247,5 542,6 14,5 349,5 -335 -156,5 5,4 -161,9 1900,3 1316,7 583,6 -961,2 -934 -27,2 -582 30,2 -612,2 993,6 1062,6 -69 -892,5 -628,7 -263,8 1395,5 1110,3 285,2 111,5 588,2 -476,7 -754,8 -1056,9 302,1 469,5 1450,7 -981,2 -306,7 -602,7 296 42 -244,4 286,4 -381,1 -259,7 -121,4 -27 -393,6 366,6 -653,4 -758,8 105,4 904,9 798,4 106,5 -285 97,2 -382,2 -457,5 -573,8 116,3 901,6 621,8 279,8 -738,8 -352,1 -386,7 115,1 -66,5 181,6 1302,8 410 892,8 -1387 -626,9 -760,1 766,3 687,3 79 1325,1 1493,5 -168,4 -897 -919 22 -545,4 -357 -188,4 1937,4 2736,9 -799,5 -1589,8 -2354,7 764,9 1351,8 1562,6 -210,8 -623,2 -526,8 -96,4 -394,1 -986,3 592,2 1306 1510,3 -204,3 -608,1 -555,9 -52,2 -435,5 -477,7 42,2 -130,1 212,9 -343 -58,2 -461,7 403,5 239,7 247,7 -8 329,8 715 -385,2 -1073,1 -1423,6 350,5 -370,7 -239,2 -131,5 929,8 746,4 183,4 103,8 204,2 -100,4 -1504,4 -1407,7 -96,7 1795,2 2170,2 -375 -333,8 -116,4 -217,4 188,4 286,2 -97,8 -356,1 -1021,8 665,7 780,7 1626 -845,3 -2617,6 -2865,9 248,3 2898,8 2008,7 890,1 -1021,2 -1552,8 531,6 107,9 714,6 -606,7 -293 -150,9 -142,1 -761,3 -778,2 16,9 1923,1 2083,6 -160,5 -1314,5 -1962,2 647,7 -1568 -1980,7 412,7 2105,6 1977 128,6 -586,4 -234,8 -351,6 -544,1 -1351,9 807,8 1146,4 2061,2 -914,8 -1041 -136,9 -904,1 665,4 73,1 592,3 1016,3 1882,5 -866,2 -495,3 -1934,7 1439,4 -1221 -226,1 -994,9 1957,4 2120,8 -163,4 -1585,4 -979,9 -605,5 -245,8 116,3 -362,1 2472,7 3350,8 -878,1 595 -186,8 781,8 -3027,6 -1953,3 -1074,3 4341,4 3791,1 550,3 -3726,1 -3885,9 159,8 522,3 468,5 53,8 | |||||||||||||||||||||||||||||||||||||||||||||||||||
Tables (Output of Computation) | |||||||||||||||||||||||||||||||||||||||||||||||||||
| |||||||||||||||||||||||||||||||||||||||||||||||||||
Figures (Output of Computation) | |||||||||||||||||||||||||||||||||||||||||||||||||||
Input Parameters & R Code | |||||||||||||||||||||||||||||||||||||||||||||||||||
| Parameters (Session): | |||||||||||||||||||||||||||||||||||||||||||||||||||
| Parameters (R input): | |||||||||||||||||||||||||||||||||||||||||||||||||||
| R code (references can be found in the software module): | |||||||||||||||||||||||||||||||||||||||||||||||||||
panel.tau <- function(x, y, digits=2, prefix='', cex.cor) | |||||||||||||||||||||||||||||||||||||||||||||||||||