Free Statistics
of Irreproducible Research!
Description of Statistical Computation | |||||||||||||||||||||||||||||||||||||||||||||||||||
|---|---|---|---|---|---|---|---|---|---|---|---|---|---|---|---|---|---|---|---|---|---|---|---|---|---|---|---|---|---|---|---|---|---|---|---|---|---|---|---|---|---|---|---|---|---|---|---|---|---|---|---|
| Author's title | |||||||||||||||||||||||||||||||||||||||||||||||||||
| Author | *The author of this computation has been verified* | ||||||||||||||||||||||||||||||||||||||||||||||||||
| R Software Module | rwasp_pairs.wasp | ||||||||||||||||||||||||||||||||||||||||||||||||||
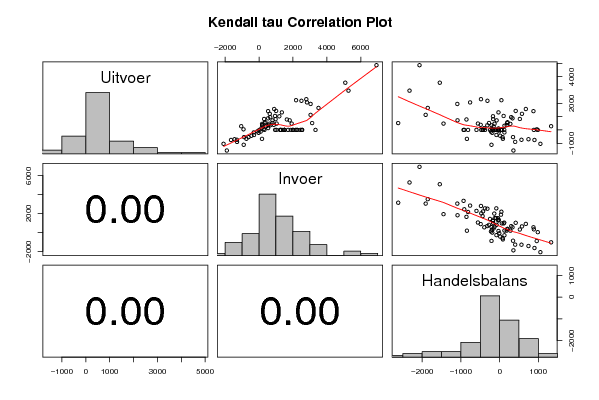
| Title produced by software | Kendall tau Correlation Matrix | ||||||||||||||||||||||||||||||||||||||||||||||||||
| Date of computation | Sun, 21 Dec 2008 19:08:59 -0700 | ||||||||||||||||||||||||||||||||||||||||||||||||||
| Cite this page as follows | Statistical Computations at FreeStatistics.org, Office for Research Development and Education, URL https://freestatistics.org/blog/index.php?v=date/2008/Dec/22/t1229911900quefjlyrxymdmm4.htm/, Retrieved Sun, 12 May 2024 23:53:17 +0000 | ||||||||||||||||||||||||||||||||||||||||||||||||||
| Statistical Computations at FreeStatistics.org, Office for Research Development and Education, URL https://freestatistics.org/blog/index.php?pk=35927, Retrieved Sun, 12 May 2024 23:53:17 +0000 | |||||||||||||||||||||||||||||||||||||||||||||||||||
| QR Codes: | |||||||||||||||||||||||||||||||||||||||||||||||||||
|
| |||||||||||||||||||||||||||||||||||||||||||||||||||
| Original text written by user: | |||||||||||||||||||||||||||||||||||||||||||||||||||
| IsPrivate? | No (this computation is public) | ||||||||||||||||||||||||||||||||||||||||||||||||||
| User-defined keywords | |||||||||||||||||||||||||||||||||||||||||||||||||||
| Estimated Impact | 187 | ||||||||||||||||||||||||||||||||||||||||||||||||||
Tree of Dependent Computations | |||||||||||||||||||||||||||||||||||||||||||||||||||
| Family? (F = Feedback message, R = changed R code, M = changed R Module, P = changed Parameters, D = changed Data) | |||||||||||||||||||||||||||||||||||||||||||||||||||
| - [Pearson Correlation] [Investigating ass...] [2007-10-22 22:08:56] [8cd6641b921d30ebe00b648d1481bba0] F D [Pearson Correlation] [Correlatie tussen...] [2008-10-21 00:01:19] [504b73e6de93b01331326637b3288ad4] F D [Pearson Correlation] [Correlatie tussen...] [2008-10-21 00:32:08] [504b73e6de93b01331326637b3288ad4] - RM D [Kendall tau Correlation Matrix] [Kendall Tau] [2008-12-21 16:24:43] [504b73e6de93b01331326637b3288ad4] - D [Kendall tau Correlation Matrix] [Kendall Tau na di...] [2008-12-22 02:08:59] [ba85d9d0a82357dd3edf208eef933423] [Current] | |||||||||||||||||||||||||||||||||||||||||||||||||||
| Feedback Forum | |||||||||||||||||||||||||||||||||||||||||||||||||||
Post a new message | |||||||||||||||||||||||||||||||||||||||||||||||||||
Dataset | |||||||||||||||||||||||||||||||||||||||||||||||||||
| Dataseries X: | |||||||||||||||||||||||||||||||||||||||||||||||||||
-1113,4 -902,4 -211 -662,7 -745,9 83,2 -1040,7 -2092,8 1052,1 -1543,5 -1899,6 356,1 -753,4 -1652,1 898,7 -738,9 -1302,6 563,7 -895 -1297,2 401,8 1.005 19,5 985,4 44 -914,5 958,2 -538 -884,3 346 455 178,3 277 -437 -450,4 13,2 958 659,9 298,4 1.070 1248,1 -178,3 315 191,2 123,8 785 1641,9 -857,4 478 1039,2 -561,4 520 794,8 -275 139 535,1 -396,4 112 141,5 -29,8 -542 -617,3 75,6 363 181,1 182,1 78 278,3 -200,1 -379 -295,5 -83,8 522 326,3 196 -217 -25,8 -190,7 -101 -92,3 -9,1 1.201 317,7 883,7 -186 -309,2 123,6 581 378,1 202,6 1.906 1871,6 34,2 1.009 952,6 56,2 463 595,6 -132,2 2.401 3332,5 -931,7 811 977,8 -166,8 2.163 2540,4 -377,6 1.540 2013,6 -474 1.146 1027,3 118,2 2.452 2537,6 -86,1 1.843 1981,7 -138,3 1.408 1504 -96,1 1.278 1716,9 -439,1 1.220 1255,2 -35,6 1.459 1502,9 -43,6 1.789 2217,9 -428,8 716 794,3 -78,3 345 555,1 -209,8 1.275 1301,5 -26,4 1.379 1505,7 -126,8 -126 98 -223,5 1.670 2268,2 -598,5 1.336 2151,8 -815,9 1.524 2438 -913,7 1.168 1416,2 -248 1948,9 3042,2 -1093,3 -668,7 176,3 -845 2230,1 2185 45,1 1208,9 632,2 576,7 1316,8 1346,8 -30 1023,8 1195,9 -172,1 262,5 417,7 -155,2 2185,6 2501,3 -315,7 871,1 539,1 332 -696,9 -1441,6 744,7 1408,7 535,4 873,3 822,3 300,6 521,7 278,2 -1051,3 1329,5 1424,6 1009,9 414,7 383,6 873 -489,4 1049 946,1 102,9 2065,3 2828,6 -763,3 1570 893,9 676,1 349 667,8 -318,8 2306,4 2788,6 -482,2 721 1808,7 -1087,7 475,2 1925 -1449,8 2947,9 5275,8 -2327,9 3542,9 5089 -1546,1 515,3 3135,7 -2620,4 4856,7 6926,8 -2070,1 1130,6 3040,9 -1910,3 1652,9 3509,4 -1856,5 | |||||||||||||||||||||||||||||||||||||||||||||||||||
Tables (Output of Computation) | |||||||||||||||||||||||||||||||||||||||||||||||||||
| |||||||||||||||||||||||||||||||||||||||||||||||||||
Figures (Output of Computation) | |||||||||||||||||||||||||||||||||||||||||||||||||||
Input Parameters & R Code | |||||||||||||||||||||||||||||||||||||||||||||||||||
| Parameters (Session): | |||||||||||||||||||||||||||||||||||||||||||||||||||
| Parameters (R input): | |||||||||||||||||||||||||||||||||||||||||||||||||||
| R code (references can be found in the software module): | |||||||||||||||||||||||||||||||||||||||||||||||||||
panel.tau <- function(x, y, digits=2, prefix='', cex.cor) | |||||||||||||||||||||||||||||||||||||||||||||||||||