Free Statistics

of Irreproducible Research!

Author's title

Author*The author of this computation has been verified*
R Software Modulerwasp_smp.wasp
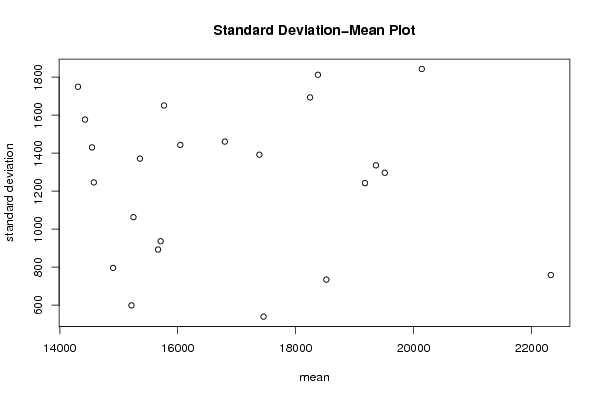
Title produced by softwareStandard Deviation-Mean Plot
Date of computationSun, 21 Dec 2008 16:14:56 -0700
Cite this page as followsStatistical Computations at FreeStatistics.org, Office for Research Development and Education, URL https://freestatistics.org/blog/index.php?v=date/2008/Dec/22/t1229901332x2cpekribz8qlvq.htm/, Retrieved Sun, 12 May 2024 22:40:17 +0000
Statistical Computations at FreeStatistics.org, Office for Research Development and Education, URL https://freestatistics.org/blog/index.php?pk=35905, Retrieved Sun, 12 May 2024 22:40:17 +0000
QR Codes:

Original text written by user:
IsPrivate?No (this computation is public)
User-defined keywords
Estimated Impact172
Family? (F = Feedback message, R = changed R code, M = changed R Module, P = changed Parameters, D = changed Data)
-       [Standard Deviation-Mean Plot] [SD Mean plot Uitvoer] [2008-12-21 23:14:56] [ba85d9d0a82357dd3edf208eef933423] [Current]
Feedback Forum

Post a new message
Dataseries X:
15916,4
16535,9
15796
14418,6
15044,5
14944,2
16754,8
14254
15454,9
15644,8
14568,3
12520,2
14803
15873,2
14755,3
12875,1
14291,1
14205,3
15859,4
15258,9
15498,6
15106,5
15023,6
12083
15761,3
16943
15070,3
13659,6
14768,9
14725,1
15998,1
15370,6
14956,9
15469,7
15101,8
11703,7
16283,6
16726,5
14968,9
14861
14583,3
15305,8
17903,9
16379,4
15420,3
17870,5
15912,8
13866,5
17823,2
17872
17420,4
16704,4
15991,2
16583,6
19123,5
17838,7
17209,4
18586,5
16258,1
15141,6
19202,1
17746,5
19090,1
18040,3
17515,5
17751,8
21072,4
17170
19439,5
19795,4
17574,9
16165,4
19464,6
19932,1
19961,2
17343,4
18924,2
18574,1
21350,6
18594,6
19823,1
20844,4
19640,2
17735,4
19813,6
22238,5
20682,2
17818,6
21872,1
22117
21865,9
23451,3
20953,7
22497,3


Summary of computational transaction
Raw Inputview raw input (R code)
Raw Outputview raw output of R engine
Computing time1 seconds
R Server'George Udny Yule' @ 72.249.76.132

\begin{tabular}{lllllllll}
\hline
Summary of computational transaction \tabularnewline
Raw Input & view raw input (R code)  \tabularnewline
Raw Output & view raw output of R engine  \tabularnewline
Computing time & 1 seconds \tabularnewline
R Server & 'George Udny Yule' @ 72.249.76.132 \tabularnewline
\hline
\end{tabular}
%Source: https://freestatistics.org/blog/index.php?pk=35905&T=0

[TABLE]
[ROW][C]Summary of computational transaction[/C][/ROW]
[ROW][C]Raw Input[/C][C]view raw input (R code) [/C][/ROW]
[ROW][C]Raw Output[/C][C]view raw output of R engine [/C][/ROW]
[ROW][C]Computing time[/C][C]1 seconds[/C][/ROW]
[ROW][C]R Server[/C][C]'George Udny Yule' @ 72.249.76.132[/C][/ROW]
[/TABLE]
Source: https://freestatistics.org/blog/index.php?pk=35905&T=0

Globally Unique Identifier (entire table): ba.freestatistics.org/blog/index.php?pk=35905&T=0

As an alternative you can also use a QR Code:  

The GUIDs for individual cells are displayed in the table below:

Summary of computational transaction
Raw Inputview raw input (R code)
Raw Outputview raw output of R engine
Computing time1 seconds
R Server'George Udny Yule' @ 72.249.76.132


Standard Deviation-Mean Plot
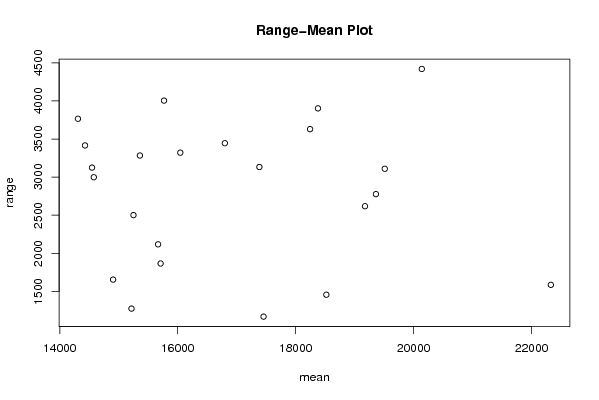
SectionMeanStandard DeviationRange
115666.725892.9969816111742117.3
215249.3751063.356535927632500.8
314547.051430.363493428623124.6
414576.651246.256320612522998.1
514903.675796.3606485129711654.1
614427.9251576.949687159783415.6
715358.551371.399349812693283.4
815215.675599.0165182753031273
914308.0251749.582333729973766
1015710936.71757038431865.5
1116043.11443.410505250213320.6
1215767.5251651.067324238074004
1317455539.7708649664841167.60000000000
1417384.251392.018209890473132.3
1516798.91460.950825090753444.9
1618519.75734.5494106366611455.6
1718377.4251812.464871153833902.4
1818243.81693.550001230163630
1919175.3251242.301244666532617.8
2019360.8751336.149056991772776.5
2119510.7751296.766461562503109
2220138.2251843.285599818984419.9
2322326.575758.8800931855661585.40000000000

\begin{tabular}{lllllllll}
\hline
Standard Deviation-Mean Plot \tabularnewline
Section & Mean & Standard Deviation & Range \tabularnewline
1 & 15666.725 & 892.996981611174 & 2117.3 \tabularnewline
2 & 15249.375 & 1063.35653592763 & 2500.8 \tabularnewline
3 & 14547.05 & 1430.36349342862 & 3124.6 \tabularnewline
4 & 14576.65 & 1246.25632061252 & 2998.1 \tabularnewline
5 & 14903.675 & 796.360648512971 & 1654.1 \tabularnewline
6 & 14427.925 & 1576.94968715978 & 3415.6 \tabularnewline
7 & 15358.55 & 1371.39934981269 & 3283.4 \tabularnewline
8 & 15215.675 & 599.016518275303 & 1273 \tabularnewline
9 & 14308.025 & 1749.58233372997 & 3766 \tabularnewline
10 & 15710 & 936.7175703843 & 1865.5 \tabularnewline
11 & 16043.1 & 1443.41050525021 & 3320.6 \tabularnewline
12 & 15767.525 & 1651.06732423807 & 4004 \tabularnewline
13 & 17455 & 539.770864966484 & 1167.60000000000 \tabularnewline
14 & 17384.25 & 1392.01820989047 & 3132.3 \tabularnewline
15 & 16798.9 & 1460.95082509075 & 3444.9 \tabularnewline
16 & 18519.75 & 734.549410636661 & 1455.6 \tabularnewline
17 & 18377.425 & 1812.46487115383 & 3902.4 \tabularnewline
18 & 18243.8 & 1693.55000123016 & 3630 \tabularnewline
19 & 19175.325 & 1242.30124466653 & 2617.8 \tabularnewline
20 & 19360.875 & 1336.14905699177 & 2776.5 \tabularnewline
21 & 19510.775 & 1296.76646156250 & 3109 \tabularnewline
22 & 20138.225 & 1843.28559981898 & 4419.9 \tabularnewline
23 & 22326.575 & 758.880093185566 & 1585.40000000000 \tabularnewline
\hline
\end{tabular}
%Source: https://freestatistics.org/blog/index.php?pk=35905&T=1

[TABLE]
[ROW][C]Standard Deviation-Mean Plot[/C][/ROW]
[ROW][C]Section[/C][C]Mean[/C][C]Standard Deviation[/C][C]Range[/C][/ROW]
[ROW][C]1[/C][C]15666.725[/C][C]892.996981611174[/C][C]2117.3[/C][/ROW]
[ROW][C]2[/C][C]15249.375[/C][C]1063.35653592763[/C][C]2500.8[/C][/ROW]
[ROW][C]3[/C][C]14547.05[/C][C]1430.36349342862[/C][C]3124.6[/C][/ROW]
[ROW][C]4[/C][C]14576.65[/C][C]1246.25632061252[/C][C]2998.1[/C][/ROW]
[ROW][C]5[/C][C]14903.675[/C][C]796.360648512971[/C][C]1654.1[/C][/ROW]
[ROW][C]6[/C][C]14427.925[/C][C]1576.94968715978[/C][C]3415.6[/C][/ROW]
[ROW][C]7[/C][C]15358.55[/C][C]1371.39934981269[/C][C]3283.4[/C][/ROW]
[ROW][C]8[/C][C]15215.675[/C][C]599.016518275303[/C][C]1273[/C][/ROW]
[ROW][C]9[/C][C]14308.025[/C][C]1749.58233372997[/C][C]3766[/C][/ROW]
[ROW][C]10[/C][C]15710[/C][C]936.7175703843[/C][C]1865.5[/C][/ROW]
[ROW][C]11[/C][C]16043.1[/C][C]1443.41050525021[/C][C]3320.6[/C][/ROW]
[ROW][C]12[/C][C]15767.525[/C][C]1651.06732423807[/C][C]4004[/C][/ROW]
[ROW][C]13[/C][C]17455[/C][C]539.770864966484[/C][C]1167.60000000000[/C][/ROW]
[ROW][C]14[/C][C]17384.25[/C][C]1392.01820989047[/C][C]3132.3[/C][/ROW]
[ROW][C]15[/C][C]16798.9[/C][C]1460.95082509075[/C][C]3444.9[/C][/ROW]
[ROW][C]16[/C][C]18519.75[/C][C]734.549410636661[/C][C]1455.6[/C][/ROW]
[ROW][C]17[/C][C]18377.425[/C][C]1812.46487115383[/C][C]3902.4[/C][/ROW]
[ROW][C]18[/C][C]18243.8[/C][C]1693.55000123016[/C][C]3630[/C][/ROW]
[ROW][C]19[/C][C]19175.325[/C][C]1242.30124466653[/C][C]2617.8[/C][/ROW]
[ROW][C]20[/C][C]19360.875[/C][C]1336.14905699177[/C][C]2776.5[/C][/ROW]
[ROW][C]21[/C][C]19510.775[/C][C]1296.76646156250[/C][C]3109[/C][/ROW]
[ROW][C]22[/C][C]20138.225[/C][C]1843.28559981898[/C][C]4419.9[/C][/ROW]
[ROW][C]23[/C][C]22326.575[/C][C]758.880093185566[/C][C]1585.40000000000[/C][/ROW]
[/TABLE]
Source: https://freestatistics.org/blog/index.php?pk=35905&T=1

Globally Unique Identifier (entire table): ba.freestatistics.org/blog/index.php?pk=35905&T=1

As an alternative you can also use a QR Code:  

The GUIDs for individual cells are displayed in the table below:

Standard Deviation-Mean Plot
SectionMeanStandard DeviationRange
115666.725892.9969816111742117.3
215249.3751063.356535927632500.8
314547.051430.363493428623124.6
414576.651246.256320612522998.1
514903.675796.3606485129711654.1
614427.9251576.949687159783415.6
715358.551371.399349812693283.4
815215.675599.0165182753031273
914308.0251749.582333729973766
1015710936.71757038431865.5
1116043.11443.410505250213320.6
1215767.5251651.067324238074004
1317455539.7708649664841167.60000000000
1417384.251392.018209890473132.3
1516798.91460.950825090753444.9
1618519.75734.5494106366611455.6
1718377.4251812.464871153833902.4
1818243.81693.550001230163630
1919175.3251242.301244666532617.8
2019360.8751336.149056991772776.5
2119510.7751296.766461562503109
2220138.2251843.285599818984419.9
2322326.575758.8800931855661585.40000000000


Regression: S.E.(k) = alpha + beta * Mean(k)
alpha1316.93480181557
beta-0.00365320934627757
S.D.0.0393558756641029
T-STAT-0.0928250047707544
p-value0.926922461489622

\begin{tabular}{lllllllll}
\hline
Regression: S.E.(k) = alpha + beta * Mean(k) \tabularnewline
alpha & 1316.93480181557 \tabularnewline
beta & -0.00365320934627757 \tabularnewline
S.D. & 0.0393558756641029 \tabularnewline
T-STAT & -0.0928250047707544 \tabularnewline
p-value & 0.926922461489622 \tabularnewline
\hline
\end{tabular}
%Source: https://freestatistics.org/blog/index.php?pk=35905&T=2

[TABLE]
[ROW][C]Regression: S.E.(k) = alpha + beta * Mean(k)[/C][/ROW]
[ROW][C]alpha[/C][C]1316.93480181557[/C][/ROW]
[ROW][C]beta[/C][C]-0.00365320934627757[/C][/ROW]
[ROW][C]S.D.[/C][C]0.0393558756641029[/C][/ROW]
[ROW][C]T-STAT[/C][C]-0.0928250047707544[/C][/ROW]
[ROW][C]p-value[/C][C]0.926922461489622[/C][/ROW]
[/TABLE]
Source: https://freestatistics.org/blog/index.php?pk=35905&T=2

Globally Unique Identifier (entire table): ba.freestatistics.org/blog/index.php?pk=35905&T=2

As an alternative you can also use a QR Code:  

The GUIDs for individual cells are displayed in the table below:

Regression: S.E.(k) = alpha + beta * Mean(k)
alpha1316.93480181557
beta-0.00365320934627757
S.D.0.0393558756641029
T-STAT-0.0928250047707544
p-value0.926922461489622


Regression: ln S.E.(k) = alpha + beta * ln Mean(k)
alpha8.08188756602598
beta-0.103135244696595
S.D.0.6250218303053
T-STAT-0.165010627942735
p-value0.870513718256071
Lambda1.10313524469660

\begin{tabular}{lllllllll}
\hline
Regression: ln S.E.(k) = alpha + beta * ln Mean(k) \tabularnewline
alpha & 8.08188756602598 \tabularnewline
beta & -0.103135244696595 \tabularnewline
S.D. & 0.6250218303053 \tabularnewline
T-STAT & -0.165010627942735 \tabularnewline
p-value & 0.870513718256071 \tabularnewline
Lambda & 1.10313524469660 \tabularnewline
\hline
\end{tabular}
%Source: https://freestatistics.org/blog/index.php?pk=35905&T=3

[TABLE]
[ROW][C]Regression: ln S.E.(k) = alpha + beta * ln Mean(k)[/C][/ROW]
[ROW][C]alpha[/C][C]8.08188756602598[/C][/ROW]
[ROW][C]beta[/C][C]-0.103135244696595[/C][/ROW]
[ROW][C]S.D.[/C][C]0.6250218303053[/C][/ROW]
[ROW][C]T-STAT[/C][C]-0.165010627942735[/C][/ROW]
[ROW][C]p-value[/C][C]0.870513718256071[/C][/ROW]
[ROW][C]Lambda[/C][C]1.10313524469660[/C][/ROW]
[/TABLE]
Source: https://freestatistics.org/blog/index.php?pk=35905&T=3

Globally Unique Identifier (entire table): ba.freestatistics.org/blog/index.php?pk=35905&T=3

As an alternative you can also use a QR Code:  

The GUIDs for individual cells are displayed in the table below:

Regression: ln S.E.(k) = alpha + beta * ln Mean(k)
alpha8.08188756602598
beta-0.103135244696595
S.D.0.6250218303053
T-STAT-0.165010627942735
p-value0.870513718256071
Lambda1.10313524469660


Parameters (Session):
par1 = 4 ;
Parameters (R input):
par1 = 4 ;
R code (references can be found in the software module):
par1 <- as.numeric(par1)
(n <- length(x))
(np <- floor(n / par1))
arr <- array(NA,dim=c(par1,np))
j <- 0
k <- 1
for (i in 1:(np*par1))
{
j = j + 1
arr[j,k] <- x[i]
if (j == par1) {
j = 0
k=k+1
}
}
arr
arr.mean <- array(NA,dim=np)
arr.sd <- array(NA,dim=np)
arr.range <- array(NA,dim=np)
for (j in 1:np)
{
arr.mean[j] <- mean(arr[,j],na.rm=TRUE)
arr.sd[j] <- sd(arr[,j],na.rm=TRUE)
arr.range[j] <- max(arr[,j],na.rm=TRUE) - min(arr[,j],na.rm=TRUE)
}
arr.mean
arr.sd
arr.range
(lm1 <- lm(arr.sd~arr.mean))
(lnlm1 <- lm(log(arr.sd)~log(arr.mean)))
(lm2 <- lm(arr.range~arr.mean))
bitmap(file='test1.png')
plot(arr.mean,arr.sd,main='Standard Deviation-Mean Plot',xlab='mean',ylab='standard deviation')
dev.off()
bitmap(file='test2.png')
plot(arr.mean,arr.range,main='Range-Mean Plot',xlab='mean',ylab='range')
dev.off()
load(file='createtable')
a<-table.start()
a<-table.row.start(a)
a<-table.element(a,'Standard Deviation-Mean Plot',4,TRUE)
a<-table.row.end(a)
a<-table.row.start(a)
a<-table.element(a,'Section',header=TRUE)
a<-table.element(a,'Mean',header=TRUE)
a<-table.element(a,'Standard Deviation',header=TRUE)
a<-table.element(a,'Range',header=TRUE)
a<-table.row.end(a)
for (j in 1:np) {
a<-table.row.start(a)
a<-table.element(a,j,header=TRUE)
a<-table.element(a,arr.mean[j])
a<-table.element(a,arr.sd[j] )
a<-table.element(a,arr.range[j] )
a<-table.row.end(a)
}
a<-table.end(a)
table.save(a,file='mytable.tab')
a<-table.start()
a<-table.row.start(a)
a<-table.element(a,'Regression: S.E.(k) = alpha + beta * Mean(k)',2,TRUE)
a<-table.row.end(a)
a<-table.row.start(a)
a<-table.element(a,'alpha',header=TRUE)
a<-table.element(a,lm1$coefficients[[1]])
a<-table.row.end(a)
a<-table.row.start(a)
a<-table.element(a,'beta',header=TRUE)
a<-table.element(a,lm1$coefficients[[2]])
a<-table.row.end(a)
a<-table.row.start(a)
a<-table.element(a,'S.D.',header=TRUE)
a<-table.element(a,summary(lm1)$coefficients[2,2])
a<-table.row.end(a)
a<-table.row.start(a)
a<-table.element(a,'T-STAT',header=TRUE)
a<-table.element(a,summary(lm1)$coefficients[2,3])
a<-table.row.end(a)
a<-table.row.start(a)
a<-table.element(a,'p-value',header=TRUE)
a<-table.element(a,summary(lm1)$coefficients[2,4])
a<-table.row.end(a)
a<-table.end(a)
table.save(a,file='mytable1.tab')
a<-table.start()
a<-table.row.start(a)
a<-table.element(a,'Regression: ln S.E.(k) = alpha + beta * ln Mean(k)',2,TRUE)
a<-table.row.end(a)
a<-table.row.start(a)
a<-table.element(a,'alpha',header=TRUE)
a<-table.element(a,lnlm1$coefficients[[1]])
a<-table.row.end(a)
a<-table.row.start(a)
a<-table.element(a,'beta',header=TRUE)
a<-table.element(a,lnlm1$coefficients[[2]])
a<-table.row.end(a)
a<-table.row.start(a)
a<-table.element(a,'S.D.',header=TRUE)
a<-table.element(a,summary(lnlm1)$coefficients[2,2])
a<-table.row.end(a)
a<-table.row.start(a)
a<-table.element(a,'T-STAT',header=TRUE)
a<-table.element(a,summary(lnlm1)$coefficients[2,3])
a<-table.row.end(a)
a<-table.row.start(a)
a<-table.element(a,'p-value',header=TRUE)
a<-table.element(a,summary(lnlm1)$coefficients[2,4])
a<-table.row.end(a)
a<-table.row.start(a)
a<-table.element(a,'Lambda',header=TRUE)
a<-table.element(a,1-lnlm1$coefficients[[2]])
a<-table.row.end(a)
a<-table.end(a)
table.save(a,file='mytable2.tab')