Free Statistics

of Irreproducible Research!

Author's title

Author*Unverified author*
R Software Modulerwasp_arimaforecasting.wasp
Title produced by softwareARIMA Forecasting
Date of computationSun, 21 Dec 2008 15:59:46 -0700
Cite this page as followsStatistical Computations at FreeStatistics.org, Office for Research Development and Education, URL https://freestatistics.org/blog/index.php?v=date/2008/Dec/22/t1229900683j8du6kw6rqm3737.htm/, Retrieved Mon, 13 May 2024 05:01:44 +0000
Statistical Computations at FreeStatistics.org, Office for Research Development and Education, URL https://freestatistics.org/blog/index.php?pk=35901, Retrieved Mon, 13 May 2024 05:01:44 +0000
QR Codes:

Original text written by user:
IsPrivate?No (this computation is public)
User-defined keywords
Estimated Impact207
Family? (F = Feedback message, R = changed R code, M = changed R Module, P = changed Parameters, D = changed Data)
F     [Variance Reduction Matrix] [Q2 VRM] [2008-12-07 13:38:56] [74be16979710d4c4e7c6647856088456]
F RMP   [(Partial) Autocorrelation Function] [Q2 ACF 00] [2008-12-07 13:48:21] [74be16979710d4c4e7c6647856088456]
F   P     [(Partial) Autocorrelation Function] [Q2 ACF 10] [2008-12-07 14:03:41] [74be16979710d4c4e7c6647856088456]
F   P       [(Partial) Autocorrelation Function] [Q2 ACF 11] [2008-12-07 14:10:14] [74be16979710d4c4e7c6647856088456]
- R PD        [(Partial) Autocorrelation Function] [] [2008-12-21 21:47:34] [74be16979710d4c4e7c6647856088456]
F RMPD            [ARIMA Forecasting] [] [2008-12-21 22:59:46] [d41d8cd98f00b204e9800998ecf8427e] [Current]
Feedback Forum
2009-01-08 13:11:26 [Aurélie Van Impe] [reply
Bij de p-waarde had je nog kunnen zeggen dat indien de p-waarde groter is dan 0.05, dan is het verschil NIET significant, dit is dus de bedoeling, want dan ligt je voorspelling dicht bij de werkelijke waarde. Als ze dus kleiner is dan 0.05 is je voorspelling niet goed. Hoe groter hoe beter dus.

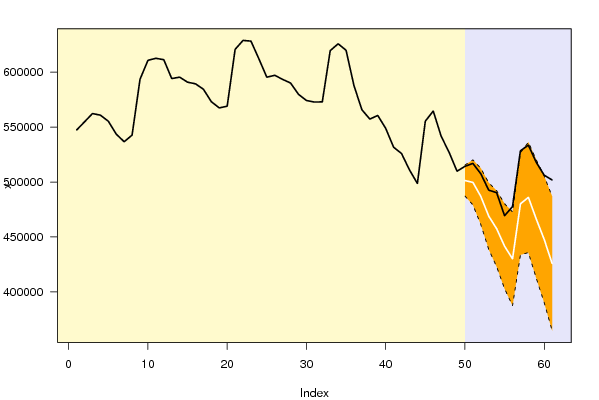
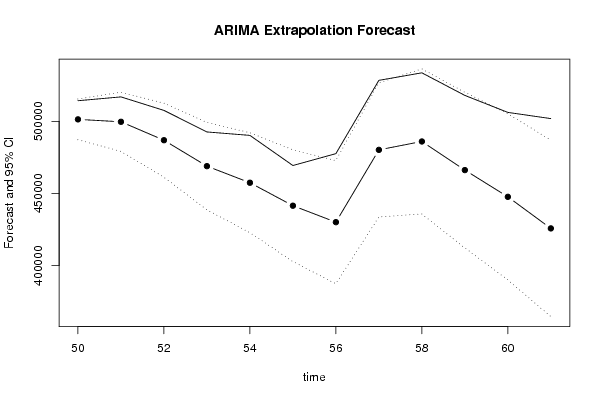
Wat het feit betreft dat de kans dat je gestegen bent ten opzichte van een bepaalde periode zeer klein is, kon je vermelden dat dit logisch is. Je bent inderdaad niet gestegen, omdat de grafiek een dalende trend volgde. De voorspelling heeft deze dalende trend gewoon gevolgd, dus is het logisch dat die niet plots gaat stijgen. Het is nog net een goed model, maar het is een randgeval, aangezien het betrouwbaarheidsinterval zo vaak wordt overschreden. Ook zie je dat de witte en de zwarte lijn steeds verder en verder uit mekaar liggen, ze exploderen min of meer. Dit is niet zo goed, maar wel logisch ergens. Immers, hoe verder in de toekomst je wil voorspellen, hoe moeilijker het is, omdat je geen rekening kan houden met externe factoren. Dit heb je wel vermeld bij de volgende tabel. Over de PE had je nog kunnen zeggen dat het best is dat deze kleiner is dan de procentuele SE. Dit is niet overal het geval, namelijk in de maanden die je eerder vermeldde, waar het betrouwbaarheidsinterval overschreden wordt. Je conclusie is bijgevolg correct dat het voorspellingmodel niet bijster goed is.

Post a new message
Dataseries X:
547344
554788
562325
560854
555332
543599
536662
542722
593530
610763
612613
611324
594167
595454
590865
589379
584428
573100
567456
569028
620735
628884
628232
612117
595404
597141
593408
590072
579799
574205
572775
572942
619567
625809
619916
587625
565742
557274
560576
548854
531673
525919
511038
498662
555362
564591
541657
527070
509846
514258
516922
507561
492622
490243
469357
477580
528379
533590
517945
506174
501866


Summary of computational transaction
Raw Inputview raw input (R code)
Raw Outputview raw output of R engine
Computing time5 seconds
R Server'Herman Ole Andreas Wold' @ 193.190.124.10:1001

\begin{tabular}{lllllllll}
\hline
Summary of computational transaction \tabularnewline
Raw Input & view raw input (R code)  \tabularnewline
Raw Output & view raw output of R engine  \tabularnewline
Computing time & 5 seconds \tabularnewline
R Server & 'Herman Ole Andreas Wold' @ 193.190.124.10:1001 \tabularnewline
\hline
\end{tabular}
%Source: https://freestatistics.org/blog/index.php?pk=35901&T=0

[TABLE]
[ROW][C]Summary of computational transaction[/C][/ROW]
[ROW][C]Raw Input[/C][C]view raw input (R code) [/C][/ROW]
[ROW][C]Raw Output[/C][C]view raw output of R engine [/C][/ROW]
[ROW][C]Computing time[/C][C]5 seconds[/C][/ROW]
[ROW][C]R Server[/C][C]'Herman Ole Andreas Wold' @ 193.190.124.10:1001[/C][/ROW]
[/TABLE]
Source: https://freestatistics.org/blog/index.php?pk=35901&T=0

Globally Unique Identifier (entire table): ba.freestatistics.org/blog/index.php?pk=35901&T=0

As an alternative you can also use a QR Code:  

The GUIDs for individual cells are displayed in the table below:

Summary of computational transaction
Raw Inputview raw input (R code)
Raw Outputview raw output of R engine
Computing time5 seconds
R Server'Herman Ole Andreas Wold' @ 193.190.124.10:1001


Univariate ARIMA Extrapolation Forecast
timeY[t]F[t]95% LB95% UBp-value(H0: Y[t] = F[t])P(F[t]>Y[t-1])P(F[t]>Y[t-s])P(F[t]>Y[49])
37565742-------
38557274-------
39560576-------
40548854-------
41531673-------
42525919-------
43511038-------
44498662-------
45555362-------
46564591-------
47541657-------
48527070-------
49509846-------
50514258501340.9741487208.0355515473.91260.03660.119100.1191
51516922499666.7228479188.2646520145.1810.04930.081300.165
52507561486893.6966461222.3579512565.03530.05730.010900.0399
53492622468925.3234438613.1689499237.47780.06270.006200.0041
54490243457440.9233422815.3552492066.49140.03170.02321e-040.0015
55469357441524.2086402801.3114480247.10580.07940.00682e-043e-04
56477580430099.9096387431.8846472767.93460.01460.03578e-041e-04
57528379480211.3684433710.209526712.52790.02120.54428e-040.1058
58533590486034.2488435784.9683536283.52930.03180.04930.00110.1765
59517945466193.5943412262.2278520124.96090.030.00720.0030.0563
60506174447667.3228390106.0608505228.58480.02320.00840.00340.0171
61501866425775.307364625.9404486924.67350.00740.0050.00350.0035

\begin{tabular}{lllllllll}
\hline
Univariate ARIMA Extrapolation Forecast \tabularnewline
time & Y[t] & F[t] & 95% LB & 95% UB & p-value(H0: Y[t] = F[t]) & P(F[t]>Y[t-1]) & P(F[t]>Y[t-s]) & P(F[t]>Y[49]) \tabularnewline
37 & 565742 & - & - & - & - & - & - & - \tabularnewline
38 & 557274 & - & - & - & - & - & - & - \tabularnewline
39 & 560576 & - & - & - & - & - & - & - \tabularnewline
40 & 548854 & - & - & - & - & - & - & - \tabularnewline
41 & 531673 & - & - & - & - & - & - & - \tabularnewline
42 & 525919 & - & - & - & - & - & - & - \tabularnewline
43 & 511038 & - & - & - & - & - & - & - \tabularnewline
44 & 498662 & - & - & - & - & - & - & - \tabularnewline
45 & 555362 & - & - & - & - & - & - & - \tabularnewline
46 & 564591 & - & - & - & - & - & - & - \tabularnewline
47 & 541657 & - & - & - & - & - & - & - \tabularnewline
48 & 527070 & - & - & - & - & - & - & - \tabularnewline
49 & 509846 & - & - & - & - & - & - & - \tabularnewline
50 & 514258 & 501340.9741 & 487208.0355 & 515473.9126 & 0.0366 & 0.1191 & 0 & 0.1191 \tabularnewline
51 & 516922 & 499666.7228 & 479188.2646 & 520145.181 & 0.0493 & 0.0813 & 0 & 0.165 \tabularnewline
52 & 507561 & 486893.6966 & 461222.3579 & 512565.0353 & 0.0573 & 0.0109 & 0 & 0.0399 \tabularnewline
53 & 492622 & 468925.3234 & 438613.1689 & 499237.4778 & 0.0627 & 0.0062 & 0 & 0.0041 \tabularnewline
54 & 490243 & 457440.9233 & 422815.3552 & 492066.4914 & 0.0317 & 0.0232 & 1e-04 & 0.0015 \tabularnewline
55 & 469357 & 441524.2086 & 402801.3114 & 480247.1058 & 0.0794 & 0.0068 & 2e-04 & 3e-04 \tabularnewline
56 & 477580 & 430099.9096 & 387431.8846 & 472767.9346 & 0.0146 & 0.0357 & 8e-04 & 1e-04 \tabularnewline
57 & 528379 & 480211.3684 & 433710.209 & 526712.5279 & 0.0212 & 0.5442 & 8e-04 & 0.1058 \tabularnewline
58 & 533590 & 486034.2488 & 435784.9683 & 536283.5293 & 0.0318 & 0.0493 & 0.0011 & 0.1765 \tabularnewline
59 & 517945 & 466193.5943 & 412262.2278 & 520124.9609 & 0.03 & 0.0072 & 0.003 & 0.0563 \tabularnewline
60 & 506174 & 447667.3228 & 390106.0608 & 505228.5848 & 0.0232 & 0.0084 & 0.0034 & 0.0171 \tabularnewline
61 & 501866 & 425775.307 & 364625.9404 & 486924.6735 & 0.0074 & 0.005 & 0.0035 & 0.0035 \tabularnewline
\hline
\end{tabular}
%Source: https://freestatistics.org/blog/index.php?pk=35901&T=1

[TABLE]
[ROW][C]Univariate ARIMA Extrapolation Forecast[/C][/ROW]
[ROW][C]time[/C][C]Y[t][/C][C]F[t][/C][C]95% LB[/C][C]95% UB[/C][C]p-value(H0: Y[t] = F[t])[/C][C]P(F[t]>Y[t-1])[/C][C]P(F[t]>Y[t-s])[/C][C]P(F[t]>Y[49])[/C][/ROW]
[ROW][C]37[/C][C]565742[/C][C]-[/C][C]-[/C][C]-[/C][C]-[/C][C]-[/C][C]-[/C][C]-[/C][/ROW]
[ROW][C]38[/C][C]557274[/C][C]-[/C][C]-[/C][C]-[/C][C]-[/C][C]-[/C][C]-[/C][C]-[/C][/ROW]
[ROW][C]39[/C][C]560576[/C][C]-[/C][C]-[/C][C]-[/C][C]-[/C][C]-[/C][C]-[/C][C]-[/C][/ROW]
[ROW][C]40[/C][C]548854[/C][C]-[/C][C]-[/C][C]-[/C][C]-[/C][C]-[/C][C]-[/C][C]-[/C][/ROW]
[ROW][C]41[/C][C]531673[/C][C]-[/C][C]-[/C][C]-[/C][C]-[/C][C]-[/C][C]-[/C][C]-[/C][/ROW]
[ROW][C]42[/C][C]525919[/C][C]-[/C][C]-[/C][C]-[/C][C]-[/C][C]-[/C][C]-[/C][C]-[/C][/ROW]
[ROW][C]43[/C][C]511038[/C][C]-[/C][C]-[/C][C]-[/C][C]-[/C][C]-[/C][C]-[/C][C]-[/C][/ROW]
[ROW][C]44[/C][C]498662[/C][C]-[/C][C]-[/C][C]-[/C][C]-[/C][C]-[/C][C]-[/C][C]-[/C][/ROW]
[ROW][C]45[/C][C]555362[/C][C]-[/C][C]-[/C][C]-[/C][C]-[/C][C]-[/C][C]-[/C][C]-[/C][/ROW]
[ROW][C]46[/C][C]564591[/C][C]-[/C][C]-[/C][C]-[/C][C]-[/C][C]-[/C][C]-[/C][C]-[/C][/ROW]
[ROW][C]47[/C][C]541657[/C][C]-[/C][C]-[/C][C]-[/C][C]-[/C][C]-[/C][C]-[/C][C]-[/C][/ROW]
[ROW][C]48[/C][C]527070[/C][C]-[/C][C]-[/C][C]-[/C][C]-[/C][C]-[/C][C]-[/C][C]-[/C][/ROW]
[ROW][C]49[/C][C]509846[/C][C]-[/C][C]-[/C][C]-[/C][C]-[/C][C]-[/C][C]-[/C][C]-[/C][/ROW]
[ROW][C]50[/C][C]514258[/C][C]501340.9741[/C][C]487208.0355[/C][C]515473.9126[/C][C]0.0366[/C][C]0.1191[/C][C]0[/C][C]0.1191[/C][/ROW]
[ROW][C]51[/C][C]516922[/C][C]499666.7228[/C][C]479188.2646[/C][C]520145.181[/C][C]0.0493[/C][C]0.0813[/C][C]0[/C][C]0.165[/C][/ROW]
[ROW][C]52[/C][C]507561[/C][C]486893.6966[/C][C]461222.3579[/C][C]512565.0353[/C][C]0.0573[/C][C]0.0109[/C][C]0[/C][C]0.0399[/C][/ROW]
[ROW][C]53[/C][C]492622[/C][C]468925.3234[/C][C]438613.1689[/C][C]499237.4778[/C][C]0.0627[/C][C]0.0062[/C][C]0[/C][C]0.0041[/C][/ROW]
[ROW][C]54[/C][C]490243[/C][C]457440.9233[/C][C]422815.3552[/C][C]492066.4914[/C][C]0.0317[/C][C]0.0232[/C][C]1e-04[/C][C]0.0015[/C][/ROW]
[ROW][C]55[/C][C]469357[/C][C]441524.2086[/C][C]402801.3114[/C][C]480247.1058[/C][C]0.0794[/C][C]0.0068[/C][C]2e-04[/C][C]3e-04[/C][/ROW]
[ROW][C]56[/C][C]477580[/C][C]430099.9096[/C][C]387431.8846[/C][C]472767.9346[/C][C]0.0146[/C][C]0.0357[/C][C]8e-04[/C][C]1e-04[/C][/ROW]
[ROW][C]57[/C][C]528379[/C][C]480211.3684[/C][C]433710.209[/C][C]526712.5279[/C][C]0.0212[/C][C]0.5442[/C][C]8e-04[/C][C]0.1058[/C][/ROW]
[ROW][C]58[/C][C]533590[/C][C]486034.2488[/C][C]435784.9683[/C][C]536283.5293[/C][C]0.0318[/C][C]0.0493[/C][C]0.0011[/C][C]0.1765[/C][/ROW]
[ROW][C]59[/C][C]517945[/C][C]466193.5943[/C][C]412262.2278[/C][C]520124.9609[/C][C]0.03[/C][C]0.0072[/C][C]0.003[/C][C]0.0563[/C][/ROW]
[ROW][C]60[/C][C]506174[/C][C]447667.3228[/C][C]390106.0608[/C][C]505228.5848[/C][C]0.0232[/C][C]0.0084[/C][C]0.0034[/C][C]0.0171[/C][/ROW]
[ROW][C]61[/C][C]501866[/C][C]425775.307[/C][C]364625.9404[/C][C]486924.6735[/C][C]0.0074[/C][C]0.005[/C][C]0.0035[/C][C]0.0035[/C][/ROW]
[/TABLE]
Source: https://freestatistics.org/blog/index.php?pk=35901&T=1

Globally Unique Identifier (entire table): ba.freestatistics.org/blog/index.php?pk=35901&T=1

As an alternative you can also use a QR Code:  

The GUIDs for individual cells are displayed in the table below:

Univariate ARIMA Extrapolation Forecast
timeY[t]F[t]95% LB95% UBp-value(H0: Y[t] = F[t])P(F[t]>Y[t-1])P(F[t]>Y[t-s])P(F[t]>Y[49])
37565742-------
38557274-------
39560576-------
40548854-------
41531673-------
42525919-------
43511038-------
44498662-------
45555362-------
46564591-------
47541657-------
48527070-------
49509846-------
50514258501340.9741487208.0355515473.91260.03660.119100.1191
51516922499666.7228479188.2646520145.1810.04930.081300.165
52507561486893.6966461222.3579512565.03530.05730.010900.0399
53492622468925.3234438613.1689499237.47780.06270.006200.0041
54490243457440.9233422815.3552492066.49140.03170.02321e-040.0015
55469357441524.2086402801.3114480247.10580.07940.00682e-043e-04
56477580430099.9096387431.8846472767.93460.01460.03578e-041e-04
57528379480211.3684433710.209526712.52790.02120.54428e-040.1058
58533590486034.2488435784.9683536283.52930.03180.04930.00110.1765
59517945466193.5943412262.2278520124.96090.030.00720.0030.0563
60506174447667.3228390106.0608505228.58480.02320.00840.00340.0171
61501866425775.307364625.9404486924.67350.00740.0050.00350.0035


Univariate ARIMA Extrapolation Forecast Performance
time% S.E.PEMAPESq.EMSERMSE
500.01440.02580.0021166849559.085713904129.92383728.8242
510.02090.03450.0029297744590.654124812049.22124981.1695
520.02690.04240.0035427137429.985835594785.83215966.1366
530.0330.05050.0042561532482.517946794373.54326840.6413
540.03860.07170.0061075976234.774889664686.23129469.1439
550.04470.0630.0053774664278.119364555356.50998034.6348
560.05060.11040.00922254358985.912187863248.82613706.3215
570.04940.10030.00842320120729.8258193343394.152213904.7975
580.05270.09780.00822261549471.4282188462455.952413728.1629
590.0590.1110.00932678207988.6481223183999.05414939.344
600.06560.13070.01093423031279.1046285252606.59216889.4229
610.07330.17870.01495789793564.5246482482797.043721965.491

\begin{tabular}{lllllllll}
\hline
Univariate ARIMA Extrapolation Forecast Performance \tabularnewline
time & % S.E. & PE & MAPE & Sq.E & MSE & RMSE \tabularnewline
50 & 0.0144 & 0.0258 & 0.0021 & 166849559.0857 & 13904129.9238 & 3728.8242 \tabularnewline
51 & 0.0209 & 0.0345 & 0.0029 & 297744590.6541 & 24812049.2212 & 4981.1695 \tabularnewline
52 & 0.0269 & 0.0424 & 0.0035 & 427137429.9858 & 35594785.8321 & 5966.1366 \tabularnewline
53 & 0.033 & 0.0505 & 0.0042 & 561532482.5179 & 46794373.5432 & 6840.6413 \tabularnewline
54 & 0.0386 & 0.0717 & 0.006 & 1075976234.7748 & 89664686.2312 & 9469.1439 \tabularnewline
55 & 0.0447 & 0.063 & 0.0053 & 774664278.1193 & 64555356.5099 & 8034.6348 \tabularnewline
56 & 0.0506 & 0.1104 & 0.0092 & 2254358985.912 & 187863248.826 & 13706.3215 \tabularnewline
57 & 0.0494 & 0.1003 & 0.0084 & 2320120729.8258 & 193343394.1522 & 13904.7975 \tabularnewline
58 & 0.0527 & 0.0978 & 0.0082 & 2261549471.4282 & 188462455.9524 & 13728.1629 \tabularnewline
59 & 0.059 & 0.111 & 0.0093 & 2678207988.6481 & 223183999.054 & 14939.344 \tabularnewline
60 & 0.0656 & 0.1307 & 0.0109 & 3423031279.1046 & 285252606.592 & 16889.4229 \tabularnewline
61 & 0.0733 & 0.1787 & 0.0149 & 5789793564.5246 & 482482797.0437 & 21965.491 \tabularnewline
\hline
\end{tabular}
%Source: https://freestatistics.org/blog/index.php?pk=35901&T=2

[TABLE]
[ROW][C]Univariate ARIMA Extrapolation Forecast Performance[/C][/ROW]
[ROW][C]time[/C][C]% S.E.[/C][C]PE[/C][C]MAPE[/C][C]Sq.E[/C][C]MSE[/C][C]RMSE[/C][/ROW]
[ROW][C]50[/C][C]0.0144[/C][C]0.0258[/C][C]0.0021[/C][C]166849559.0857[/C][C]13904129.9238[/C][C]3728.8242[/C][/ROW]
[ROW][C]51[/C][C]0.0209[/C][C]0.0345[/C][C]0.0029[/C][C]297744590.6541[/C][C]24812049.2212[/C][C]4981.1695[/C][/ROW]
[ROW][C]52[/C][C]0.0269[/C][C]0.0424[/C][C]0.0035[/C][C]427137429.9858[/C][C]35594785.8321[/C][C]5966.1366[/C][/ROW]
[ROW][C]53[/C][C]0.033[/C][C]0.0505[/C][C]0.0042[/C][C]561532482.5179[/C][C]46794373.5432[/C][C]6840.6413[/C][/ROW]
[ROW][C]54[/C][C]0.0386[/C][C]0.0717[/C][C]0.006[/C][C]1075976234.7748[/C][C]89664686.2312[/C][C]9469.1439[/C][/ROW]
[ROW][C]55[/C][C]0.0447[/C][C]0.063[/C][C]0.0053[/C][C]774664278.1193[/C][C]64555356.5099[/C][C]8034.6348[/C][/ROW]
[ROW][C]56[/C][C]0.0506[/C][C]0.1104[/C][C]0.0092[/C][C]2254358985.912[/C][C]187863248.826[/C][C]13706.3215[/C][/ROW]
[ROW][C]57[/C][C]0.0494[/C][C]0.1003[/C][C]0.0084[/C][C]2320120729.8258[/C][C]193343394.1522[/C][C]13904.7975[/C][/ROW]
[ROW][C]58[/C][C]0.0527[/C][C]0.0978[/C][C]0.0082[/C][C]2261549471.4282[/C][C]188462455.9524[/C][C]13728.1629[/C][/ROW]
[ROW][C]59[/C][C]0.059[/C][C]0.111[/C][C]0.0093[/C][C]2678207988.6481[/C][C]223183999.054[/C][C]14939.344[/C][/ROW]
[ROW][C]60[/C][C]0.0656[/C][C]0.1307[/C][C]0.0109[/C][C]3423031279.1046[/C][C]285252606.592[/C][C]16889.4229[/C][/ROW]
[ROW][C]61[/C][C]0.0733[/C][C]0.1787[/C][C]0.0149[/C][C]5789793564.5246[/C][C]482482797.0437[/C][C]21965.491[/C][/ROW]
[/TABLE]
Source: https://freestatistics.org/blog/index.php?pk=35901&T=2

Globally Unique Identifier (entire table): ba.freestatistics.org/blog/index.php?pk=35901&T=2

As an alternative you can also use a QR Code:  

The GUIDs for individual cells are displayed in the table below:

Univariate ARIMA Extrapolation Forecast Performance
time% S.E.PEMAPESq.EMSERMSE
500.01440.02580.0021166849559.085713904129.92383728.8242
510.02090.03450.0029297744590.654124812049.22124981.1695
520.02690.04240.0035427137429.985835594785.83215966.1366
530.0330.05050.0042561532482.517946794373.54326840.6413
540.03860.07170.0061075976234.774889664686.23129469.1439
550.04470.0630.0053774664278.119364555356.50998034.6348
560.05060.11040.00922254358985.912187863248.82613706.3215
570.04940.10030.00842320120729.8258193343394.152213904.7975
580.05270.09780.00822261549471.4282188462455.952413728.1629
590.0590.1110.00932678207988.6481223183999.05414939.344
600.06560.13070.01093423031279.1046285252606.59216889.4229
610.07330.17870.01495789793564.5246482482797.043721965.491


Parameters (Session):
par1 = FALSE ; par2 = 0.0 ; par3 = 1 ; par4 = 0 ; par5 = 12 ; par6 = 3 ; par7 = 1 ; par8 = 2 ; par9 = 1 ;
Parameters (R input):
par1 = 12 ; par2 = 1 ; par3 = 1 ; par4 = 1 ; par5 = 12 ; par6 = 1 ; par7 = 1 ; par8 = 1 ; par9 = 1 ; par10 = FALSE ;
R code (references can be found in the software module):
par1 <- as.numeric(par1) #cut off periods
par2 <- as.numeric(par2) #lambda
par3 <- as.numeric(par3) #degree of non-seasonal differencing
par4 <- as.numeric(par4) #degree of seasonal differencing
par5 <- as.numeric(par5) #seasonal period
par6 <- as.numeric(par6) #p
par7 <- as.numeric(par7) #q
par8 <- as.numeric(par8) #P
par9 <- as.numeric(par9) #Q
if (par10 == 'TRUE') par10 <- TRUE
if (par10 == 'FALSE') par10 <- FALSE
if (par2 == 0) x <- log(x)
if (par2 != 0) x <- x^par2
lx <- length(x)
first <- lx - 2*par1
nx <- lx - par1
nx1 <- nx + 1
fx <- lx - nx
if (fx < 1) {
fx <- par5
nx1 <- lx + fx - 1
first <- lx - 2*fx
}
first <- 1
if (fx < 3) fx <- round(lx/10,0)
(arima.out <- arima(x[1:nx], order=c(par6,par3,par7), seasonal=list(order=c(par8,par4,par9), period=par5), include.mean=par10, method='ML'))
(forecast <- predict(arima.out,fx))
(lb <- forecast$pred - 1.96 * forecast$se)
(ub <- forecast$pred + 1.96 * forecast$se)
if (par2 == 0) {
x <- exp(x)
forecast$pred <- exp(forecast$pred)
lb <- exp(lb)
ub <- exp(ub)
}
if (par2 != 0) {
x <- x^(1/par2)
forecast$pred <- forecast$pred^(1/par2)
lb <- lb^(1/par2)
ub <- ub^(1/par2)
}
if (par2 < 0) {
olb <- lb
lb <- ub
ub <- olb
}
(actandfor <- c(x[1:nx], forecast$pred))
(perc.se <- (ub-forecast$pred)/1.96/forecast$pred)
bitmap(file='test1.png')
opar <- par(mar=c(4,4,2,2),las=1)
ylim <- c( min(x[first:nx],lb), max(x[first:nx],ub))
plot(x,ylim=ylim,type='n',xlim=c(first,lx))
usr <- par('usr')
rect(usr[1],usr[3],nx+1,usr[4],border=NA,col='lemonchiffon')
rect(nx1,usr[3],usr[2],usr[4],border=NA,col='lavender')
abline(h= (-3:3)*2 , col ='gray', lty =3)
polygon( c(nx1:lx,lx:nx1), c(lb,rev(ub)), col = 'orange', lty=2,border=NA)
lines(nx1:lx, lb , lty=2)
lines(nx1:lx, ub , lty=2)
lines(x, lwd=2)
lines(nx1:lx, forecast$pred , lwd=2 , col ='white')
box()
par(opar)
dev.off()
prob.dec <- array(NA, dim=fx)
prob.sdec <- array(NA, dim=fx)
prob.ldec <- array(NA, dim=fx)
prob.pval <- array(NA, dim=fx)
perf.pe <- array(0, dim=fx)
perf.mape <- array(0, dim=fx)
perf.se <- array(0, dim=fx)
perf.mse <- array(0, dim=fx)
perf.rmse <- array(0, dim=fx)
for (i in 1:fx) {
locSD <- (ub[i] - forecast$pred[i]) / 1.96
perf.pe[i] = (x[nx+i] - forecast$pred[i]) / forecast$pred[i]
perf.mape[i] = perf.mape[i] + abs(perf.pe[i])
perf.se[i] = (x[nx+i] - forecast$pred[i])^2
perf.mse[i] = perf.mse[i] + perf.se[i]
prob.dec[i] = pnorm((x[nx+i-1] - forecast$pred[i]) / locSD)
prob.sdec[i] = pnorm((x[nx+i-par5] - forecast$pred[i]) / locSD)
prob.ldec[i] = pnorm((x[nx] - forecast$pred[i]) / locSD)
prob.pval[i] = pnorm(abs(x[nx+i] - forecast$pred[i]) / locSD)
}
perf.mape = perf.mape / fx
perf.mse = perf.mse / fx
perf.rmse = sqrt(perf.mse)
bitmap(file='test2.png')
plot(forecast$pred, pch=19, type='b',main='ARIMA Extrapolation Forecast', ylab='Forecast and 95% CI', xlab='time',ylim=c(min(lb),max(ub)))
dum <- forecast$pred
dum[1:12] <- x[(nx+1):lx]
lines(dum, lty=1)
lines(ub,lty=3)
lines(lb,lty=3)
dev.off()
load(file='createtable')
a<-table.start()
a<-table.row.start(a)
a<-table.element(a,'Univariate ARIMA Extrapolation Forecast',9,TRUE)
a<-table.row.end(a)
a<-table.row.start(a)
a<-table.element(a,'time',1,header=TRUE)
a<-table.element(a,'Y[t]',1,header=TRUE)
a<-table.element(a,'F[t]',1,header=TRUE)
a<-table.element(a,'95% LB',1,header=TRUE)
a<-table.element(a,'95% UB',1,header=TRUE)
a<-table.element(a,'p-value
(H0: Y[t] = F[t])',1,header=TRUE)
a<-table.element(a,'P(F[t]>Y[t-1])',1,header=TRUE)
a<-table.element(a,'P(F[t]>Y[t-s])',1,header=TRUE)
mylab <- paste('P(F[t]>Y[',nx,sep='')
mylab <- paste(mylab,'])',sep='')
a<-table.element(a,mylab,1,header=TRUE)
a<-table.row.end(a)
for (i in (nx-par5):nx) {
a<-table.row.start(a)
a<-table.element(a,i,header=TRUE)
a<-table.element(a,x[i])
a<-table.element(a,'-')
a<-table.row.end(a)
}
for (i in 1:fx) {
a<-table.row.start(a)
a<-table.element(a,nx+i,header=TRUE)
a<-table.element(a,round(x[nx+i],4))
a<-table.element(a,round(forecast$pred[i],4))
a<-table.element(a,round(lb[i],4))
a<-table.element(a,round(ub[i],4))
a<-table.element(a,round((1-prob.pval[i]),4))
a<-table.element(a,round((1-prob.dec[i]),4))
a<-table.element(a,round((1-prob.sdec[i]),4))
a<-table.element(a,round((1-prob.ldec[i]),4))
a<-table.row.end(a)
}
a<-table.end(a)
table.save(a,file='mytable.tab')
a<-table.start()
a<-table.row.start(a)
a<-table.element(a,'Univariate ARIMA Extrapolation Forecast Performance',7,TRUE)
a<-table.row.end(a)
a<-table.row.start(a)
a<-table.element(a,'time',1,header=TRUE)
a<-table.element(a,'% S.E.',1,header=TRUE)
a<-table.element(a,'PE',1,header=TRUE)
a<-table.element(a,'MAPE',1,header=TRUE)
a<-table.element(a,'Sq.E',1,header=TRUE)
a<-table.element(a,'MSE',1,header=TRUE)
a<-table.element(a,'RMSE',1,header=TRUE)
a<-table.row.end(a)
for (i in 1:fx) {
a<-table.row.start(a)
a<-table.element(a,nx+i,header=TRUE)
a<-table.element(a,round(perc.se[i],4))
a<-table.element(a,round(perf.pe[i],4))
a<-table.element(a,round(perf.mape[i],4))
a<-table.element(a,round(perf.se[i],4))
a<-table.element(a,round(perf.mse[i],4))
a<-table.element(a,round(perf.rmse[i],4))
a<-table.row.end(a)
}
a<-table.end(a)
table.save(a,file='mytable1.tab')