Free Statistics

of Irreproducible Research!

Author's title

Author*Unverified author*
R Software Modulerwasp_arimabackwardselection.wasp
Title produced by softwareARIMA Backward Selection
Date of computationSun, 21 Dec 2008 12:32:00 -0700
Cite this page as followsStatistical Computations at FreeStatistics.org, Office for Research Development and Education, URL https://freestatistics.org/blog/index.php?v=date/2008/Dec/21/t122988804846z1ie4d24amlll.htm/, Retrieved Fri, 17 May 2024 06:37:30 +0000
Statistical Computations at FreeStatistics.org, Office for Research Development and Education, URL https://freestatistics.org/blog/index.php?pk=35781, Retrieved Fri, 17 May 2024 06:37:30 +0000
QR Codes:

Original text written by user:
IsPrivate?No (this computation is public)
User-defined keywords
Estimated Impact171
Family? (F = Feedback message, R = changed R code, M = changed R Module, P = changed Parameters, D = changed Data)
F       [ARIMA Backward Selection] [] [2008-12-21 19:32:00] [d41d8cd98f00b204e9800998ecf8427e] [Current]
Feedback Forum
2009-01-08 13:08:53 [Aurélie Van Impe] [reply
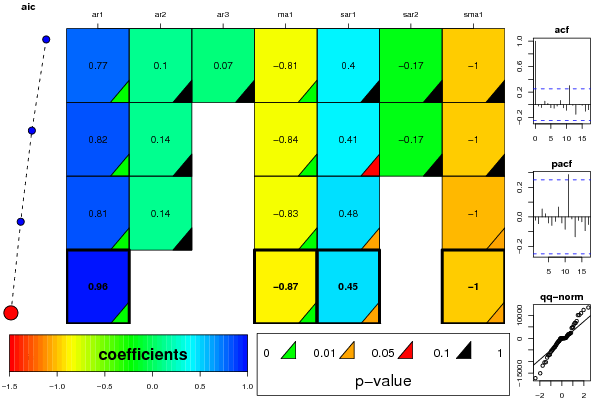
Je uitleg over het model zelf is nogal beknopt, er valt heel wat meer over te vertellen. Je had kunnen uitleggen wat de software precies doet. Dat het zelf een aantal modellen uitprobeert, waarbij het begint met de parameters p, q, P en Q in te stellen op hun maximale waarde. Zo gaat de software systematisch die waarden aanpassen, tot het een model bekomt met enkel betrouwbare waarden. Je had ook nog uitgebreider kunnen uitleggen wat er met de driehoekjes gebeurt. In het eerst geprobeerde model zie je 2 groene driehoekjes en voor de rest allemaal zwarte. De zwarte driehoekjes geven het minst betrouwbare resultaat. Bijgevolg zal de software die zwarte driehoekjes één voor één wegwerken. Uiteindelijk blijft er een model over met enkel groene en oranje driehoekjes. Deze resultaten hebben een betrouwbaarheidsgehalte van meer dan 95%, omdat de kans dat je je vergist kleiner is dan 5%. Je had ook nog kunnen vermelden waarvoor de ar1, ar2, ma1, sar1 en sma1 staan. Zij staan voor de orde van de AR en MA processen en de seizoenale AR en de seizoenale MA processen. De getallen komen inderdaad overeen met de griekse letters in je formule die je zoekt.
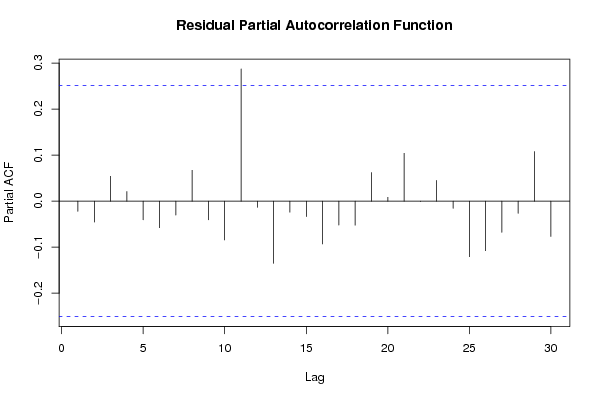
Vervolgens heb ik nog een vraagje: waarom vormt het feit dat de processen slechts tot de eerste orde behoren een probleem om een patroon te herkennen? Het gaat er toch maar om dat de streepjes boven het betrouwbaarheidsinterval uitkomen in de grafiek die je gebruikt voor de significantie? En of dat er nu 1 is of 2, dat is toch even moeilijk of gemakkelijk om te zien?

De waarden die je gevonden hebt voor q, p, Q en P zijn correct. Je zegt ‘dit zijn de parameters die we moeten invullen in het ARIMA model’, net achter de waarden die je gevonden hebt voor p, q, P en Q, maar vervolgens vul je andere waarden in in de formule. Het zijn wel de juiste waarden, maar je legt niet uit van waar ze werkelijk komen.

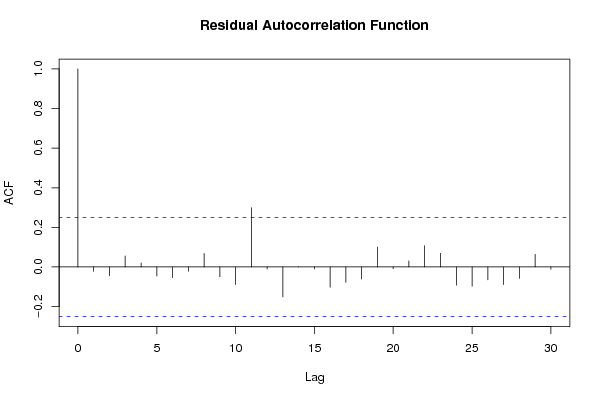
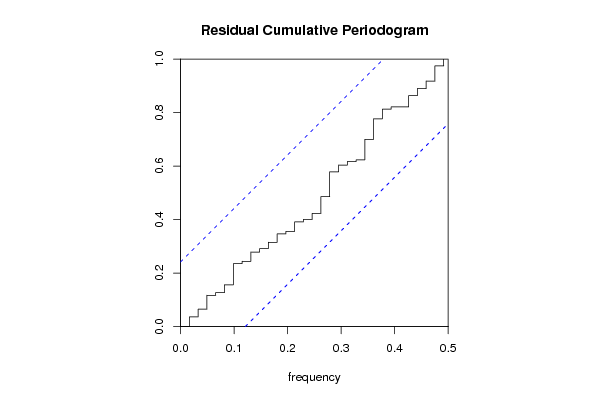
Bij de controle of aan de assumpties voldaan is, zeg je hier dat er WEL trapjes merkbaar zijn in het residual cumulative periodogram, terwijl het over hetzelfde cumulatieve periodogram gaat als daarvoor, en je het daar niet vermeldde. Het is wel goed natuurlijk dat je het hier wel vermeld.

Je besluit al dat aan de assumpties voldaan is, terwijl je nog enkele dingen moet controleren, je had beter met die concluderende zin gewacht.

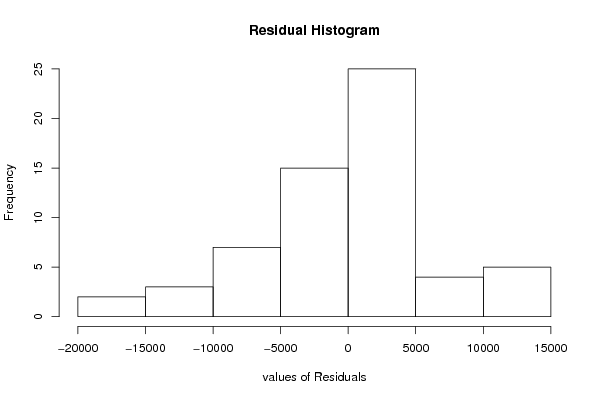
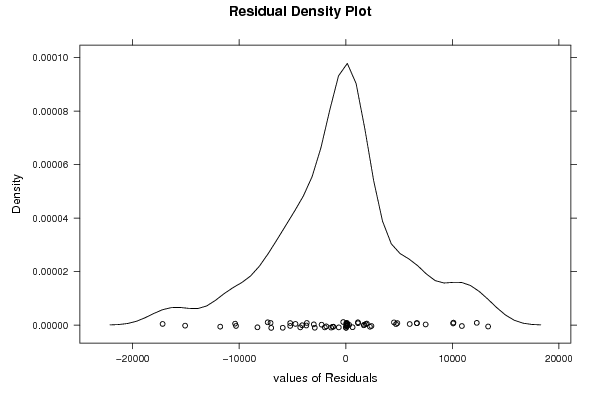
Wat is het verschil tussen een normaalverdeling en een normaalverdeling die aan de assumpties voldoet? Want volgens jou is dat blijkbaar niet hetzelfde. Bij mijn weten is dit histogram verre van normaalverdeeld. Het is zeer linksscheef zelfs. De density plot is inderdaad redelijk normaal verdeeld. Ik vind dat de residual normal q-q plot helemaal niet aan de assumpties voldoet. Het laat zien dat je verdeling aan beide kanten vrij scheef is, en dat zelfs in het midden de bolletjes niet op de diagonaal liggen. Je hebt dus niet zo’n goede normaalverdeling.

Ook je conclusie komt te vroeg. Je zei dat 1 van de assumpties nog was dat de spreiding constant moet zijn en gemiddeld gelijk aan nul, maar dit heb je niet getest. Ik vind niet dat aan alle assumpties voldaan is, en beschouw dit model dus niet echt als ‘goed’. Het is niet erg als je een minder goed model bekomt, maar dan moet je dat gewoon zeggen en niet proberen het toch af te schilderen als een goed model. Het is logisch dat je niet voor elke tijdreeks een goed model kan bekomen.

Post a new message
Dataseries X:
547344
554788
562325
560854
555332
543599
536662
542722
593530
610763
612613
611324
594167
595454
590865
589379
584428
573100
567456
569028
620735
628884
628232
612117
595404
597141
593408
590072
579799
574205
572775
572942
619567
625809
619916
587625
565742
557274
560576
548854
531673
525919
511038
498662
555362
564591
541657
527070
509846
514258
516922
507561
492622
490243
469357
477580
528379
533590
517945
506174
501866


Summary of computational transaction
Raw Inputview raw input (R code)
Raw Outputview raw output of R engine
Computing time10 seconds
R Server'Gwilym Jenkins' @ 72.249.127.135

\begin{tabular}{lllllllll}
\hline
Summary of computational transaction \tabularnewline
Raw Input & view raw input (R code)  \tabularnewline
Raw Output & view raw output of R engine  \tabularnewline
Computing time & 10 seconds \tabularnewline
R Server & 'Gwilym Jenkins' @ 72.249.127.135 \tabularnewline
\hline
\end{tabular}
%Source: https://freestatistics.org/blog/index.php?pk=35781&T=0

[TABLE]
[ROW][C]Summary of computational transaction[/C][/ROW]
[ROW][C]Raw Input[/C][C]view raw input (R code) [/C][/ROW]
[ROW][C]Raw Output[/C][C]view raw output of R engine [/C][/ROW]
[ROW][C]Computing time[/C][C]10 seconds[/C][/ROW]
[ROW][C]R Server[/C][C]'Gwilym Jenkins' @ 72.249.127.135[/C][/ROW]
[/TABLE]
Source: https://freestatistics.org/blog/index.php?pk=35781&T=0

Globally Unique Identifier (entire table): ba.freestatistics.org/blog/index.php?pk=35781&T=0

As an alternative you can also use a QR Code:  

The GUIDs for individual cells are displayed in the table below:

Summary of computational transaction
Raw Inputview raw input (R code)
Raw Outputview raw output of R engine
Computing time10 seconds
R Server'Gwilym Jenkins' @ 72.249.127.135


ARIMA Parameter Estimation and Backward Selection
Iterationar1ar2ar3ma1sar1sar2sma1
Estimates ( 1 )0.77420.10110.0689-0.80530.4017-0.1724-0.9988
(p-val)(0.0037 )(0.5968 )(0.691 )(1e-04 )(0.1078 )(0.4341 )(0.1696 )
Estimates ( 2 )0.81550.14130-0.83760.4104-0.172-0.9998
(p-val)(3e-04 )(0.3844 )(NA )(0 )(0.0877 )(0.4356 )(0.1234 )
Estimates ( 3 )0.80770.14020-0.82990.47860-1.0001
(p-val)(2e-04 )(0.3838 )(NA )(0 )(0.0369 )(NA )(0.0106 )
Estimates ( 4 )0.963700-0.8730.45260-0.9996
(p-val)(0 )(NA )(NA )(0 )(0.0422 )(NA )(0.0101 )
Estimates ( 5 )NANANANANANANA
(p-val)(NA )(NA )(NA )(NA )(NA )(NA )(NA )
Estimates ( 6 )NANANANANANANA
(p-val)(NA )(NA )(NA )(NA )(NA )(NA )(NA )
Estimates ( 7 )NANANANANANANA
(p-val)(NA )(NA )(NA )(NA )(NA )(NA )(NA )
Estimates ( 8 )NANANANANANANA
(p-val)(NA )(NA )(NA )(NA )(NA )(NA )(NA )
Estimates ( 9 )NANANANANANANA
(p-val)(NA )(NA )(NA )(NA )(NA )(NA )(NA )
Estimates ( 10 )NANANANANANANA
(p-val)(NA )(NA )(NA )(NA )(NA )(NA )(NA )
Estimates ( 11 )NANANANANANANA
(p-val)(NA )(NA )(NA )(NA )(NA )(NA )(NA )
Estimates ( 12 )NANANANANANANA
(p-val)(NA )(NA )(NA )(NA )(NA )(NA )(NA )
Estimates ( 13 )NANANANANANANA
(p-val)(NA )(NA )(NA )(NA )(NA )(NA )(NA )

\begin{tabular}{lllllllll}
\hline
ARIMA Parameter Estimation and Backward Selection \tabularnewline
Iteration & ar1 & ar2 & ar3 & ma1 & sar1 & sar2 & sma1 \tabularnewline
Estimates ( 1 ) & 0.7742 & 0.1011 & 0.0689 & -0.8053 & 0.4017 & -0.1724 & -0.9988 \tabularnewline
(p-val) & (0.0037 ) & (0.5968 ) & (0.691 ) & (1e-04 ) & (0.1078 ) & (0.4341 ) & (0.1696 ) \tabularnewline
Estimates ( 2 ) & 0.8155 & 0.1413 & 0 & -0.8376 & 0.4104 & -0.172 & -0.9998 \tabularnewline
(p-val) & (3e-04 ) & (0.3844 ) & (NA ) & (0 ) & (0.0877 ) & (0.4356 ) & (0.1234 ) \tabularnewline
Estimates ( 3 ) & 0.8077 & 0.1402 & 0 & -0.8299 & 0.4786 & 0 & -1.0001 \tabularnewline
(p-val) & (2e-04 ) & (0.3838 ) & (NA ) & (0 ) & (0.0369 ) & (NA ) & (0.0106 ) \tabularnewline
Estimates ( 4 ) & 0.9637 & 0 & 0 & -0.873 & 0.4526 & 0 & -0.9996 \tabularnewline
(p-val) & (0 ) & (NA ) & (NA ) & (0 ) & (0.0422 ) & (NA ) & (0.0101 ) \tabularnewline
Estimates ( 5 ) & NA & NA & NA & NA & NA & NA & NA \tabularnewline
(p-val) & (NA ) & (NA ) & (NA ) & (NA ) & (NA ) & (NA ) & (NA ) \tabularnewline
Estimates ( 6 ) & NA & NA & NA & NA & NA & NA & NA \tabularnewline
(p-val) & (NA ) & (NA ) & (NA ) & (NA ) & (NA ) & (NA ) & (NA ) \tabularnewline
Estimates ( 7 ) & NA & NA & NA & NA & NA & NA & NA \tabularnewline
(p-val) & (NA ) & (NA ) & (NA ) & (NA ) & (NA ) & (NA ) & (NA ) \tabularnewline
Estimates ( 8 ) & NA & NA & NA & NA & NA & NA & NA \tabularnewline
(p-val) & (NA ) & (NA ) & (NA ) & (NA ) & (NA ) & (NA ) & (NA ) \tabularnewline
Estimates ( 9 ) & NA & NA & NA & NA & NA & NA & NA \tabularnewline
(p-val) & (NA ) & (NA ) & (NA ) & (NA ) & (NA ) & (NA ) & (NA ) \tabularnewline
Estimates ( 10 ) & NA & NA & NA & NA & NA & NA & NA \tabularnewline
(p-val) & (NA ) & (NA ) & (NA ) & (NA ) & (NA ) & (NA ) & (NA ) \tabularnewline
Estimates ( 11 ) & NA & NA & NA & NA & NA & NA & NA \tabularnewline
(p-val) & (NA ) & (NA ) & (NA ) & (NA ) & (NA ) & (NA ) & (NA ) \tabularnewline
Estimates ( 12 ) & NA & NA & NA & NA & NA & NA & NA \tabularnewline
(p-val) & (NA ) & (NA ) & (NA ) & (NA ) & (NA ) & (NA ) & (NA ) \tabularnewline
Estimates ( 13 ) & NA & NA & NA & NA & NA & NA & NA \tabularnewline
(p-val) & (NA ) & (NA ) & (NA ) & (NA ) & (NA ) & (NA ) & (NA ) \tabularnewline
\hline
\end{tabular}
%Source: https://freestatistics.org/blog/index.php?pk=35781&T=1

[TABLE]
[ROW][C]ARIMA Parameter Estimation and Backward Selection[/C][/ROW]
[ROW][C]Iteration[/C][C]ar1[/C][C]ar2[/C][C]ar3[/C][C]ma1[/C][C]sar1[/C][C]sar2[/C][C]sma1[/C][/ROW]
[ROW][C]Estimates ( 1 )[/C][C]0.7742[/C][C]0.1011[/C][C]0.0689[/C][C]-0.8053[/C][C]0.4017[/C][C]-0.1724[/C][C]-0.9988[/C][/ROW]
[ROW][C](p-val)[/C][C](0.0037 )[/C][C](0.5968 )[/C][C](0.691 )[/C][C](1e-04 )[/C][C](0.1078 )[/C][C](0.4341 )[/C][C](0.1696 )[/C][/ROW]
[ROW][C]Estimates ( 2 )[/C][C]0.8155[/C][C]0.1413[/C][C]0[/C][C]-0.8376[/C][C]0.4104[/C][C]-0.172[/C][C]-0.9998[/C][/ROW]
[ROW][C](p-val)[/C][C](3e-04 )[/C][C](0.3844 )[/C][C](NA )[/C][C](0 )[/C][C](0.0877 )[/C][C](0.4356 )[/C][C](0.1234 )[/C][/ROW]
[ROW][C]Estimates ( 3 )[/C][C]0.8077[/C][C]0.1402[/C][C]0[/C][C]-0.8299[/C][C]0.4786[/C][C]0[/C][C]-1.0001[/C][/ROW]
[ROW][C](p-val)[/C][C](2e-04 )[/C][C](0.3838 )[/C][C](NA )[/C][C](0 )[/C][C](0.0369 )[/C][C](NA )[/C][C](0.0106 )[/C][/ROW]
[ROW][C]Estimates ( 4 )[/C][C]0.9637[/C][C]0[/C][C]0[/C][C]-0.873[/C][C]0.4526[/C][C]0[/C][C]-0.9996[/C][/ROW]
[ROW][C](p-val)[/C][C](0 )[/C][C](NA )[/C][C](NA )[/C][C](0 )[/C][C](0.0422 )[/C][C](NA )[/C][C](0.0101 )[/C][/ROW]
[ROW][C]Estimates ( 5 )[/C][C]NA[/C][C]NA[/C][C]NA[/C][C]NA[/C][C]NA[/C][C]NA[/C][C]NA[/C][/ROW]
[ROW][C](p-val)[/C][C](NA )[/C][C](NA )[/C][C](NA )[/C][C](NA )[/C][C](NA )[/C][C](NA )[/C][C](NA )[/C][/ROW]
[ROW][C]Estimates ( 6 )[/C][C]NA[/C][C]NA[/C][C]NA[/C][C]NA[/C][C]NA[/C][C]NA[/C][C]NA[/C][/ROW]
[ROW][C](p-val)[/C][C](NA )[/C][C](NA )[/C][C](NA )[/C][C](NA )[/C][C](NA )[/C][C](NA )[/C][C](NA )[/C][/ROW]
[ROW][C]Estimates ( 7 )[/C][C]NA[/C][C]NA[/C][C]NA[/C][C]NA[/C][C]NA[/C][C]NA[/C][C]NA[/C][/ROW]
[ROW][C](p-val)[/C][C](NA )[/C][C](NA )[/C][C](NA )[/C][C](NA )[/C][C](NA )[/C][C](NA )[/C][C](NA )[/C][/ROW]
[ROW][C]Estimates ( 8 )[/C][C]NA[/C][C]NA[/C][C]NA[/C][C]NA[/C][C]NA[/C][C]NA[/C][C]NA[/C][/ROW]
[ROW][C](p-val)[/C][C](NA )[/C][C](NA )[/C][C](NA )[/C][C](NA )[/C][C](NA )[/C][C](NA )[/C][C](NA )[/C][/ROW]
[ROW][C]Estimates ( 9 )[/C][C]NA[/C][C]NA[/C][C]NA[/C][C]NA[/C][C]NA[/C][C]NA[/C][C]NA[/C][/ROW]
[ROW][C](p-val)[/C][C](NA )[/C][C](NA )[/C][C](NA )[/C][C](NA )[/C][C](NA )[/C][C](NA )[/C][C](NA )[/C][/ROW]
[ROW][C]Estimates ( 10 )[/C][C]NA[/C][C]NA[/C][C]NA[/C][C]NA[/C][C]NA[/C][C]NA[/C][C]NA[/C][/ROW]
[ROW][C](p-val)[/C][C](NA )[/C][C](NA )[/C][C](NA )[/C][C](NA )[/C][C](NA )[/C][C](NA )[/C][C](NA )[/C][/ROW]
[ROW][C]Estimates ( 11 )[/C][C]NA[/C][C]NA[/C][C]NA[/C][C]NA[/C][C]NA[/C][C]NA[/C][C]NA[/C][/ROW]
[ROW][C](p-val)[/C][C](NA )[/C][C](NA )[/C][C](NA )[/C][C](NA )[/C][C](NA )[/C][C](NA )[/C][C](NA )[/C][/ROW]
[ROW][C]Estimates ( 12 )[/C][C]NA[/C][C]NA[/C][C]NA[/C][C]NA[/C][C]NA[/C][C]NA[/C][C]NA[/C][/ROW]
[ROW][C](p-val)[/C][C](NA )[/C][C](NA )[/C][C](NA )[/C][C](NA )[/C][C](NA )[/C][C](NA )[/C][C](NA )[/C][/ROW]
[ROW][C]Estimates ( 13 )[/C][C]NA[/C][C]NA[/C][C]NA[/C][C]NA[/C][C]NA[/C][C]NA[/C][C]NA[/C][/ROW]
[ROW][C](p-val)[/C][C](NA )[/C][C](NA )[/C][C](NA )[/C][C](NA )[/C][C](NA )[/C][C](NA )[/C][C](NA )[/C][/ROW]
[/TABLE]
Source: https://freestatistics.org/blog/index.php?pk=35781&T=1

Globally Unique Identifier (entire table): ba.freestatistics.org/blog/index.php?pk=35781&T=1

As an alternative you can also use a QR Code:  

The GUIDs for individual cells are displayed in the table below:

ARIMA Parameter Estimation and Backward Selection
Iterationar1ar2ar3ma1sar1sar2sma1
Estimates ( 1 )0.77420.10110.0689-0.80530.4017-0.1724-0.9988
(p-val)(0.0037 )(0.5968 )(0.691 )(1e-04 )(0.1078 )(0.4341 )(0.1696 )
Estimates ( 2 )0.81550.14130-0.83760.4104-0.172-0.9998
(p-val)(3e-04 )(0.3844 )(NA )(0 )(0.0877 )(0.4356 )(0.1234 )
Estimates ( 3 )0.80770.14020-0.82990.47860-1.0001
(p-val)(2e-04 )(0.3838 )(NA )(0 )(0.0369 )(NA )(0.0106 )
Estimates ( 4 )0.963700-0.8730.45260-0.9996
(p-val)(0 )(NA )(NA )(0 )(0.0422 )(NA )(0.0101 )
Estimates ( 5 )NANANANANANANA
(p-val)(NA )(NA )(NA )(NA )(NA )(NA )(NA )
Estimates ( 6 )NANANANANANANA
(p-val)(NA )(NA )(NA )(NA )(NA )(NA )(NA )
Estimates ( 7 )NANANANANANANA
(p-val)(NA )(NA )(NA )(NA )(NA )(NA )(NA )
Estimates ( 8 )NANANANANANANA
(p-val)(NA )(NA )(NA )(NA )(NA )(NA )(NA )
Estimates ( 9 )NANANANANANANA
(p-val)(NA )(NA )(NA )(NA )(NA )(NA )(NA )
Estimates ( 10 )NANANANANANANA
(p-val)(NA )(NA )(NA )(NA )(NA )(NA )(NA )
Estimates ( 11 )NANANANANANANA
(p-val)(NA )(NA )(NA )(NA )(NA )(NA )(NA )
Estimates ( 12 )NANANANANANANA
(p-val)(NA )(NA )(NA )(NA )(NA )(NA )(NA )
Estimates ( 13 )NANANANANANANA
(p-val)(NA )(NA )(NA )(NA )(NA )(NA )(NA )


Estimated ARIMA Residuals
Value
-1826.19473246964
-5216.08134293613
-10300.6259388835
638.056088509834
2408.70987414021
1883.3551332782
2269.2514680567
-2999.59039393132
1156.51903666734
-7059.58995717675
-1966.82299481166
-11781.0917945346
1140.80355182764
1695.33644224559
130.978085965204
190.563925430686
-2909.61247020703
6672.8123469344
6000.54391018057
-1374.85071874591
-4270.14841595019
-3654.66872345336
-4720.92886855338
-17190.8058535323
-3701.07911114717
-6995.53662620401
7498.90408806358
-4093.1093598758
-5216.45710762845
4523.61005767473
-7327.09027426152
-10386.0263384616
10900.4843183992
4840.38014262320
-15079.1385172710
10082.7591688010
6678.82887812925
10104.9559757876
1736.05178900258
-655.387603802414
-1166.69980805814
4717.24039044193
-8289.75170447547
13363.5832290303
-2268.31088290905
-5918.51939741885
-1225.58621110934
1977.12571917049
12295.6040216033

\begin{tabular}{lllllllll}
\hline
Estimated ARIMA Residuals \tabularnewline
Value \tabularnewline
-1826.19473246964 \tabularnewline
-5216.08134293613 \tabularnewline
-10300.6259388835 \tabularnewline
638.056088509834 \tabularnewline
2408.70987414021 \tabularnewline
1883.3551332782 \tabularnewline
2269.2514680567 \tabularnewline
-2999.59039393132 \tabularnewline
1156.51903666734 \tabularnewline
-7059.58995717675 \tabularnewline
-1966.82299481166 \tabularnewline
-11781.0917945346 \tabularnewline
1140.80355182764 \tabularnewline
1695.33644224559 \tabularnewline
130.978085965204 \tabularnewline
190.563925430686 \tabularnewline
-2909.61247020703 \tabularnewline
6672.8123469344 \tabularnewline
6000.54391018057 \tabularnewline
-1374.85071874591 \tabularnewline
-4270.14841595019 \tabularnewline
-3654.66872345336 \tabularnewline
-4720.92886855338 \tabularnewline
-17190.8058535323 \tabularnewline
-3701.07911114717 \tabularnewline
-6995.53662620401 \tabularnewline
7498.90408806358 \tabularnewline
-4093.1093598758 \tabularnewline
-5216.45710762845 \tabularnewline
4523.61005767473 \tabularnewline
-7327.09027426152 \tabularnewline
-10386.0263384616 \tabularnewline
10900.4843183992 \tabularnewline
4840.38014262320 \tabularnewline
-15079.1385172710 \tabularnewline
10082.7591688010 \tabularnewline
6678.82887812925 \tabularnewline
10104.9559757876 \tabularnewline
1736.05178900258 \tabularnewline
-655.387603802414 \tabularnewline
-1166.69980805814 \tabularnewline
4717.24039044193 \tabularnewline
-8289.75170447547 \tabularnewline
13363.5832290303 \tabularnewline
-2268.31088290905 \tabularnewline
-5918.51939741885 \tabularnewline
-1225.58621110934 \tabularnewline
1977.12571917049 \tabularnewline
12295.6040216033 \tabularnewline
\hline
\end{tabular}
%Source: https://freestatistics.org/blog/index.php?pk=35781&T=2

[TABLE]
[ROW][C]Estimated ARIMA Residuals[/C][/ROW]
[ROW][C]Value[/C][/ROW]
[ROW][C]-1826.19473246964[/C][/ROW]
[ROW][C]-5216.08134293613[/C][/ROW]
[ROW][C]-10300.6259388835[/C][/ROW]
[ROW][C]638.056088509834[/C][/ROW]
[ROW][C]2408.70987414021[/C][/ROW]
[ROW][C]1883.3551332782[/C][/ROW]
[ROW][C]2269.2514680567[/C][/ROW]
[ROW][C]-2999.59039393132[/C][/ROW]
[ROW][C]1156.51903666734[/C][/ROW]
[ROW][C]-7059.58995717675[/C][/ROW]
[ROW][C]-1966.82299481166[/C][/ROW]
[ROW][C]-11781.0917945346[/C][/ROW]
[ROW][C]1140.80355182764[/C][/ROW]
[ROW][C]1695.33644224559[/C][/ROW]
[ROW][C]130.978085965204[/C][/ROW]
[ROW][C]190.563925430686[/C][/ROW]
[ROW][C]-2909.61247020703[/C][/ROW]
[ROW][C]6672.8123469344[/C][/ROW]
[ROW][C]6000.54391018057[/C][/ROW]
[ROW][C]-1374.85071874591[/C][/ROW]
[ROW][C]-4270.14841595019[/C][/ROW]
[ROW][C]-3654.66872345336[/C][/ROW]
[ROW][C]-4720.92886855338[/C][/ROW]
[ROW][C]-17190.8058535323[/C][/ROW]
[ROW][C]-3701.07911114717[/C][/ROW]
[ROW][C]-6995.53662620401[/C][/ROW]
[ROW][C]7498.90408806358[/C][/ROW]
[ROW][C]-4093.1093598758[/C][/ROW]
[ROW][C]-5216.45710762845[/C][/ROW]
[ROW][C]4523.61005767473[/C][/ROW]
[ROW][C]-7327.09027426152[/C][/ROW]
[ROW][C]-10386.0263384616[/C][/ROW]
[ROW][C]10900.4843183992[/C][/ROW]
[ROW][C]4840.38014262320[/C][/ROW]
[ROW][C]-15079.1385172710[/C][/ROW]
[ROW][C]10082.7591688010[/C][/ROW]
[ROW][C]6678.82887812925[/C][/ROW]
[ROW][C]10104.9559757876[/C][/ROW]
[ROW][C]1736.05178900258[/C][/ROW]
[ROW][C]-655.387603802414[/C][/ROW]
[ROW][C]-1166.69980805814[/C][/ROW]
[ROW][C]4717.24039044193[/C][/ROW]
[ROW][C]-8289.75170447547[/C][/ROW]
[ROW][C]13363.5832290303[/C][/ROW]
[ROW][C]-2268.31088290905[/C][/ROW]
[ROW][C]-5918.51939741885[/C][/ROW]
[ROW][C]-1225.58621110934[/C][/ROW]
[ROW][C]1977.12571917049[/C][/ROW]
[ROW][C]12295.6040216033[/C][/ROW]
[/TABLE]
Source: https://freestatistics.org/blog/index.php?pk=35781&T=2

Globally Unique Identifier (entire table): ba.freestatistics.org/blog/index.php?pk=35781&T=2

As an alternative you can also use a QR Code:  

The GUIDs for individual cells are displayed in the table below:

Estimated ARIMA Residuals
Value
-1826.19473246964
-5216.08134293613
-10300.6259388835
638.056088509834
2408.70987414021
1883.3551332782
2269.2514680567
-2999.59039393132
1156.51903666734
-7059.58995717675
-1966.82299481166
-11781.0917945346
1140.80355182764
1695.33644224559
130.978085965204
190.563925430686
-2909.61247020703
6672.8123469344
6000.54391018057
-1374.85071874591
-4270.14841595019
-3654.66872345336
-4720.92886855338
-17190.8058535323
-3701.07911114717
-6995.53662620401
7498.90408806358
-4093.1093598758
-5216.45710762845
4523.61005767473
-7327.09027426152
-10386.0263384616
10900.4843183992
4840.38014262320
-15079.1385172710
10082.7591688010
6678.82887812925
10104.9559757876
1736.05178900258
-655.387603802414
-1166.69980805814
4717.24039044193
-8289.75170447547
13363.5832290303
-2268.31088290905
-5918.51939741885
-1225.58621110934
1977.12571917049
12295.6040216033


Parameters (Session):
par1 = FALSE ; par2 = 1 ; par3 = 1 ; par4 = 1 ; par5 = 12 ; par6 = 3 ; par7 = 1 ; par8 = 2 ; par9 = 1 ;
Parameters (R input):
par1 = FALSE ; par2 = 1 ; par3 = 1 ; par4 = 1 ; par5 = 12 ; par6 = 3 ; par7 = 1 ; par8 = 2 ; par9 = 1 ;
R code (references can be found in the software module):
library(lattice)
if (par1 == 'TRUE') par1 <- TRUE
if (par1 == 'FALSE') par1 <- FALSE
par2 <- as.numeric(par2) #Box-Cox lambda transformation parameter
par3 <- as.numeric(par3) #degree of non-seasonal differencing
par4 <- as.numeric(par4) #degree of seasonal differencing
par5 <- as.numeric(par5) #seasonal period
par6 <- as.numeric(par6) #degree (p) of the non-seasonal AR(p) polynomial
par7 <- as.numeric(par7) #degree (q) of the non-seasonal MA(q) polynomial
par8 <- as.numeric(par8) #degree (P) of the seasonal AR(P) polynomial
par9 <- as.numeric(par9) #degree (Q) of the seasonal MA(Q) polynomial
armaGR <- function(arima.out, names, n){
try1 <- arima.out$coef
try2 <- sqrt(diag(arima.out$var.coef))
try.data.frame <- data.frame(matrix(NA,ncol=4,nrow=length(names)))
dimnames(try.data.frame) <- list(names,c('coef','std','tstat','pv'))
try.data.frame[,1] <- try1
for(i in 1:length(try2)) try.data.frame[which(rownames(try.data.frame)==names(try2)[i]),2] <- try2[i]
try.data.frame[,3] <- try.data.frame[,1] / try.data.frame[,2]
try.data.frame[,4] <- round((1-pt(abs(try.data.frame[,3]),df=n-(length(try2)+1)))*2,5)
vector <- rep(NA,length(names))
vector[is.na(try.data.frame[,4])] <- 0
maxi <- which.max(try.data.frame[,4])
continue <- max(try.data.frame[,4],na.rm=TRUE) > .05
vector[maxi] <- 0
list(summary=try.data.frame,next.vector=vector,continue=continue)
}
arimaSelect <- function(series, order=c(13,0,0), seasonal=list(order=c(2,0,0),period=12), include.mean=F){
nrc <- order[1]+order[3]+seasonal$order[1]+seasonal$order[3]
coeff <- matrix(NA, nrow=nrc*2, ncol=nrc)
pval <- matrix(NA, nrow=nrc*2, ncol=nrc)
mylist <- rep(list(NULL), nrc)
names <- NULL
if(order[1] > 0) names <- paste('ar',1:order[1],sep='')
if(order[3] > 0) names <- c( names , paste('ma',1:order[3],sep='') )
if(seasonal$order[1] > 0) names <- c(names, paste('sar',1:seasonal$order[1],sep=''))
if(seasonal$order[3] > 0) names <- c(names, paste('sma',1:seasonal$order[3],sep=''))
arima.out <- arima(series, order=order, seasonal=seasonal, include.mean=include.mean, method='ML')
mylist[[1]] <- arima.out
last.arma <- armaGR(arima.out, names, length(series))
mystop <- FALSE
i <- 1
coeff[i,] <- last.arma[[1]][,1]
pval [i,] <- last.arma[[1]][,4]
i <- 2
aic <- arima.out$aic
while(!mystop){
mylist[[i]] <- arima.out
arima.out <- arima(series, order=order, seasonal=seasonal, include.mean=include.mean, method='ML', fixed=last.arma$next.vector)
aic <- c(aic, arima.out$aic)
last.arma <- armaGR(arima.out, names, length(series))
mystop <- !last.arma$continue
coeff[i,] <- last.arma[[1]][,1]
pval [i,] <- last.arma[[1]][,4]
i <- i+1
}
list(coeff, pval, mylist, aic=aic)
}
arimaSelectplot <- function(arimaSelect.out,noms,choix){
noms <- names(arimaSelect.out[[3]][[1]]$coef)
coeff <- arimaSelect.out[[1]]
k <- min(which(is.na(coeff[,1])))-1
coeff <- coeff[1:k,]
pval <- arimaSelect.out[[2]][1:k,]
aic <- arimaSelect.out$aic[1:k]
coeff[coeff==0] <- NA
n <- ncol(coeff)
if(missing(choix)) choix <- k
layout(matrix(c(1,1,1,2,
3,3,3,2,
3,3,3,4,
5,6,7,7),nr=4),
widths=c(10,35,45,15),
heights=c(30,30,15,15))
couleurs <- rainbow(75)[1:50]#(50)
ticks <- pretty(coeff)
par(mar=c(1,1,3,1))
plot(aic,k:1-.5,type='o',pch=21,bg='blue',cex=2,axes=F,lty=2,xpd=NA)
points(aic[choix],k-choix+.5,pch=21,cex=4,bg=2,xpd=NA)
title('aic',line=2)
par(mar=c(3,0,0,0))
plot(0,axes=F,xlab='',ylab='',xlim=range(ticks),ylim=c(.1,1))
rect(xleft = min(ticks) + (0:49)/50*(max(ticks)-min(ticks)),
xright = min(ticks) + (1:50)/50*(max(ticks)-min(ticks)),
ytop = rep(1,50),
ybottom= rep(0,50),col=couleurs,border=NA)
axis(1,ticks)
rect(xleft=min(ticks),xright=max(ticks),ytop=1,ybottom=0)
text(mean(coeff,na.rm=T),.5,'coefficients',cex=2,font=2)
par(mar=c(1,1,3,1))
image(1:n,1:k,t(coeff[k:1,]),axes=F,col=couleurs,zlim=range(ticks))
for(i in 1:n) for(j in 1:k) if(!is.na(coeff[j,i])) {
if(pval[j,i]<.01) symb = 'green'
else if( (pval[j,i]<.05) & (pval[j,i]>=.01)) symb = 'orange'
else if( (pval[j,i]<.1) & (pval[j,i]>=.05)) symb = 'red'
else symb = 'black'
polygon(c(i+.5 ,i+.2 ,i+.5 ,i+.5),
c(k-j+0.5,k-j+0.5,k-j+0.8,k-j+0.5),
col=symb)
if(j==choix) {
rect(xleft=i-.5,
xright=i+.5,
ybottom=k-j+1.5,
ytop=k-j+.5,
lwd=4)
text(i,
k-j+1,
round(coeff[j,i],2),
cex=1.2,
font=2)
}
else{
rect(xleft=i-.5,xright=i+.5,ybottom=k-j+1.5,ytop=k-j+.5)
text(i,k-j+1,round(coeff[j,i],2),cex=1.2,font=1)
}
}
axis(3,1:n,noms)
par(mar=c(0.5,0,0,0.5))
plot(0,axes=F,xlab='',ylab='',type='n',xlim=c(0,8),ylim=c(-.2,.8))
cols <- c('green','orange','red','black')
niv <- c('0','0.01','0.05','0.1')
for(i in 0:3){
polygon(c(1+2*i ,1+2*i ,1+2*i-.5 ,1+2*i),
c(.4 ,.7 , .4 , .4),
col=cols[i+1])
text(2*i,0.5,niv[i+1],cex=1.5)
}
text(8,.5,1,cex=1.5)
text(4,0,'p-value',cex=2)
box()
residus <- arimaSelect.out[[3]][[choix]]$res
par(mar=c(1,2,4,1))
acf(residus,main='')
title('acf',line=.5)
par(mar=c(1,2,4,1))
pacf(residus,main='')
title('pacf',line=.5)
par(mar=c(2,2,4,1))
qqnorm(residus,main='')
title('qq-norm',line=.5)
qqline(residus)
residus
}
if (par2 == 0) x <- log(x)
if (par2 != 0) x <- x^par2
(selection <- arimaSelect(x, order=c(par6,par3,par7), seasonal=list(order=c(par8,par4,par9), period=par5)))
bitmap(file='test1.png')
resid <- arimaSelectplot(selection)
dev.off()
resid
bitmap(file='test2.png')
acf(resid,length(resid)/2, main='Residual Autocorrelation Function')
dev.off()
bitmap(file='test3.png')
pacf(resid,length(resid)/2, main='Residual Partial Autocorrelation Function')
dev.off()
bitmap(file='test4.png')
cpgram(resid, main='Residual Cumulative Periodogram')
dev.off()
bitmap(file='test5.png')
hist(resid, main='Residual Histogram', xlab='values of Residuals')
dev.off()
bitmap(file='test6.png')
densityplot(~resid,col='black',main='Residual Density Plot', xlab='values of Residuals')
dev.off()
bitmap(file='test7.png')
qqnorm(resid, main='Residual Normal Q-Q Plot')
qqline(resid)
dev.off()
ncols <- length(selection[[1]][1,])
nrows <- length(selection[[2]][,1])-1
load(file='createtable')
a<-table.start()
a<-table.row.start(a)
a<-table.element(a,'ARIMA Parameter Estimation and Backward Selection', ncols+1,TRUE)
a<-table.row.end(a)
a<-table.row.start(a)
a<-table.element(a,'Iteration', header=TRUE)
for (i in 1:ncols) {
a<-table.element(a,names(selection[[3]][[1]]$coef)[i],header=TRUE)
}
a<-table.row.end(a)
for (j in 1:nrows) {
a<-table.row.start(a)
mydum <- 'Estimates ('
mydum <- paste(mydum,j)
mydum <- paste(mydum,')')
a<-table.element(a,mydum, header=TRUE)
for (i in 1:ncols) {
a<-table.element(a,round(selection[[1]][j,i],4))
}
a<-table.row.end(a)
a<-table.row.start(a)
a<-table.element(a,'(p-val)', header=TRUE)
for (i in 1:ncols) {
mydum <- '('
mydum <- paste(mydum,round(selection[[2]][j,i],4),sep='')
mydum <- paste(mydum,')')
a<-table.element(a,mydum)
}
a<-table.row.end(a)
}
a<-table.end(a)
table.save(a,file='mytable.tab')
a<-table.start()
a<-table.row.start(a)
a<-table.element(a,'Estimated ARIMA Residuals', 1,TRUE)
a<-table.row.end(a)
a<-table.row.start(a)
a<-table.element(a,'Value', 1,TRUE)
a<-table.row.end(a)
for (i in (par4*par5+par3):length(resid)) {
a<-table.row.start(a)
a<-table.element(a,resid[i])
a<-table.row.end(a)
}
a<-table.end(a)
table.save(a,file='mytable1.tab')