Free Statistics

of Irreproducible Research!

Author's title

Author*Unverified author*
R Software Modulerwasp_autocorrelation.wasp
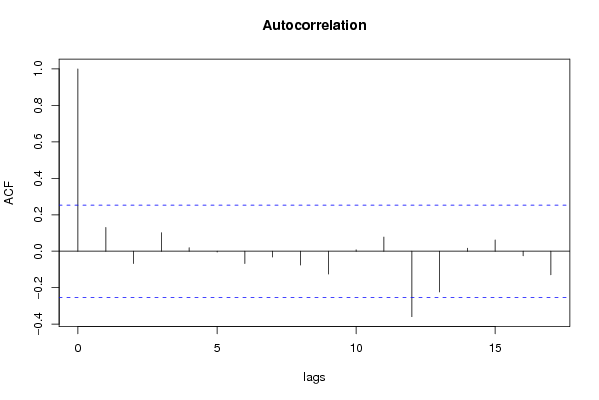
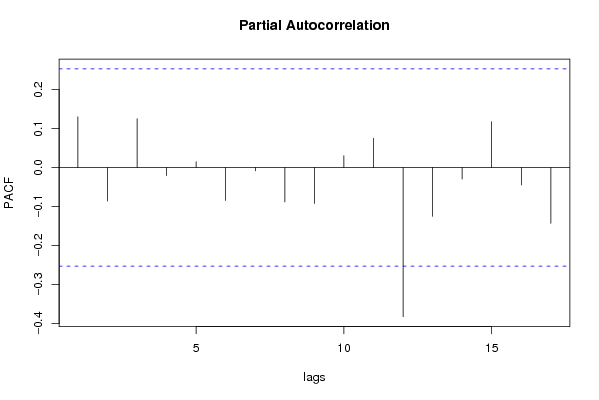
Title produced by software(Partial) Autocorrelation Function
Date of computationSun, 21 Dec 2008 12:08:42 -0700
Cite this page as followsStatistical Computations at FreeStatistics.org, Office for Research Development and Education, URL https://freestatistics.org/blog/index.php?v=date/2008/Dec/21/t1229886548re6xm3xi6emi6b9.htm/, Retrieved Fri, 17 May 2024 03:04:10 +0000
Statistical Computations at FreeStatistics.org, Office for Research Development and Education, URL https://freestatistics.org/blog/index.php?pk=35766, Retrieved Fri, 17 May 2024 03:04:10 +0000
QR Codes:

Original text written by user:
IsPrivate?No (this computation is public)
User-defined keywords
Estimated Impact141
Family? (F = Feedback message, R = changed R code, M = changed R Module, P = changed Parameters, D = changed Data)
F       [(Partial) Autocorrelation Function] [] [2008-12-21 19:08:42] [d41d8cd98f00b204e9800998ecf8427e] [Current]
Feedback Forum
2009-01-08 13:05:10 [Aurélie Van Impe] [reply
Dat klopt inderdaad maar je legt niet uit hoe je dat kan zien. Je gaat er vanuit dat de lezer weet naar waar hij moet kijken. Je had nog kunnen zeggen dat de streepjes nu zo goed als allemaal binnen het betrouwbaarheidsinterval liggen. En dat het wel degelijk over een trend op lange termijn gaat.

Post a new message
Dataseries X:
1.8
1.7
1.4
1.2
1
1.7
2.4
2
2.1
2
1.8
2.7
2.3
1.9
2
2.3
2.8
2.4
2.3
2.7
2.7
2.9
3
2.2
2.3
2.8
2.8
2.8
2.2
2.6
2.8
2.5
2.4
2.3
1.9
1.7
2
2.1
1.7
1.8
1.8
1.8
1.3
1.3
1.3
1.2
1.4
2.2
2.9
3.1
3.5
3.6
4.4
4.1
5.1
5.8
5.9
5.4
5.5
4.8
3.2


Summary of computational transaction
Raw Inputview raw input (R code)
Raw Outputview raw output of R engine
Computing time2 seconds
R Server'Sir Ronald Aylmer Fisher' @ 193.190.124.24

\begin{tabular}{lllllllll}
\hline
Summary of computational transaction \tabularnewline
Raw Input & view raw input (R code)  \tabularnewline
Raw Output & view raw output of R engine  \tabularnewline
Computing time & 2 seconds \tabularnewline
R Server & 'Sir Ronald Aylmer Fisher' @ 193.190.124.24 \tabularnewline
\hline
\end{tabular}
%Source: https://freestatistics.org/blog/index.php?pk=35766&T=0

[TABLE]
[ROW][C]Summary of computational transaction[/C][/ROW]
[ROW][C]Raw Input[/C][C]view raw input (R code) [/C][/ROW]
[ROW][C]Raw Output[/C][C]view raw output of R engine [/C][/ROW]
[ROW][C]Computing time[/C][C]2 seconds[/C][/ROW]
[ROW][C]R Server[/C][C]'Sir Ronald Aylmer Fisher' @ 193.190.124.24[/C][/ROW]
[/TABLE]
Source: https://freestatistics.org/blog/index.php?pk=35766&T=0

Globally Unique Identifier (entire table): ba.freestatistics.org/blog/index.php?pk=35766&T=0

As an alternative you can also use a QR Code:  

The GUIDs for individual cells are displayed in the table below:

Summary of computational transaction
Raw Inputview raw input (R code)
Raw Outputview raw output of R engine
Computing time2 seconds
R Server'Sir Ronald Aylmer Fisher' @ 193.190.124.24


Autocorrelation Function
Time lag kACF(k)T-STATP-value
10.1301261.0080.158762
2-0.067332-0.52160.301952
30.1014190.78560.2176
40.0187880.14550.442389
5-0.004698-0.03640.485545
6-0.067293-0.52120.302057
7-0.031609-0.24480.403708
8-0.075481-0.58470.280481
9-0.124905-0.96750.168587
100.0076350.05910.476517
110.0776250.60130.274958
12-0.358929-2.78030.003623
13-0.223224-1.72910.044468
140.0166070.12860.449038
150.0617590.47840.317058
16-0.025244-0.19550.422817
17-0.129037-0.99950.160779

\begin{tabular}{lllllllll}
\hline
Autocorrelation Function \tabularnewline
Time lag k & ACF(k) & T-STAT & P-value \tabularnewline
1 & 0.130126 & 1.008 & 0.158762 \tabularnewline
2 & -0.067332 & -0.5216 & 0.301952 \tabularnewline
3 & 0.101419 & 0.7856 & 0.2176 \tabularnewline
4 & 0.018788 & 0.1455 & 0.442389 \tabularnewline
5 & -0.004698 & -0.0364 & 0.485545 \tabularnewline
6 & -0.067293 & -0.5212 & 0.302057 \tabularnewline
7 & -0.031609 & -0.2448 & 0.403708 \tabularnewline
8 & -0.075481 & -0.5847 & 0.280481 \tabularnewline
9 & -0.124905 & -0.9675 & 0.168587 \tabularnewline
10 & 0.007635 & 0.0591 & 0.476517 \tabularnewline
11 & 0.077625 & 0.6013 & 0.274958 \tabularnewline
12 & -0.358929 & -2.7803 & 0.003623 \tabularnewline
13 & -0.223224 & -1.7291 & 0.044468 \tabularnewline
14 & 0.016607 & 0.1286 & 0.449038 \tabularnewline
15 & 0.061759 & 0.4784 & 0.317058 \tabularnewline
16 & -0.025244 & -0.1955 & 0.422817 \tabularnewline
17 & -0.129037 & -0.9995 & 0.160779 \tabularnewline
\hline
\end{tabular}
%Source: https://freestatistics.org/blog/index.php?pk=35766&T=1

[TABLE]
[ROW][C]Autocorrelation Function[/C][/ROW]
[ROW][C]Time lag k[/C][C]ACF(k)[/C][C]T-STAT[/C][C]P-value[/C][/ROW]
[ROW][C]1[/C][C]0.130126[/C][C]1.008[/C][C]0.158762[/C][/ROW]
[ROW][C]2[/C][C]-0.067332[/C][C]-0.5216[/C][C]0.301952[/C][/ROW]
[ROW][C]3[/C][C]0.101419[/C][C]0.7856[/C][C]0.2176[/C][/ROW]
[ROW][C]4[/C][C]0.018788[/C][C]0.1455[/C][C]0.442389[/C][/ROW]
[ROW][C]5[/C][C]-0.004698[/C][C]-0.0364[/C][C]0.485545[/C][/ROW]
[ROW][C]6[/C][C]-0.067293[/C][C]-0.5212[/C][C]0.302057[/C][/ROW]
[ROW][C]7[/C][C]-0.031609[/C][C]-0.2448[/C][C]0.403708[/C][/ROW]
[ROW][C]8[/C][C]-0.075481[/C][C]-0.5847[/C][C]0.280481[/C][/ROW]
[ROW][C]9[/C][C]-0.124905[/C][C]-0.9675[/C][C]0.168587[/C][/ROW]
[ROW][C]10[/C][C]0.007635[/C][C]0.0591[/C][C]0.476517[/C][/ROW]
[ROW][C]11[/C][C]0.077625[/C][C]0.6013[/C][C]0.274958[/C][/ROW]
[ROW][C]12[/C][C]-0.358929[/C][C]-2.7803[/C][C]0.003623[/C][/ROW]
[ROW][C]13[/C][C]-0.223224[/C][C]-1.7291[/C][C]0.044468[/C][/ROW]
[ROW][C]14[/C][C]0.016607[/C][C]0.1286[/C][C]0.449038[/C][/ROW]
[ROW][C]15[/C][C]0.061759[/C][C]0.4784[/C][C]0.317058[/C][/ROW]
[ROW][C]16[/C][C]-0.025244[/C][C]-0.1955[/C][C]0.422817[/C][/ROW]
[ROW][C]17[/C][C]-0.129037[/C][C]-0.9995[/C][C]0.160779[/C][/ROW]
[/TABLE]
Source: https://freestatistics.org/blog/index.php?pk=35766&T=1

Globally Unique Identifier (entire table): ba.freestatistics.org/blog/index.php?pk=35766&T=1

As an alternative you can also use a QR Code:  

The GUIDs for individual cells are displayed in the table below:

Autocorrelation Function
Time lag kACF(k)T-STATP-value
10.1301261.0080.158762
2-0.067332-0.52160.301952
30.1014190.78560.2176
40.0187880.14550.442389
5-0.004698-0.03640.485545
6-0.067293-0.52120.302057
7-0.031609-0.24480.403708
8-0.075481-0.58470.280481
9-0.124905-0.96750.168587
100.0076350.05910.476517
110.0776250.60130.274958
12-0.358929-2.78030.003623
13-0.223224-1.72910.044468
140.0166070.12860.449038
150.0617590.47840.317058
16-0.025244-0.19550.422817
17-0.129037-0.99950.160779


Partial Autocorrelation Function
Time lag kPACF(k)T-STATP-value
10.1301261.0080.158762
2-0.085716-0.6640.254632
30.1251080.96910.168198
4-0.020685-0.16020.436622
50.0150250.11640.453867
6-0.084607-0.65540.257369
7-0.008499-0.06580.473865
8-0.088071-0.68220.24887
9-0.091963-0.71230.239507
100.0305510.23660.406868
110.0751680.58230.28129
12-0.38259-2.96350.002178
13-0.12512-0.96920.168174
14-0.029621-0.22940.409652
150.117390.90930.183416
16-0.04457-0.34520.365562
17-0.142768-1.10590.136598

\begin{tabular}{lllllllll}
\hline
Partial Autocorrelation Function \tabularnewline
Time lag k & PACF(k) & T-STAT & P-value \tabularnewline
1 & 0.130126 & 1.008 & 0.158762 \tabularnewline
2 & -0.085716 & -0.664 & 0.254632 \tabularnewline
3 & 0.125108 & 0.9691 & 0.168198 \tabularnewline
4 & -0.020685 & -0.1602 & 0.436622 \tabularnewline
5 & 0.015025 & 0.1164 & 0.453867 \tabularnewline
6 & -0.084607 & -0.6554 & 0.257369 \tabularnewline
7 & -0.008499 & -0.0658 & 0.473865 \tabularnewline
8 & -0.088071 & -0.6822 & 0.24887 \tabularnewline
9 & -0.091963 & -0.7123 & 0.239507 \tabularnewline
10 & 0.030551 & 0.2366 & 0.406868 \tabularnewline
11 & 0.075168 & 0.5823 & 0.28129 \tabularnewline
12 & -0.38259 & -2.9635 & 0.002178 \tabularnewline
13 & -0.12512 & -0.9692 & 0.168174 \tabularnewline
14 & -0.029621 & -0.2294 & 0.409652 \tabularnewline
15 & 0.11739 & 0.9093 & 0.183416 \tabularnewline
16 & -0.04457 & -0.3452 & 0.365562 \tabularnewline
17 & -0.142768 & -1.1059 & 0.136598 \tabularnewline
\hline
\end{tabular}
%Source: https://freestatistics.org/blog/index.php?pk=35766&T=2

[TABLE]
[ROW][C]Partial Autocorrelation Function[/C][/ROW]
[ROW][C]Time lag k[/C][C]PACF(k)[/C][C]T-STAT[/C][C]P-value[/C][/ROW]
[ROW][C]1[/C][C]0.130126[/C][C]1.008[/C][C]0.158762[/C][/ROW]
[ROW][C]2[/C][C]-0.085716[/C][C]-0.664[/C][C]0.254632[/C][/ROW]
[ROW][C]3[/C][C]0.125108[/C][C]0.9691[/C][C]0.168198[/C][/ROW]
[ROW][C]4[/C][C]-0.020685[/C][C]-0.1602[/C][C]0.436622[/C][/ROW]
[ROW][C]5[/C][C]0.015025[/C][C]0.1164[/C][C]0.453867[/C][/ROW]
[ROW][C]6[/C][C]-0.084607[/C][C]-0.6554[/C][C]0.257369[/C][/ROW]
[ROW][C]7[/C][C]-0.008499[/C][C]-0.0658[/C][C]0.473865[/C][/ROW]
[ROW][C]8[/C][C]-0.088071[/C][C]-0.6822[/C][C]0.24887[/C][/ROW]
[ROW][C]9[/C][C]-0.091963[/C][C]-0.7123[/C][C]0.239507[/C][/ROW]
[ROW][C]10[/C][C]0.030551[/C][C]0.2366[/C][C]0.406868[/C][/ROW]
[ROW][C]11[/C][C]0.075168[/C][C]0.5823[/C][C]0.28129[/C][/ROW]
[ROW][C]12[/C][C]-0.38259[/C][C]-2.9635[/C][C]0.002178[/C][/ROW]
[ROW][C]13[/C][C]-0.12512[/C][C]-0.9692[/C][C]0.168174[/C][/ROW]
[ROW][C]14[/C][C]-0.029621[/C][C]-0.2294[/C][C]0.409652[/C][/ROW]
[ROW][C]15[/C][C]0.11739[/C][C]0.9093[/C][C]0.183416[/C][/ROW]
[ROW][C]16[/C][C]-0.04457[/C][C]-0.3452[/C][C]0.365562[/C][/ROW]
[ROW][C]17[/C][C]-0.142768[/C][C]-1.1059[/C][C]0.136598[/C][/ROW]
[/TABLE]
Source: https://freestatistics.org/blog/index.php?pk=35766&T=2

Globally Unique Identifier (entire table): ba.freestatistics.org/blog/index.php?pk=35766&T=2

As an alternative you can also use a QR Code:  

The GUIDs for individual cells are displayed in the table below:

Partial Autocorrelation Function
Time lag kPACF(k)T-STATP-value
10.1301261.0080.158762
2-0.085716-0.6640.254632
30.1251080.96910.168198
4-0.020685-0.16020.436622
50.0150250.11640.453867
6-0.084607-0.65540.257369
7-0.008499-0.06580.473865
8-0.088071-0.68220.24887
9-0.091963-0.71230.239507
100.0305510.23660.406868
110.0751680.58230.28129
12-0.38259-2.96350.002178
13-0.12512-0.96920.168174
14-0.029621-0.22940.409652
150.117390.90930.183416
16-0.04457-0.34520.365562
17-0.142768-1.10590.136598


Parameters (Session):
par1 = Default ; par2 = 1 ; par3 = 1 ; par4 = 0 ; par5 = 12 ;
Parameters (R input):
par1 = Default ; par2 = 1 ; par3 = 1 ; par4 = 0 ; par5 = 12 ;
R code (references can be found in the software module):
if (par1 == 'Default') {
par1 = 10*log10(length(x))
} else {
par1 <- as.numeric(par1)
}
par2 <- as.numeric(par2)
par3 <- as.numeric(par3)
par4 <- as.numeric(par4)
par5 <- as.numeric(par5)
if (par2 == 0) {
x <- log(x)
} else {
x <- (x ^ par2 - 1) / par2
}
if (par3 > 0) x <- diff(x,lag=1,difference=par3)
if (par4 > 0) x <- diff(x,lag=par5,difference=par4)
bitmap(file='pic1.png')
racf <- acf(x,par1,main='Autocorrelation',xlab='lags',ylab='ACF')
dev.off()
bitmap(file='pic2.png')
rpacf <- pacf(x,par1,main='Partial Autocorrelation',xlab='lags',ylab='PACF')
dev.off()
(myacf <- c(racf$acf))
(mypacf <- c(rpacf$acf))
lengthx <- length(x)
sqrtn <- sqrt(lengthx)
load(file='createtable')
a<-table.start()
a<-table.row.start(a)
a<-table.element(a,'Autocorrelation Function',4,TRUE)
a<-table.row.end(a)
a<-table.row.start(a)
a<-table.element(a,'Time lag k',header=TRUE)
a<-table.element(a,hyperlink('basics.htm','ACF(k)','click here for more information about the Autocorrelation Function'),header=TRUE)
a<-table.element(a,'T-STAT',header=TRUE)
a<-table.element(a,'P-value',header=TRUE)
a<-table.row.end(a)
for (i in 2:(par1+1)) {
a<-table.row.start(a)
a<-table.element(a,i-1,header=TRUE)
a<-table.element(a,round(myacf[i],6))
mytstat <- myacf[i]*sqrtn
a<-table.element(a,round(mytstat,4))
a<-table.element(a,round(1-pt(abs(mytstat),lengthx),6))
a<-table.row.end(a)
}
a<-table.end(a)
table.save(a,file='mytable.tab')
a<-table.start()
a<-table.row.start(a)
a<-table.element(a,'Partial Autocorrelation Function',4,TRUE)
a<-table.row.end(a)
a<-table.row.start(a)
a<-table.element(a,'Time lag k',header=TRUE)
a<-table.element(a,hyperlink('basics.htm','PACF(k)','click here for more information about the Partial Autocorrelation Function'),header=TRUE)
a<-table.element(a,'T-STAT',header=TRUE)
a<-table.element(a,'P-value',header=TRUE)
a<-table.row.end(a)
for (i in 1:par1) {
a<-table.row.start(a)
a<-table.element(a,i,header=TRUE)
a<-table.element(a,round(mypacf[i],6))
mytstat <- mypacf[i]*sqrtn
a<-table.element(a,round(mytstat,4))
a<-table.element(a,round(1-pt(abs(mytstat),lengthx),6))
a<-table.row.end(a)
}
a<-table.end(a)
table.save(a,file='mytable1.tab')