Free Statistics

of Irreproducible Research!

Author's title

Author*The author of this computation has been verified*
R Software Modulerwasp_cross.wasp
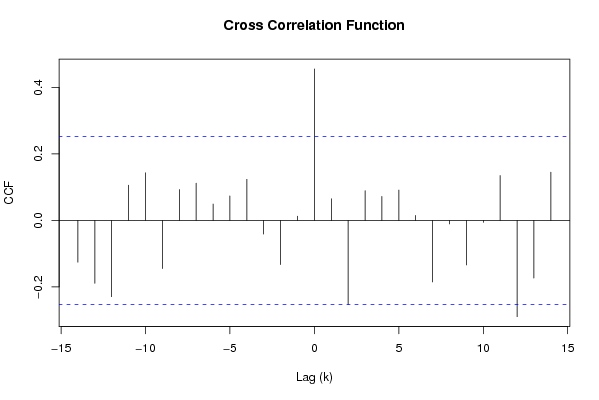
Title produced by softwareCross Correlation Function
Date of computationSun, 21 Dec 2008 10:56:34 -0700
Cite this page as followsStatistical Computations at FreeStatistics.org, Office for Research Development and Education, URL https://freestatistics.org/blog/index.php?v=date/2008/Dec/21/t1229882416yzrehr6m0syygtv.htm/, Retrieved Fri, 17 May 2024 07:01:05 +0000
Statistical Computations at FreeStatistics.org, Office for Research Development and Education, URL https://freestatistics.org/blog/index.php?pk=35718, Retrieved Fri, 17 May 2024 07:01:05 +0000
QR Codes:

Original text written by user:
IsPrivate?No (this computation is public)
User-defined keywords
Estimated Impact131
Family? (F = Feedback message, R = changed R code, M = changed R Module, P = changed Parameters, D = changed Data)
-       [Cross Correlation Function] [Paper Cross Corre...] [2008-12-21 17:56:34] [0da3c04827d8ef68db874351a2e09488] [Current]
Feedback Forum

Post a new message
Dataseries X:
94.7
101.8
102.5
105.3
110.3
109.8
117.3
118.8
131.3
125.9
133.1
147
145.8
164.4
149.8
137.7
151.7
156.8
180
180.4
170.4
191.6
199.5
218.2
217.5
205
194
199.3
219.3
211.1
215.2
240.2
242.2
240.7
255.4
253
218.2
203.7
205.6
215.6
188.5
202.9
214
230.3
230
241
259.6
247.8
270.3
289.7
322.7
315
320.2
329.5
360.6
382.2
435.4
464
468.8
403
351.6
Dataseries Y:
1.7
1.4
1.8
1.7
1.4
1.2
1
1.7
2.4
2
2.1
2
1.8
2.7
2.3
1.9
2
2.3
2.8
2.4
2.3
2.7
2.7
2.9
3
2.2
2.3
2.8
2.8
2.8
2.2
2.6
2.8
2.5
2.4
2.3
1.9
1.7
2
2.1
1.7
1.8
1.8
1.8
1.3
1.3
1.3
1.2
1.4
2.2
2.9
3.1
3.5
3.6
4.4
4.1
5.1
5.8
5.9
5.4
5.5


Summary of computational transaction
Raw Inputview raw input (R code)
Raw Outputview raw output of R engine
Computing time0 seconds
R Server'Gwilym Jenkins' @ 72.249.127.135

\begin{tabular}{lllllllll}
\hline
Summary of computational transaction \tabularnewline
Raw Input & view raw input (R code)  \tabularnewline
Raw Output & view raw output of R engine  \tabularnewline
Computing time & 0 seconds \tabularnewline
R Server & 'Gwilym Jenkins' @ 72.249.127.135 \tabularnewline
\hline
\end{tabular}
%Source: https://freestatistics.org/blog/index.php?pk=35718&T=0

[TABLE]
[ROW][C]Summary of computational transaction[/C][/ROW]
[ROW][C]Raw Input[/C][C]view raw input (R code) [/C][/ROW]
[ROW][C]Raw Output[/C][C]view raw output of R engine [/C][/ROW]
[ROW][C]Computing time[/C][C]0 seconds[/C][/ROW]
[ROW][C]R Server[/C][C]'Gwilym Jenkins' @ 72.249.127.135[/C][/ROW]
[/TABLE]
Source: https://freestatistics.org/blog/index.php?pk=35718&T=0

Globally Unique Identifier (entire table): ba.freestatistics.org/blog/index.php?pk=35718&T=0

As an alternative you can also use a QR Code:  

The GUIDs for individual cells are displayed in the table below:

Summary of computational transaction
Raw Inputview raw input (R code)
Raw Outputview raw output of R engine
Computing time0 seconds
R Server'Gwilym Jenkins' @ 72.249.127.135


Cross Correlation Function
ParameterValue
Box-Cox transformation parameter (lambda) of X series-0.2
Degree of non-seasonal differencing (d) of X series1
Degree of seasonal differencing (D) of X series0
Seasonal Period (s)12
Box-Cox transformation parameter (lambda) of Y series-0.4
Degree of non-seasonal differencing (d) of Y series1
Degree of seasonal differencing (D) of Y series0
krho(Y[t],X[t+k])
-14-0.125592909748007
-13-0.189243084457390
-12-0.229278680842559
-110.105790092604088
-100.143016345856294
-9-0.144949942576707
-80.0928322159605901
-70.111986508806801
-60.0490210441272331
-50.0736882404638944
-40.123749769160360
-3-0.0409736402807841
-2-0.132845019803438
-10.0126333294152817
00.455377076014475
10.0647995685393124
2-0.252917005000933
30.0894553871125675
40.0719354319065444
50.0911994389579708
60.0151216026970155
7-0.184797377009304
8-0.0107506243375257
9-0.133858118639693
10-0.0055785921076508
110.134938069348679
12-0.289352917311313
13-0.173213616005077
140.145054314774574

\begin{tabular}{lllllllll}
\hline
Cross Correlation Function \tabularnewline
Parameter & Value \tabularnewline
Box-Cox transformation parameter (lambda) of X series & -0.2 \tabularnewline
Degree of non-seasonal differencing (d) of X series & 1 \tabularnewline
Degree of seasonal differencing (D) of X series & 0 \tabularnewline
Seasonal Period (s) & 12 \tabularnewline
Box-Cox transformation parameter (lambda) of Y series & -0.4 \tabularnewline
Degree of non-seasonal differencing (d) of Y series & 1 \tabularnewline
Degree of seasonal differencing (D) of Y series & 0 \tabularnewline
k & rho(Y[t],X[t+k]) \tabularnewline
-14 & -0.125592909748007 \tabularnewline
-13 & -0.189243084457390 \tabularnewline
-12 & -0.229278680842559 \tabularnewline
-11 & 0.105790092604088 \tabularnewline
-10 & 0.143016345856294 \tabularnewline
-9 & -0.144949942576707 \tabularnewline
-8 & 0.0928322159605901 \tabularnewline
-7 & 0.111986508806801 \tabularnewline
-6 & 0.0490210441272331 \tabularnewline
-5 & 0.0736882404638944 \tabularnewline
-4 & 0.123749769160360 \tabularnewline
-3 & -0.0409736402807841 \tabularnewline
-2 & -0.132845019803438 \tabularnewline
-1 & 0.0126333294152817 \tabularnewline
0 & 0.455377076014475 \tabularnewline
1 & 0.0647995685393124 \tabularnewline
2 & -0.252917005000933 \tabularnewline
3 & 0.0894553871125675 \tabularnewline
4 & 0.0719354319065444 \tabularnewline
5 & 0.0911994389579708 \tabularnewline
6 & 0.0151216026970155 \tabularnewline
7 & -0.184797377009304 \tabularnewline
8 & -0.0107506243375257 \tabularnewline
9 & -0.133858118639693 \tabularnewline
10 & -0.0055785921076508 \tabularnewline
11 & 0.134938069348679 \tabularnewline
12 & -0.289352917311313 \tabularnewline
13 & -0.173213616005077 \tabularnewline
14 & 0.145054314774574 \tabularnewline
\hline
\end{tabular}
%Source: https://freestatistics.org/blog/index.php?pk=35718&T=1

[TABLE]
[ROW][C]Cross Correlation Function[/C][/ROW]
[ROW][C]Parameter[/C][C]Value[/C][/ROW]
[ROW][C]Box-Cox transformation parameter (lambda) of X series[/C][C]-0.2[/C][/ROW]
[ROW][C]Degree of non-seasonal differencing (d) of X series[/C][C]1[/C][/ROW]
[ROW][C]Degree of seasonal differencing (D) of X series[/C][C]0[/C][/ROW]
[ROW][C]Seasonal Period (s)[/C][C]12[/C][/ROW]
[ROW][C]Box-Cox transformation parameter (lambda) of Y series[/C][C]-0.4[/C][/ROW]
[ROW][C]Degree of non-seasonal differencing (d) of Y series[/C][C]1[/C][/ROW]
[ROW][C]Degree of seasonal differencing (D) of Y series[/C][C]0[/C][/ROW]
[ROW][C]k[/C][C]rho(Y[t],X[t+k])[/C][/ROW]
[ROW][C]-14[/C][C]-0.125592909748007[/C][/ROW]
[ROW][C]-13[/C][C]-0.189243084457390[/C][/ROW]
[ROW][C]-12[/C][C]-0.229278680842559[/C][/ROW]
[ROW][C]-11[/C][C]0.105790092604088[/C][/ROW]
[ROW][C]-10[/C][C]0.143016345856294[/C][/ROW]
[ROW][C]-9[/C][C]-0.144949942576707[/C][/ROW]
[ROW][C]-8[/C][C]0.0928322159605901[/C][/ROW]
[ROW][C]-7[/C][C]0.111986508806801[/C][/ROW]
[ROW][C]-6[/C][C]0.0490210441272331[/C][/ROW]
[ROW][C]-5[/C][C]0.0736882404638944[/C][/ROW]
[ROW][C]-4[/C][C]0.123749769160360[/C][/ROW]
[ROW][C]-3[/C][C]-0.0409736402807841[/C][/ROW]
[ROW][C]-2[/C][C]-0.132845019803438[/C][/ROW]
[ROW][C]-1[/C][C]0.0126333294152817[/C][/ROW]
[ROW][C]0[/C][C]0.455377076014475[/C][/ROW]
[ROW][C]1[/C][C]0.0647995685393124[/C][/ROW]
[ROW][C]2[/C][C]-0.252917005000933[/C][/ROW]
[ROW][C]3[/C][C]0.0894553871125675[/C][/ROW]
[ROW][C]4[/C][C]0.0719354319065444[/C][/ROW]
[ROW][C]5[/C][C]0.0911994389579708[/C][/ROW]
[ROW][C]6[/C][C]0.0151216026970155[/C][/ROW]
[ROW][C]7[/C][C]-0.184797377009304[/C][/ROW]
[ROW][C]8[/C][C]-0.0107506243375257[/C][/ROW]
[ROW][C]9[/C][C]-0.133858118639693[/C][/ROW]
[ROW][C]10[/C][C]-0.0055785921076508[/C][/ROW]
[ROW][C]11[/C][C]0.134938069348679[/C][/ROW]
[ROW][C]12[/C][C]-0.289352917311313[/C][/ROW]
[ROW][C]13[/C][C]-0.173213616005077[/C][/ROW]
[ROW][C]14[/C][C]0.145054314774574[/C][/ROW]
[/TABLE]
Source: https://freestatistics.org/blog/index.php?pk=35718&T=1

Globally Unique Identifier (entire table): ba.freestatistics.org/blog/index.php?pk=35718&T=1

As an alternative you can also use a QR Code:  

The GUIDs for individual cells are displayed in the table below:

Cross Correlation Function
ParameterValue
Box-Cox transformation parameter (lambda) of X series-0.2
Degree of non-seasonal differencing (d) of X series1
Degree of seasonal differencing (D) of X series0
Seasonal Period (s)12
Box-Cox transformation parameter (lambda) of Y series-0.4
Degree of non-seasonal differencing (d) of Y series1
Degree of seasonal differencing (D) of Y series0
krho(Y[t],X[t+k])
-14-0.125592909748007
-13-0.189243084457390
-12-0.229278680842559
-110.105790092604088
-100.143016345856294
-9-0.144949942576707
-80.0928322159605901
-70.111986508806801
-60.0490210441272331
-50.0736882404638944
-40.123749769160360
-3-0.0409736402807841
-2-0.132845019803438
-10.0126333294152817
00.455377076014475
10.0647995685393124
2-0.252917005000933
30.0894553871125675
40.0719354319065444
50.0911994389579708
60.0151216026970155
7-0.184797377009304
8-0.0107506243375257
9-0.133858118639693
10-0.0055785921076508
110.134938069348679
12-0.289352917311313
13-0.173213616005077
140.145054314774574


Parameters (Session):
par1 = -0.2 ; par2 = 1 ; par3 = 0 ; par4 = 12 ; par5 = -0.4 ; par6 = 1 ; par7 = 0 ;
Parameters (R input):
par1 = -0.2 ; par2 = 1 ; par3 = 0 ; par4 = 12 ; par5 = -0.4 ; par6 = 1 ; par7 = 0 ;
R code (references can be found in the software module):
par1 <- as.numeric(par1)
par2 <- as.numeric(par2)
par3 <- as.numeric(par3)
par4 <- as.numeric(par4)
par5 <- as.numeric(par5)
par6 <- as.numeric(par6)
par7 <- as.numeric(par7)
if (par1 == 0) {
x <- log(x)
} else {
x <- (x ^ par1 - 1) / par1
}
if (par5 == 0) {
y <- log(y)
} else {
y <- (y ^ par5 - 1) / par5
}
if (par2 > 0) x <- diff(x,lag=1,difference=par2)
if (par6 > 0) y <- diff(y,lag=1,difference=par6)
if (par3 > 0) x <- diff(x,lag=par4,difference=par3)
if (par7 > 0) y <- diff(y,lag=par4,difference=par7)
x
y
bitmap(file='test1.png')
(r <- ccf(x,y,main='Cross Correlation Function',ylab='CCF',xlab='Lag (k)'))
dev.off()
load(file='createtable')
a<-table.start()
a<-table.row.start(a)
a<-table.element(a,'Cross Correlation Function',2,TRUE)
a<-table.row.end(a)
a<-table.row.start(a)
a<-table.element(a,'Parameter',header=TRUE)
a<-table.element(a,'Value',header=TRUE)
a<-table.row.end(a)
a<-table.row.start(a)
a<-table.element(a,'Box-Cox transformation parameter (lambda) of X series',header=TRUE)
a<-table.element(a,par1)
a<-table.row.end(a)
a<-table.row.start(a)
a<-table.element(a,'Degree of non-seasonal differencing (d) of X series',header=TRUE)
a<-table.element(a,par2)
a<-table.row.end(a)
a<-table.row.start(a)
a<-table.element(a,'Degree of seasonal differencing (D) of X series',header=TRUE)
a<-table.element(a,par3)
a<-table.row.end(a)
a<-table.row.start(a)
a<-table.element(a,'Seasonal Period (s)',header=TRUE)
a<-table.element(a,par4)
a<-table.row.end(a)
a<-table.row.start(a)
a<-table.element(a,'Box-Cox transformation parameter (lambda) of Y series',header=TRUE)
a<-table.element(a,par5)
a<-table.row.end(a)
a<-table.row.start(a)
a<-table.element(a,'Degree of non-seasonal differencing (d) of Y series',header=TRUE)
a<-table.element(a,par6)
a<-table.row.end(a)
a<-table.row.start(a)
a<-table.element(a,'Degree of seasonal differencing (D) of Y series',header=TRUE)
a<-table.element(a,par7)
a<-table.row.end(a)
a<-table.row.start(a)
a<-table.element(a,'k',header=TRUE)
a<-table.element(a,'rho(Y[t],X[t+k])',header=TRUE)
a<-table.row.end(a)
mylength <- length(r$acf)
myhalf <- floor((mylength-1)/2)
for (i in 1:mylength) {
a<-table.row.start(a)
a<-table.element(a,i-myhalf-1,header=TRUE)
a<-table.element(a,r$acf[i])
a<-table.row.end(a)
}
a<-table.end(a)
table.save(a,file='mytable.tab')