Free Statistics

of Irreproducible Research!

Author's title

Author*The author of this computation has been verified*
R Software Modulerwasp_autocorrelation.wasp
Title produced by software(Partial) Autocorrelation Function
Date of computationSun, 21 Dec 2008 07:39:27 -0700
Cite this page as followsStatistical Computations at FreeStatistics.org, Office for Research Development and Education, URL https://freestatistics.org/blog/index.php?v=date/2008/Dec/21/t1229870504mw19m3brbvhxiz2.htm/, Retrieved Fri, 17 May 2024 05:02:49 +0000
Statistical Computations at FreeStatistics.org, Office for Research Development and Education, URL https://freestatistics.org/blog/index.php?pk=35606, Retrieved Fri, 17 May 2024 05:02:49 +0000
QR Codes:

Original text written by user:
IsPrivate?No (this computation is public)
User-defined keywords
Estimated Impact176
Family? (F = Feedback message, R = changed R code, M = changed R Module, P = changed Parameters, D = changed Data)
-     [Standard Deviation-Mean Plot] [SMP inschrijvinge...] [2008-12-21 10:55:25] [8d78428855b119373cac369316c08983]
-    D  [Standard Deviation-Mean Plot] [Standard deviatio...] [2008-12-21 13:36:43] [8d78428855b119373cac369316c08983]
- RM      [Variance Reduction Matrix] [variance reductio...] [2008-12-21 14:07:07] [8d78428855b119373cac369316c08983]
- RMP       [(Partial) Autocorrelation Function] [(P)ACF inschrijvi...] [2008-12-21 14:18:33] [8d78428855b119373cac369316c08983]
-   P           [(Partial) Autocorrelation Function] [(P)ACF inschrijvi...] [2008-12-21 14:39:27] [d6e9f26c3644bfc30f06303d9993b878] [Current]
Feedback Forum

Post a new message
Dataseries X:
11514
31514
27071
29462
26105
22397
23843
21705
18089
20764
25316
17704
15548
28029
29383
36438
32034
22679
24319
18004
17537
20366
22782
19169
13807
29743
25591
29096
26482
22405
27044
17970
18730
19684
19785
18479
10698
31956
29506
34506
27165
26736
23691
18157
17328
18205
20995
17382
9367
31124
26551
30651
25859
25100
25778
20418
18688
20424
24776
19814
12738


Summary of computational transaction
Raw Inputview raw input (R code)
Raw Outputview raw output of R engine
Computing time2 seconds
R Server'Gwilym Jenkins' @ 72.249.127.135

\begin{tabular}{lllllllll}
\hline
Summary of computational transaction \tabularnewline
Raw Input & view raw input (R code)  \tabularnewline
Raw Output & view raw output of R engine  \tabularnewline
Computing time & 2 seconds \tabularnewline
R Server & 'Gwilym Jenkins' @ 72.249.127.135 \tabularnewline
\hline
\end{tabular}
%Source: https://freestatistics.org/blog/index.php?pk=35606&T=0

[TABLE]
[ROW][C]Summary of computational transaction[/C][/ROW]
[ROW][C]Raw Input[/C][C]view raw input (R code) [/C][/ROW]
[ROW][C]Raw Output[/C][C]view raw output of R engine [/C][/ROW]
[ROW][C]Computing time[/C][C]2 seconds[/C][/ROW]
[ROW][C]R Server[/C][C]'Gwilym Jenkins' @ 72.249.127.135[/C][/ROW]
[/TABLE]
Source: https://freestatistics.org/blog/index.php?pk=35606&T=0

Globally Unique Identifier (entire table): ba.freestatistics.org/blog/index.php?pk=35606&T=0

As an alternative you can also use a QR Code:  

The GUIDs for individual cells are displayed in the table below:

Summary of computational transaction
Raw Inputview raw input (R code)
Raw Outputview raw output of R engine
Computing time2 seconds
R Server'Gwilym Jenkins' @ 72.249.127.135


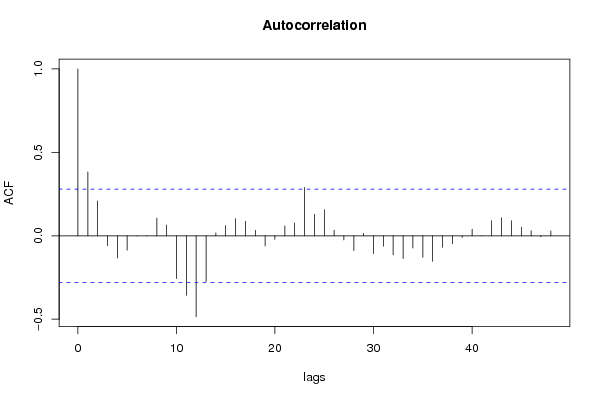
Autocorrelation Function
Time lag kACF(k)T-STATP-value
10.3824392.67710.005037
20.2084571.45920.075446
3-0.059489-0.41640.33946
4-0.133735-0.93610.176895
5-0.086596-0.60620.273598
6-0.001291-0.0090.496413
70.0008870.00620.497537
80.1058580.7410.231112
90.0639050.44730.328301
10-0.25681-1.79770.039196
11-0.356737-2.49720.007964
12-0.484783-3.39350.000687
13-0.273348-1.91340.030772
140.0166820.11680.45376
150.0614860.43040.334395
160.1023760.71660.238502
170.0864230.6050.273998
180.0326760.22870.410016
19-0.060618-0.42430.336593
20-0.021032-0.14720.44178
210.0590490.41330.34058
220.0770060.5390.296149
230.2899552.02970.023918
240.1289420.90260.185578
250.1563811.09470.139507
260.0334160.23390.408015
27-0.025301-0.17710.430077
28-0.08869-0.62080.268795
290.0150030.1050.458394
30-0.107659-0.75360.227343
31-0.06228-0.4360.33239
32-0.114046-0.79830.214268
33-0.136906-0.95830.171297
34-0.073454-0.51420.30472
35-0.128062-0.89640.187203
36-0.152808-1.06970.145008
37-0.068941-0.48260.315768
38-0.048184-0.33730.368671
39-0.011063-0.07740.469295
400.0394310.2760.391848
410.0002610.00180.499276
420.0901420.6310.265488
430.1077180.7540.227221
440.0906250.63440.264393
450.0504980.35350.362621
460.0296230.20740.418293
47-0.006243-0.04370.48266
480.0288370.20190.420431
49NANANA
50NANANA
51NANANA
52NANANA
53NANANA
54NANANA
55NANANA
56NANANA
57NANANA
58NANANA
59NANANA
60NANANA

\begin{tabular}{lllllllll}
\hline
Autocorrelation Function \tabularnewline
Time lag k & ACF(k) & T-STAT & P-value \tabularnewline
1 & 0.382439 & 2.6771 & 0.005037 \tabularnewline
2 & 0.208457 & 1.4592 & 0.075446 \tabularnewline
3 & -0.059489 & -0.4164 & 0.33946 \tabularnewline
4 & -0.133735 & -0.9361 & 0.176895 \tabularnewline
5 & -0.086596 & -0.6062 & 0.273598 \tabularnewline
6 & -0.001291 & -0.009 & 0.496413 \tabularnewline
7 & 0.000887 & 0.0062 & 0.497537 \tabularnewline
8 & 0.105858 & 0.741 & 0.231112 \tabularnewline
9 & 0.063905 & 0.4473 & 0.328301 \tabularnewline
10 & -0.25681 & -1.7977 & 0.039196 \tabularnewline
11 & -0.356737 & -2.4972 & 0.007964 \tabularnewline
12 & -0.484783 & -3.3935 & 0.000687 \tabularnewline
13 & -0.273348 & -1.9134 & 0.030772 \tabularnewline
14 & 0.016682 & 0.1168 & 0.45376 \tabularnewline
15 & 0.061486 & 0.4304 & 0.334395 \tabularnewline
16 & 0.102376 & 0.7166 & 0.238502 \tabularnewline
17 & 0.086423 & 0.605 & 0.273998 \tabularnewline
18 & 0.032676 & 0.2287 & 0.410016 \tabularnewline
19 & -0.060618 & -0.4243 & 0.336593 \tabularnewline
20 & -0.021032 & -0.1472 & 0.44178 \tabularnewline
21 & 0.059049 & 0.4133 & 0.34058 \tabularnewline
22 & 0.077006 & 0.539 & 0.296149 \tabularnewline
23 & 0.289955 & 2.0297 & 0.023918 \tabularnewline
24 & 0.128942 & 0.9026 & 0.185578 \tabularnewline
25 & 0.156381 & 1.0947 & 0.139507 \tabularnewline
26 & 0.033416 & 0.2339 & 0.408015 \tabularnewline
27 & -0.025301 & -0.1771 & 0.430077 \tabularnewline
28 & -0.08869 & -0.6208 & 0.268795 \tabularnewline
29 & 0.015003 & 0.105 & 0.458394 \tabularnewline
30 & -0.107659 & -0.7536 & 0.227343 \tabularnewline
31 & -0.06228 & -0.436 & 0.33239 \tabularnewline
32 & -0.114046 & -0.7983 & 0.214268 \tabularnewline
33 & -0.136906 & -0.9583 & 0.171297 \tabularnewline
34 & -0.073454 & -0.5142 & 0.30472 \tabularnewline
35 & -0.128062 & -0.8964 & 0.187203 \tabularnewline
36 & -0.152808 & -1.0697 & 0.145008 \tabularnewline
37 & -0.068941 & -0.4826 & 0.315768 \tabularnewline
38 & -0.048184 & -0.3373 & 0.368671 \tabularnewline
39 & -0.011063 & -0.0774 & 0.469295 \tabularnewline
40 & 0.039431 & 0.276 & 0.391848 \tabularnewline
41 & 0.000261 & 0.0018 & 0.499276 \tabularnewline
42 & 0.090142 & 0.631 & 0.265488 \tabularnewline
43 & 0.107718 & 0.754 & 0.227221 \tabularnewline
44 & 0.090625 & 0.6344 & 0.264393 \tabularnewline
45 & 0.050498 & 0.3535 & 0.362621 \tabularnewline
46 & 0.029623 & 0.2074 & 0.418293 \tabularnewline
47 & -0.006243 & -0.0437 & 0.48266 \tabularnewline
48 & 0.028837 & 0.2019 & 0.420431 \tabularnewline
49 & NA & NA & NA \tabularnewline
50 & NA & NA & NA \tabularnewline
51 & NA & NA & NA \tabularnewline
52 & NA & NA & NA \tabularnewline
53 & NA & NA & NA \tabularnewline
54 & NA & NA & NA \tabularnewline
55 & NA & NA & NA \tabularnewline
56 & NA & NA & NA \tabularnewline
57 & NA & NA & NA \tabularnewline
58 & NA & NA & NA \tabularnewline
59 & NA & NA & NA \tabularnewline
60 & NA & NA & NA \tabularnewline
\hline
\end{tabular}
%Source: https://freestatistics.org/blog/index.php?pk=35606&T=1

[TABLE]
[ROW][C]Autocorrelation Function[/C][/ROW]
[ROW][C]Time lag k[/C][C]ACF(k)[/C][C]T-STAT[/C][C]P-value[/C][/ROW]
[ROW][C]1[/C][C]0.382439[/C][C]2.6771[/C][C]0.005037[/C][/ROW]
[ROW][C]2[/C][C]0.208457[/C][C]1.4592[/C][C]0.075446[/C][/ROW]
[ROW][C]3[/C][C]-0.059489[/C][C]-0.4164[/C][C]0.33946[/C][/ROW]
[ROW][C]4[/C][C]-0.133735[/C][C]-0.9361[/C][C]0.176895[/C][/ROW]
[ROW][C]5[/C][C]-0.086596[/C][C]-0.6062[/C][C]0.273598[/C][/ROW]
[ROW][C]6[/C][C]-0.001291[/C][C]-0.009[/C][C]0.496413[/C][/ROW]
[ROW][C]7[/C][C]0.000887[/C][C]0.0062[/C][C]0.497537[/C][/ROW]
[ROW][C]8[/C][C]0.105858[/C][C]0.741[/C][C]0.231112[/C][/ROW]
[ROW][C]9[/C][C]0.063905[/C][C]0.4473[/C][C]0.328301[/C][/ROW]
[ROW][C]10[/C][C]-0.25681[/C][C]-1.7977[/C][C]0.039196[/C][/ROW]
[ROW][C]11[/C][C]-0.356737[/C][C]-2.4972[/C][C]0.007964[/C][/ROW]
[ROW][C]12[/C][C]-0.484783[/C][C]-3.3935[/C][C]0.000687[/C][/ROW]
[ROW][C]13[/C][C]-0.273348[/C][C]-1.9134[/C][C]0.030772[/C][/ROW]
[ROW][C]14[/C][C]0.016682[/C][C]0.1168[/C][C]0.45376[/C][/ROW]
[ROW][C]15[/C][C]0.061486[/C][C]0.4304[/C][C]0.334395[/C][/ROW]
[ROW][C]16[/C][C]0.102376[/C][C]0.7166[/C][C]0.238502[/C][/ROW]
[ROW][C]17[/C][C]0.086423[/C][C]0.605[/C][C]0.273998[/C][/ROW]
[ROW][C]18[/C][C]0.032676[/C][C]0.2287[/C][C]0.410016[/C][/ROW]
[ROW][C]19[/C][C]-0.060618[/C][C]-0.4243[/C][C]0.336593[/C][/ROW]
[ROW][C]20[/C][C]-0.021032[/C][C]-0.1472[/C][C]0.44178[/C][/ROW]
[ROW][C]21[/C][C]0.059049[/C][C]0.4133[/C][C]0.34058[/C][/ROW]
[ROW][C]22[/C][C]0.077006[/C][C]0.539[/C][C]0.296149[/C][/ROW]
[ROW][C]23[/C][C]0.289955[/C][C]2.0297[/C][C]0.023918[/C][/ROW]
[ROW][C]24[/C][C]0.128942[/C][C]0.9026[/C][C]0.185578[/C][/ROW]
[ROW][C]25[/C][C]0.156381[/C][C]1.0947[/C][C]0.139507[/C][/ROW]
[ROW][C]26[/C][C]0.033416[/C][C]0.2339[/C][C]0.408015[/C][/ROW]
[ROW][C]27[/C][C]-0.025301[/C][C]-0.1771[/C][C]0.430077[/C][/ROW]
[ROW][C]28[/C][C]-0.08869[/C][C]-0.6208[/C][C]0.268795[/C][/ROW]
[ROW][C]29[/C][C]0.015003[/C][C]0.105[/C][C]0.458394[/C][/ROW]
[ROW][C]30[/C][C]-0.107659[/C][C]-0.7536[/C][C]0.227343[/C][/ROW]
[ROW][C]31[/C][C]-0.06228[/C][C]-0.436[/C][C]0.33239[/C][/ROW]
[ROW][C]32[/C][C]-0.114046[/C][C]-0.7983[/C][C]0.214268[/C][/ROW]
[ROW][C]33[/C][C]-0.136906[/C][C]-0.9583[/C][C]0.171297[/C][/ROW]
[ROW][C]34[/C][C]-0.073454[/C][C]-0.5142[/C][C]0.30472[/C][/ROW]
[ROW][C]35[/C][C]-0.128062[/C][C]-0.8964[/C][C]0.187203[/C][/ROW]
[ROW][C]36[/C][C]-0.152808[/C][C]-1.0697[/C][C]0.145008[/C][/ROW]
[ROW][C]37[/C][C]-0.068941[/C][C]-0.4826[/C][C]0.315768[/C][/ROW]
[ROW][C]38[/C][C]-0.048184[/C][C]-0.3373[/C][C]0.368671[/C][/ROW]
[ROW][C]39[/C][C]-0.011063[/C][C]-0.0774[/C][C]0.469295[/C][/ROW]
[ROW][C]40[/C][C]0.039431[/C][C]0.276[/C][C]0.391848[/C][/ROW]
[ROW][C]41[/C][C]0.000261[/C][C]0.0018[/C][C]0.499276[/C][/ROW]
[ROW][C]42[/C][C]0.090142[/C][C]0.631[/C][C]0.265488[/C][/ROW]
[ROW][C]43[/C][C]0.107718[/C][C]0.754[/C][C]0.227221[/C][/ROW]
[ROW][C]44[/C][C]0.090625[/C][C]0.6344[/C][C]0.264393[/C][/ROW]
[ROW][C]45[/C][C]0.050498[/C][C]0.3535[/C][C]0.362621[/C][/ROW]
[ROW][C]46[/C][C]0.029623[/C][C]0.2074[/C][C]0.418293[/C][/ROW]
[ROW][C]47[/C][C]-0.006243[/C][C]-0.0437[/C][C]0.48266[/C][/ROW]
[ROW][C]48[/C][C]0.028837[/C][C]0.2019[/C][C]0.420431[/C][/ROW]
[ROW][C]49[/C][C]NA[/C][C]NA[/C][C]NA[/C][/ROW]
[ROW][C]50[/C][C]NA[/C][C]NA[/C][C]NA[/C][/ROW]
[ROW][C]51[/C][C]NA[/C][C]NA[/C][C]NA[/C][/ROW]
[ROW][C]52[/C][C]NA[/C][C]NA[/C][C]NA[/C][/ROW]
[ROW][C]53[/C][C]NA[/C][C]NA[/C][C]NA[/C][/ROW]
[ROW][C]54[/C][C]NA[/C][C]NA[/C][C]NA[/C][/ROW]
[ROW][C]55[/C][C]NA[/C][C]NA[/C][C]NA[/C][/ROW]
[ROW][C]56[/C][C]NA[/C][C]NA[/C][C]NA[/C][/ROW]
[ROW][C]57[/C][C]NA[/C][C]NA[/C][C]NA[/C][/ROW]
[ROW][C]58[/C][C]NA[/C][C]NA[/C][C]NA[/C][/ROW]
[ROW][C]59[/C][C]NA[/C][C]NA[/C][C]NA[/C][/ROW]
[ROW][C]60[/C][C]NA[/C][C]NA[/C][C]NA[/C][/ROW]
[/TABLE]
Source: https://freestatistics.org/blog/index.php?pk=35606&T=1

Globally Unique Identifier (entire table): ba.freestatistics.org/blog/index.php?pk=35606&T=1

As an alternative you can also use a QR Code:  

The GUIDs for individual cells are displayed in the table below:

Autocorrelation Function
Time lag kACF(k)T-STATP-value
10.3824392.67710.005037
20.2084571.45920.075446
3-0.059489-0.41640.33946
4-0.133735-0.93610.176895
5-0.086596-0.60620.273598
6-0.001291-0.0090.496413
70.0008870.00620.497537
80.1058580.7410.231112
90.0639050.44730.328301
10-0.25681-1.79770.039196
11-0.356737-2.49720.007964
12-0.484783-3.39350.000687
13-0.273348-1.91340.030772
140.0166820.11680.45376
150.0614860.43040.334395
160.1023760.71660.238502
170.0864230.6050.273998
180.0326760.22870.410016
19-0.060618-0.42430.336593
20-0.021032-0.14720.44178
210.0590490.41330.34058
220.0770060.5390.296149
230.2899552.02970.023918
240.1289420.90260.185578
250.1563811.09470.139507
260.0334160.23390.408015
27-0.025301-0.17710.430077
28-0.08869-0.62080.268795
290.0150030.1050.458394
30-0.107659-0.75360.227343
31-0.06228-0.4360.33239
32-0.114046-0.79830.214268
33-0.136906-0.95830.171297
34-0.073454-0.51420.30472
35-0.128062-0.89640.187203
36-0.152808-1.06970.145008
37-0.068941-0.48260.315768
38-0.048184-0.33730.368671
39-0.011063-0.07740.469295
400.0394310.2760.391848
410.0002610.00180.499276
420.0901420.6310.265488
430.1077180.7540.227221
440.0906250.63440.264393
450.0504980.35350.362621
460.0296230.20740.418293
47-0.006243-0.04370.48266
480.0288370.20190.420431
49NANANA
50NANANA
51NANANA
52NANANA
53NANANA
54NANANA
55NANANA
56NANANA
57NANANA
58NANANA
59NANANA
60NANANA


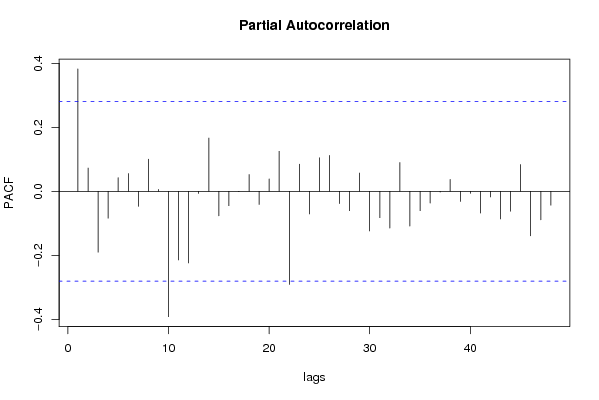
Partial Autocorrelation Function
Time lag kPACF(k)T-STATP-value
10.3824392.67710.005037
20.0728520.510.306182
3-0.1899-1.32930.094953
4-0.083579-0.5850.280599
50.0427110.2990.383112
60.0556410.38950.349301
7-0.046729-0.32710.372492
80.1004510.70320.242643
90.0059360.04160.483512
10-0.391361-2.73950.004279
11-0.214222-1.49960.070073
12-0.223406-1.56380.062146
13-0.006588-0.04610.481704
140.1664591.16520.124786
15-0.076376-0.53460.297662
16-0.044598-0.31220.378111
17-0.000852-0.0060.497634
180.0526360.36850.357062
19-0.040981-0.28690.387712
200.0390050.2730.392986
210.1249920.87490.192936
22-0.290936-2.03660.023559
230.0850730.59550.277122
24-0.070461-0.49320.312029
250.1047230.73310.233507
260.1121610.78510.218079
27-0.038233-0.26760.395054
28-0.060291-0.4220.337421
290.0571850.40030.34534
30-0.123539-0.86480.195689
31-0.082382-0.57670.2834
32-0.114708-0.8030.212938
330.0898850.62920.266071
34-0.108334-0.75830.22594
35-0.060283-0.4220.337443
36-0.036662-0.25660.399269
37-0.00227-0.01590.493693
380.0372240.26060.397759
39-0.031539-0.22080.413094
40-0.005993-0.0420.483353
41-0.067834-0.47480.318507
42-0.017442-0.12210.451663
43-0.086174-0.60320.274573
44-0.061922-0.43350.333294
450.0836190.58530.280506
46-0.139007-0.97310.167653
47-0.088972-0.62280.268151
48-0.043006-0.3010.382329
49NANANA
50NANANA
51NANANA
52NANANA
53NANANA
54NANANA
55NANANA
56NANANA
57NANANA
58NANANA
59NANANA
60NANANA

\begin{tabular}{lllllllll}
\hline
Partial Autocorrelation Function \tabularnewline
Time lag k & PACF(k) & T-STAT & P-value \tabularnewline
1 & 0.382439 & 2.6771 & 0.005037 \tabularnewline
2 & 0.072852 & 0.51 & 0.306182 \tabularnewline
3 & -0.1899 & -1.3293 & 0.094953 \tabularnewline
4 & -0.083579 & -0.585 & 0.280599 \tabularnewline
5 & 0.042711 & 0.299 & 0.383112 \tabularnewline
6 & 0.055641 & 0.3895 & 0.349301 \tabularnewline
7 & -0.046729 & -0.3271 & 0.372492 \tabularnewline
8 & 0.100451 & 0.7032 & 0.242643 \tabularnewline
9 & 0.005936 & 0.0416 & 0.483512 \tabularnewline
10 & -0.391361 & -2.7395 & 0.004279 \tabularnewline
11 & -0.214222 & -1.4996 & 0.070073 \tabularnewline
12 & -0.223406 & -1.5638 & 0.062146 \tabularnewline
13 & -0.006588 & -0.0461 & 0.481704 \tabularnewline
14 & 0.166459 & 1.1652 & 0.124786 \tabularnewline
15 & -0.076376 & -0.5346 & 0.297662 \tabularnewline
16 & -0.044598 & -0.3122 & 0.378111 \tabularnewline
17 & -0.000852 & -0.006 & 0.497634 \tabularnewline
18 & 0.052636 & 0.3685 & 0.357062 \tabularnewline
19 & -0.040981 & -0.2869 & 0.387712 \tabularnewline
20 & 0.039005 & 0.273 & 0.392986 \tabularnewline
21 & 0.124992 & 0.8749 & 0.192936 \tabularnewline
22 & -0.290936 & -2.0366 & 0.023559 \tabularnewline
23 & 0.085073 & 0.5955 & 0.277122 \tabularnewline
24 & -0.070461 & -0.4932 & 0.312029 \tabularnewline
25 & 0.104723 & 0.7331 & 0.233507 \tabularnewline
26 & 0.112161 & 0.7851 & 0.218079 \tabularnewline
27 & -0.038233 & -0.2676 & 0.395054 \tabularnewline
28 & -0.060291 & -0.422 & 0.337421 \tabularnewline
29 & 0.057185 & 0.4003 & 0.34534 \tabularnewline
30 & -0.123539 & -0.8648 & 0.195689 \tabularnewline
31 & -0.082382 & -0.5767 & 0.2834 \tabularnewline
32 & -0.114708 & -0.803 & 0.212938 \tabularnewline
33 & 0.089885 & 0.6292 & 0.266071 \tabularnewline
34 & -0.108334 & -0.7583 & 0.22594 \tabularnewline
35 & -0.060283 & -0.422 & 0.337443 \tabularnewline
36 & -0.036662 & -0.2566 & 0.399269 \tabularnewline
37 & -0.00227 & -0.0159 & 0.493693 \tabularnewline
38 & 0.037224 & 0.2606 & 0.397759 \tabularnewline
39 & -0.031539 & -0.2208 & 0.413094 \tabularnewline
40 & -0.005993 & -0.042 & 0.483353 \tabularnewline
41 & -0.067834 & -0.4748 & 0.318507 \tabularnewline
42 & -0.017442 & -0.1221 & 0.451663 \tabularnewline
43 & -0.086174 & -0.6032 & 0.274573 \tabularnewline
44 & -0.061922 & -0.4335 & 0.333294 \tabularnewline
45 & 0.083619 & 0.5853 & 0.280506 \tabularnewline
46 & -0.139007 & -0.9731 & 0.167653 \tabularnewline
47 & -0.088972 & -0.6228 & 0.268151 \tabularnewline
48 & -0.043006 & -0.301 & 0.382329 \tabularnewline
49 & NA & NA & NA \tabularnewline
50 & NA & NA & NA \tabularnewline
51 & NA & NA & NA \tabularnewline
52 & NA & NA & NA \tabularnewline
53 & NA & NA & NA \tabularnewline
54 & NA & NA & NA \tabularnewline
55 & NA & NA & NA \tabularnewline
56 & NA & NA & NA \tabularnewline
57 & NA & NA & NA \tabularnewline
58 & NA & NA & NA \tabularnewline
59 & NA & NA & NA \tabularnewline
60 & NA & NA & NA \tabularnewline
\hline
\end{tabular}
%Source: https://freestatistics.org/blog/index.php?pk=35606&T=2

[TABLE]
[ROW][C]Partial Autocorrelation Function[/C][/ROW]
[ROW][C]Time lag k[/C][C]PACF(k)[/C][C]T-STAT[/C][C]P-value[/C][/ROW]
[ROW][C]1[/C][C]0.382439[/C][C]2.6771[/C][C]0.005037[/C][/ROW]
[ROW][C]2[/C][C]0.072852[/C][C]0.51[/C][C]0.306182[/C][/ROW]
[ROW][C]3[/C][C]-0.1899[/C][C]-1.3293[/C][C]0.094953[/C][/ROW]
[ROW][C]4[/C][C]-0.083579[/C][C]-0.585[/C][C]0.280599[/C][/ROW]
[ROW][C]5[/C][C]0.042711[/C][C]0.299[/C][C]0.383112[/C][/ROW]
[ROW][C]6[/C][C]0.055641[/C][C]0.3895[/C][C]0.349301[/C][/ROW]
[ROW][C]7[/C][C]-0.046729[/C][C]-0.3271[/C][C]0.372492[/C][/ROW]
[ROW][C]8[/C][C]0.100451[/C][C]0.7032[/C][C]0.242643[/C][/ROW]
[ROW][C]9[/C][C]0.005936[/C][C]0.0416[/C][C]0.483512[/C][/ROW]
[ROW][C]10[/C][C]-0.391361[/C][C]-2.7395[/C][C]0.004279[/C][/ROW]
[ROW][C]11[/C][C]-0.214222[/C][C]-1.4996[/C][C]0.070073[/C][/ROW]
[ROW][C]12[/C][C]-0.223406[/C][C]-1.5638[/C][C]0.062146[/C][/ROW]
[ROW][C]13[/C][C]-0.006588[/C][C]-0.0461[/C][C]0.481704[/C][/ROW]
[ROW][C]14[/C][C]0.166459[/C][C]1.1652[/C][C]0.124786[/C][/ROW]
[ROW][C]15[/C][C]-0.076376[/C][C]-0.5346[/C][C]0.297662[/C][/ROW]
[ROW][C]16[/C][C]-0.044598[/C][C]-0.3122[/C][C]0.378111[/C][/ROW]
[ROW][C]17[/C][C]-0.000852[/C][C]-0.006[/C][C]0.497634[/C][/ROW]
[ROW][C]18[/C][C]0.052636[/C][C]0.3685[/C][C]0.357062[/C][/ROW]
[ROW][C]19[/C][C]-0.040981[/C][C]-0.2869[/C][C]0.387712[/C][/ROW]
[ROW][C]20[/C][C]0.039005[/C][C]0.273[/C][C]0.392986[/C][/ROW]
[ROW][C]21[/C][C]0.124992[/C][C]0.8749[/C][C]0.192936[/C][/ROW]
[ROW][C]22[/C][C]-0.290936[/C][C]-2.0366[/C][C]0.023559[/C][/ROW]
[ROW][C]23[/C][C]0.085073[/C][C]0.5955[/C][C]0.277122[/C][/ROW]
[ROW][C]24[/C][C]-0.070461[/C][C]-0.4932[/C][C]0.312029[/C][/ROW]
[ROW][C]25[/C][C]0.104723[/C][C]0.7331[/C][C]0.233507[/C][/ROW]
[ROW][C]26[/C][C]0.112161[/C][C]0.7851[/C][C]0.218079[/C][/ROW]
[ROW][C]27[/C][C]-0.038233[/C][C]-0.2676[/C][C]0.395054[/C][/ROW]
[ROW][C]28[/C][C]-0.060291[/C][C]-0.422[/C][C]0.337421[/C][/ROW]
[ROW][C]29[/C][C]0.057185[/C][C]0.4003[/C][C]0.34534[/C][/ROW]
[ROW][C]30[/C][C]-0.123539[/C][C]-0.8648[/C][C]0.195689[/C][/ROW]
[ROW][C]31[/C][C]-0.082382[/C][C]-0.5767[/C][C]0.2834[/C][/ROW]
[ROW][C]32[/C][C]-0.114708[/C][C]-0.803[/C][C]0.212938[/C][/ROW]
[ROW][C]33[/C][C]0.089885[/C][C]0.6292[/C][C]0.266071[/C][/ROW]
[ROW][C]34[/C][C]-0.108334[/C][C]-0.7583[/C][C]0.22594[/C][/ROW]
[ROW][C]35[/C][C]-0.060283[/C][C]-0.422[/C][C]0.337443[/C][/ROW]
[ROW][C]36[/C][C]-0.036662[/C][C]-0.2566[/C][C]0.399269[/C][/ROW]
[ROW][C]37[/C][C]-0.00227[/C][C]-0.0159[/C][C]0.493693[/C][/ROW]
[ROW][C]38[/C][C]0.037224[/C][C]0.2606[/C][C]0.397759[/C][/ROW]
[ROW][C]39[/C][C]-0.031539[/C][C]-0.2208[/C][C]0.413094[/C][/ROW]
[ROW][C]40[/C][C]-0.005993[/C][C]-0.042[/C][C]0.483353[/C][/ROW]
[ROW][C]41[/C][C]-0.067834[/C][C]-0.4748[/C][C]0.318507[/C][/ROW]
[ROW][C]42[/C][C]-0.017442[/C][C]-0.1221[/C][C]0.451663[/C][/ROW]
[ROW][C]43[/C][C]-0.086174[/C][C]-0.6032[/C][C]0.274573[/C][/ROW]
[ROW][C]44[/C][C]-0.061922[/C][C]-0.4335[/C][C]0.333294[/C][/ROW]
[ROW][C]45[/C][C]0.083619[/C][C]0.5853[/C][C]0.280506[/C][/ROW]
[ROW][C]46[/C][C]-0.139007[/C][C]-0.9731[/C][C]0.167653[/C][/ROW]
[ROW][C]47[/C][C]-0.088972[/C][C]-0.6228[/C][C]0.268151[/C][/ROW]
[ROW][C]48[/C][C]-0.043006[/C][C]-0.301[/C][C]0.382329[/C][/ROW]
[ROW][C]49[/C][C]NA[/C][C]NA[/C][C]NA[/C][/ROW]
[ROW][C]50[/C][C]NA[/C][C]NA[/C][C]NA[/C][/ROW]
[ROW][C]51[/C][C]NA[/C][C]NA[/C][C]NA[/C][/ROW]
[ROW][C]52[/C][C]NA[/C][C]NA[/C][C]NA[/C][/ROW]
[ROW][C]53[/C][C]NA[/C][C]NA[/C][C]NA[/C][/ROW]
[ROW][C]54[/C][C]NA[/C][C]NA[/C][C]NA[/C][/ROW]
[ROW][C]55[/C][C]NA[/C][C]NA[/C][C]NA[/C][/ROW]
[ROW][C]56[/C][C]NA[/C][C]NA[/C][C]NA[/C][/ROW]
[ROW][C]57[/C][C]NA[/C][C]NA[/C][C]NA[/C][/ROW]
[ROW][C]58[/C][C]NA[/C][C]NA[/C][C]NA[/C][/ROW]
[ROW][C]59[/C][C]NA[/C][C]NA[/C][C]NA[/C][/ROW]
[ROW][C]60[/C][C]NA[/C][C]NA[/C][C]NA[/C][/ROW]
[/TABLE]
Source: https://freestatistics.org/blog/index.php?pk=35606&T=2

Globally Unique Identifier (entire table): ba.freestatistics.org/blog/index.php?pk=35606&T=2

As an alternative you can also use a QR Code:  

The GUIDs for individual cells are displayed in the table below:

Partial Autocorrelation Function
Time lag kPACF(k)T-STATP-value
10.3824392.67710.005037
20.0728520.510.306182
3-0.1899-1.32930.094953
4-0.083579-0.5850.280599
50.0427110.2990.383112
60.0556410.38950.349301
7-0.046729-0.32710.372492
80.1004510.70320.242643
90.0059360.04160.483512
10-0.391361-2.73950.004279
11-0.214222-1.49960.070073
12-0.223406-1.56380.062146
13-0.006588-0.04610.481704
140.1664591.16520.124786
15-0.076376-0.53460.297662
16-0.044598-0.31220.378111
17-0.000852-0.0060.497634
180.0526360.36850.357062
19-0.040981-0.28690.387712
200.0390050.2730.392986
210.1249920.87490.192936
22-0.290936-2.03660.023559
230.0850730.59550.277122
24-0.070461-0.49320.312029
250.1047230.73310.233507
260.1121610.78510.218079
27-0.038233-0.26760.395054
28-0.060291-0.4220.337421
290.0571850.40030.34534
30-0.123539-0.86480.195689
31-0.082382-0.57670.2834
32-0.114708-0.8030.212938
330.0898850.62920.266071
34-0.108334-0.75830.22594
35-0.060283-0.4220.337443
36-0.036662-0.25660.399269
37-0.00227-0.01590.493693
380.0372240.26060.397759
39-0.031539-0.22080.413094
40-0.005993-0.0420.483353
41-0.067834-0.47480.318507
42-0.017442-0.12210.451663
43-0.086174-0.60320.274573
44-0.061922-0.43350.333294
450.0836190.58530.280506
46-0.139007-0.97310.167653
47-0.088972-0.62280.268151
48-0.043006-0.3010.382329
49NANANA
50NANANA
51NANANA
52NANANA
53NANANA
54NANANA
55NANANA
56NANANA
57NANANA
58NANANA
59NANANA
60NANANA


Parameters (Session):
par1 = 60 ; par2 = 1 ; par3 = 0 ; par4 = 1 ; par5 = 12 ;
Parameters (R input):
par1 = 60 ; par2 = 1 ; par3 = 0 ; par4 = 1 ; par5 = 12 ;
R code (references can be found in the software module):
if (par1 == 'Default') {
par1 = 10*log10(length(x))
} else {
par1 <- as.numeric(par1)
}
par2 <- as.numeric(par2)
par3 <- as.numeric(par3)
par4 <- as.numeric(par4)
par5 <- as.numeric(par5)
if (par2 == 0) {
x <- log(x)
} else {
x <- (x ^ par2 - 1) / par2
}
if (par3 > 0) x <- diff(x,lag=1,difference=par3)
if (par4 > 0) x <- diff(x,lag=par5,difference=par4)
bitmap(file='pic1.png')
racf <- acf(x,par1,main='Autocorrelation',xlab='lags',ylab='ACF')
dev.off()
bitmap(file='pic2.png')
rpacf <- pacf(x,par1,main='Partial Autocorrelation',xlab='lags',ylab='PACF')
dev.off()
(myacf <- c(racf$acf))
(mypacf <- c(rpacf$acf))
lengthx <- length(x)
sqrtn <- sqrt(lengthx)
load(file='createtable')
a<-table.start()
a<-table.row.start(a)
a<-table.element(a,'Autocorrelation Function',4,TRUE)
a<-table.row.end(a)
a<-table.row.start(a)
a<-table.element(a,'Time lag k',header=TRUE)
a<-table.element(a,hyperlink('basics.htm','ACF(k)','click here for more information about the Autocorrelation Function'),header=TRUE)
a<-table.element(a,'T-STAT',header=TRUE)
a<-table.element(a,'P-value',header=TRUE)
a<-table.row.end(a)
for (i in 2:(par1+1)) {
a<-table.row.start(a)
a<-table.element(a,i-1,header=TRUE)
a<-table.element(a,round(myacf[i],6))
mytstat <- myacf[i]*sqrtn
a<-table.element(a,round(mytstat,4))
a<-table.element(a,round(1-pt(abs(mytstat),lengthx),6))
a<-table.row.end(a)
}
a<-table.end(a)
table.save(a,file='mytable.tab')
a<-table.start()
a<-table.row.start(a)
a<-table.element(a,'Partial Autocorrelation Function',4,TRUE)
a<-table.row.end(a)
a<-table.row.start(a)
a<-table.element(a,'Time lag k',header=TRUE)
a<-table.element(a,hyperlink('basics.htm','PACF(k)','click here for more information about the Partial Autocorrelation Function'),header=TRUE)
a<-table.element(a,'T-STAT',header=TRUE)
a<-table.element(a,'P-value',header=TRUE)
a<-table.row.end(a)
for (i in 1:par1) {
a<-table.row.start(a)
a<-table.element(a,i,header=TRUE)
a<-table.element(a,round(mypacf[i],6))
mytstat <- mypacf[i]*sqrtn
a<-table.element(a,round(mytstat,4))
a<-table.element(a,round(1-pt(abs(mytstat),lengthx),6))
a<-table.row.end(a)
}
a<-table.end(a)
table.save(a,file='mytable1.tab')