Free Statistics

of Irreproducible Research!

Author's title

Author*The author of this computation has been verified*
R Software Modulerwasp_arimabackwardselection.wasp
Title produced by softwareARIMA Backward Selection
Date of computationSun, 21 Dec 2008 07:19:55 -0700
Cite this page as followsStatistical Computations at FreeStatistics.org, Office for Research Development and Education, URL https://freestatistics.org/blog/index.php?v=date/2008/Dec/21/t1229869255au6voyhoi6mbxhv.htm/, Retrieved Fri, 17 May 2024 04:18:50 +0000
Statistical Computations at FreeStatistics.org, Office for Research Development and Education, URL https://freestatistics.org/blog/index.php?pk=35589, Retrieved Fri, 17 May 2024 04:18:50 +0000
QR Codes:

Original text written by user:
IsPrivate?No (this computation is public)
User-defined keywords
Estimated Impact150
Family? (F = Feedback message, R = changed R code, M = changed R Module, P = changed Parameters, D = changed Data)
F     [Univariate Data Series] [blog 1e tijdreeks...] [2008-10-13 19:23:31] [7173087adebe3e3a714c80ea2417b3eb]
-   PD  [Univariate Data Series] [tijdreeksen opnie...] [2008-10-19 17:13:12] [7173087adebe3e3a714c80ea2417b3eb]
-   PD    [Univariate Data Series] [tijdreeksen opnie...] [2008-10-19 18:55:20] [7173087adebe3e3a714c80ea2417b3eb]
- RM        [Central Tendency] [central tendency ...] [2008-10-19 19:10:37] [7173087adebe3e3a714c80ea2417b3eb]
- RMP         [ARIMA Backward Selection] [arima backward st...] [2008-12-08 22:03:24] [7173087adebe3e3a714c80ea2417b3eb]
-   PD            [ARIMA Backward Selection] [Backward inschr. ...] [2008-12-21 14:19:55] [9ba97de59bb4d2edf0cfeac4ca7d2b73] [Current]
Feedback Forum

Post a new message
Dataseries X:
58608
46865
51378
46235
47206
45382
41227
33795
31295
42625
33625
21538
56421
53152
53536
52408
41454
38271
35306
26414
31917
38030
27534
18387
50556
43901
48572
43899
37532
40357
35489
29027
34485
42598
30306
26451
47460
50104
61465
53726
39477
43895
31481
29896
33842
39120
33702
25094
51442
45594
52518
48564
41745
49585
32747
33379
35645
37034
35681
20972
58552
54955
65540
51570
51145
46641
35704
33253
35193
41668
34865
21210
56126
49231
59723
48103
47472
50497
40059
34149
36860
46356
36577
23872


Summary of computational transaction
Raw Inputview raw input (R code)
Raw Outputview raw output of R engine
Computing time3 seconds
R Server'Gwilym Jenkins' @ 72.249.127.135

\begin{tabular}{lllllllll}
\hline
Summary of computational transaction \tabularnewline
Raw Input & view raw input (R code)  \tabularnewline
Raw Output & view raw output of R engine  \tabularnewline
Computing time & 3 seconds \tabularnewline
R Server & 'Gwilym Jenkins' @ 72.249.127.135 \tabularnewline
\hline
\end{tabular}
%Source: https://freestatistics.org/blog/index.php?pk=35589&T=0

[TABLE]
[ROW][C]Summary of computational transaction[/C][/ROW]
[ROW][C]Raw Input[/C][C]view raw input (R code) [/C][/ROW]
[ROW][C]Raw Output[/C][C]view raw output of R engine [/C][/ROW]
[ROW][C]Computing time[/C][C]3 seconds[/C][/ROW]
[ROW][C]R Server[/C][C]'Gwilym Jenkins' @ 72.249.127.135[/C][/ROW]
[/TABLE]
Source: https://freestatistics.org/blog/index.php?pk=35589&T=0

Globally Unique Identifier (entire table): ba.freestatistics.org/blog/index.php?pk=35589&T=0

As an alternative you can also use a QR Code:  

The GUIDs for individual cells are displayed in the table below:

Summary of computational transaction
Raw Inputview raw input (R code)
Raw Outputview raw output of R engine
Computing time3 seconds
R Server'Gwilym Jenkins' @ 72.249.127.135


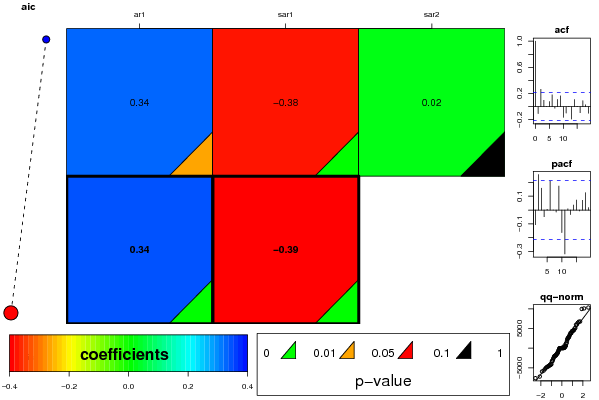
ARIMA Parameter Estimation and Backward Selection
Iterationar1sar1sar2
Estimates ( 1 )0.3357-0.38370.0231
(p-val)(0.0142 )(0.0029 )(0.8842 )
Estimates ( 2 )0.3439-0.38890
(p-val)(0.0058 )(0.0018 )(NA )
Estimates ( 3 )NANANA
(p-val)(NA )(NA )(NA )
Estimates ( 4 )NANANA
(p-val)(NA )(NA )(NA )
Estimates ( 5 )NANANA
(p-val)(NA )(NA )(NA )

\begin{tabular}{lllllllll}
\hline
ARIMA Parameter Estimation and Backward Selection \tabularnewline
Iteration & ar1 & sar1 & sar2 \tabularnewline
Estimates ( 1 ) & 0.3357 & -0.3837 & 0.0231 \tabularnewline
(p-val) & (0.0142 ) & (0.0029 ) & (0.8842 ) \tabularnewline
Estimates ( 2 ) & 0.3439 & -0.3889 & 0 \tabularnewline
(p-val) & (0.0058 ) & (0.0018 ) & (NA ) \tabularnewline
Estimates ( 3 ) & NA & NA & NA \tabularnewline
(p-val) & (NA ) & (NA ) & (NA ) \tabularnewline
Estimates ( 4 ) & NA & NA & NA \tabularnewline
(p-val) & (NA ) & (NA ) & (NA ) \tabularnewline
Estimates ( 5 ) & NA & NA & NA \tabularnewline
(p-val) & (NA ) & (NA ) & (NA ) \tabularnewline
\hline
\end{tabular}
%Source: https://freestatistics.org/blog/index.php?pk=35589&T=1

[TABLE]
[ROW][C]ARIMA Parameter Estimation and Backward Selection[/C][/ROW]
[ROW][C]Iteration[/C][C]ar1[/C][C]sar1[/C][C]sar2[/C][/ROW]
[ROW][C]Estimates ( 1 )[/C][C]0.3357[/C][C]-0.3837[/C][C]0.0231[/C][/ROW]
[ROW][C](p-val)[/C][C](0.0142 )[/C][C](0.0029 )[/C][C](0.8842 )[/C][/ROW]
[ROW][C]Estimates ( 2 )[/C][C]0.3439[/C][C]-0.3889[/C][C]0[/C][/ROW]
[ROW][C](p-val)[/C][C](0.0058 )[/C][C](0.0018 )[/C][C](NA )[/C][/ROW]
[ROW][C]Estimates ( 3 )[/C][C]NA[/C][C]NA[/C][C]NA[/C][/ROW]
[ROW][C](p-val)[/C][C](NA )[/C][C](NA )[/C][C](NA )[/C][/ROW]
[ROW][C]Estimates ( 4 )[/C][C]NA[/C][C]NA[/C][C]NA[/C][/ROW]
[ROW][C](p-val)[/C][C](NA )[/C][C](NA )[/C][C](NA )[/C][/ROW]
[ROW][C]Estimates ( 5 )[/C][C]NA[/C][C]NA[/C][C]NA[/C][/ROW]
[ROW][C](p-val)[/C][C](NA )[/C][C](NA )[/C][C](NA )[/C][/ROW]
[/TABLE]
Source: https://freestatistics.org/blog/index.php?pk=35589&T=1

Globally Unique Identifier (entire table): ba.freestatistics.org/blog/index.php?pk=35589&T=1

As an alternative you can also use a QR Code:  

The GUIDs for individual cells are displayed in the table below:

ARIMA Parameter Estimation and Backward Selection
Iterationar1sar1sar2
Estimates ( 1 )0.3357-0.38370.0231
(p-val)(0.0142 )(0.0029 )(0.8842 )
Estimates ( 2 )0.3439-0.38890
(p-val)(0.0058 )(0.0018 )(NA )
Estimates ( 3 )NANANA
(p-val)(NA )(NA )(NA )
Estimates ( 4 )NANANA
(p-val)(NA )(NA )(NA )
Estimates ( 5 )NANANA
(p-val)(NA )(NA )(NA )


Estimated ARIMA Residuals
Value
21.5379762202715
-1894.0409671755
6455.20328292694
43.8493637581517
5009.44890535869
-7193.50059200805
-4763.01754711292
-3250.20464543001
-4961.76593510035
2840.81845949446
-4443.45964116622
-4267.11361425887
-1292.01546993382
-5678.78004533326
-4523.53678533896
-1839.54438877224
-4701.51372500298
-4137.6469113874
1367.58249373615
-1904.58856198202
433.511466560192
2908.66089844026
1822.29720032327
-537.280331245181
6728.29583091808
-7597.39505881887
4285.77841621666
10096.6170517689
2747.85461391733
-1581.48677716442
4310.40740173091
-5312.25098913871
3318.091180433
-357.65700675446
-1729.14508175683
5143.92490222659
265.594528874469
2322.36641515234
-2899.52054265905
-3242.35299746476
109.409824269169
3506.03601884267
5956.92504335818
-2625.35239529603
3848.5893895856
236.144076978104
-4028.53915680348
4401.3899850659
-5909.31459074716
10330.3964320811
4563.69726372298
6777.84754522102
-2320.53076996816
9957.25197023381
-4275.01256308276
3818.34697184981
3.48332031059545
-144.881815391025
3828.66402911949
-1449.12951508987
-1266.67428132641
650.177914723296
-2098.54061494287
66.9076003852533
-1988.20904039191
617.550650745696
2634.77398903739
4589.22214112988
-1065.73138501400
1194.38691639631
6026.84158741996
-833.445387508626
2394.47868785662

\begin{tabular}{lllllllll}
\hline
Estimated ARIMA Residuals \tabularnewline
Value \tabularnewline
21.5379762202715 \tabularnewline
-1894.0409671755 \tabularnewline
6455.20328292694 \tabularnewline
43.8493637581517 \tabularnewline
5009.44890535869 \tabularnewline
-7193.50059200805 \tabularnewline
-4763.01754711292 \tabularnewline
-3250.20464543001 \tabularnewline
-4961.76593510035 \tabularnewline
2840.81845949446 \tabularnewline
-4443.45964116622 \tabularnewline
-4267.11361425887 \tabularnewline
-1292.01546993382 \tabularnewline
-5678.78004533326 \tabularnewline
-4523.53678533896 \tabularnewline
-1839.54438877224 \tabularnewline
-4701.51372500298 \tabularnewline
-4137.6469113874 \tabularnewline
1367.58249373615 \tabularnewline
-1904.58856198202 \tabularnewline
433.511466560192 \tabularnewline
2908.66089844026 \tabularnewline
1822.29720032327 \tabularnewline
-537.280331245181 \tabularnewline
6728.29583091808 \tabularnewline
-7597.39505881887 \tabularnewline
4285.77841621666 \tabularnewline
10096.6170517689 \tabularnewline
2747.85461391733 \tabularnewline
-1581.48677716442 \tabularnewline
4310.40740173091 \tabularnewline
-5312.25098913871 \tabularnewline
3318.091180433 \tabularnewline
-357.65700675446 \tabularnewline
-1729.14508175683 \tabularnewline
5143.92490222659 \tabularnewline
265.594528874469 \tabularnewline
2322.36641515234 \tabularnewline
-2899.52054265905 \tabularnewline
-3242.35299746476 \tabularnewline
109.409824269169 \tabularnewline
3506.03601884267 \tabularnewline
5956.92504335818 \tabularnewline
-2625.35239529603 \tabularnewline
3848.5893895856 \tabularnewline
236.144076978104 \tabularnewline
-4028.53915680348 \tabularnewline
4401.3899850659 \tabularnewline
-5909.31459074716 \tabularnewline
10330.3964320811 \tabularnewline
4563.69726372298 \tabularnewline
6777.84754522102 \tabularnewline
-2320.53076996816 \tabularnewline
9957.25197023381 \tabularnewline
-4275.01256308276 \tabularnewline
3818.34697184981 \tabularnewline
3.48332031059545 \tabularnewline
-144.881815391025 \tabularnewline
3828.66402911949 \tabularnewline
-1449.12951508987 \tabularnewline
-1266.67428132641 \tabularnewline
650.177914723296 \tabularnewline
-2098.54061494287 \tabularnewline
66.9076003852533 \tabularnewline
-1988.20904039191 \tabularnewline
617.550650745696 \tabularnewline
2634.77398903739 \tabularnewline
4589.22214112988 \tabularnewline
-1065.73138501400 \tabularnewline
1194.38691639631 \tabularnewline
6026.84158741996 \tabularnewline
-833.445387508626 \tabularnewline
2394.47868785662 \tabularnewline
\hline
\end{tabular}
%Source: https://freestatistics.org/blog/index.php?pk=35589&T=2

[TABLE]
[ROW][C]Estimated ARIMA Residuals[/C][/ROW]
[ROW][C]Value[/C][/ROW]
[ROW][C]21.5379762202715[/C][/ROW]
[ROW][C]-1894.0409671755[/C][/ROW]
[ROW][C]6455.20328292694[/C][/ROW]
[ROW][C]43.8493637581517[/C][/ROW]
[ROW][C]5009.44890535869[/C][/ROW]
[ROW][C]-7193.50059200805[/C][/ROW]
[ROW][C]-4763.01754711292[/C][/ROW]
[ROW][C]-3250.20464543001[/C][/ROW]
[ROW][C]-4961.76593510035[/C][/ROW]
[ROW][C]2840.81845949446[/C][/ROW]
[ROW][C]-4443.45964116622[/C][/ROW]
[ROW][C]-4267.11361425887[/C][/ROW]
[ROW][C]-1292.01546993382[/C][/ROW]
[ROW][C]-5678.78004533326[/C][/ROW]
[ROW][C]-4523.53678533896[/C][/ROW]
[ROW][C]-1839.54438877224[/C][/ROW]
[ROW][C]-4701.51372500298[/C][/ROW]
[ROW][C]-4137.6469113874[/C][/ROW]
[ROW][C]1367.58249373615[/C][/ROW]
[ROW][C]-1904.58856198202[/C][/ROW]
[ROW][C]433.511466560192[/C][/ROW]
[ROW][C]2908.66089844026[/C][/ROW]
[ROW][C]1822.29720032327[/C][/ROW]
[ROW][C]-537.280331245181[/C][/ROW]
[ROW][C]6728.29583091808[/C][/ROW]
[ROW][C]-7597.39505881887[/C][/ROW]
[ROW][C]4285.77841621666[/C][/ROW]
[ROW][C]10096.6170517689[/C][/ROW]
[ROW][C]2747.85461391733[/C][/ROW]
[ROW][C]-1581.48677716442[/C][/ROW]
[ROW][C]4310.40740173091[/C][/ROW]
[ROW][C]-5312.25098913871[/C][/ROW]
[ROW][C]3318.091180433[/C][/ROW]
[ROW][C]-357.65700675446[/C][/ROW]
[ROW][C]-1729.14508175683[/C][/ROW]
[ROW][C]5143.92490222659[/C][/ROW]
[ROW][C]265.594528874469[/C][/ROW]
[ROW][C]2322.36641515234[/C][/ROW]
[ROW][C]-2899.52054265905[/C][/ROW]
[ROW][C]-3242.35299746476[/C][/ROW]
[ROW][C]109.409824269169[/C][/ROW]
[ROW][C]3506.03601884267[/C][/ROW]
[ROW][C]5956.92504335818[/C][/ROW]
[ROW][C]-2625.35239529603[/C][/ROW]
[ROW][C]3848.5893895856[/C][/ROW]
[ROW][C]236.144076978104[/C][/ROW]
[ROW][C]-4028.53915680348[/C][/ROW]
[ROW][C]4401.3899850659[/C][/ROW]
[ROW][C]-5909.31459074716[/C][/ROW]
[ROW][C]10330.3964320811[/C][/ROW]
[ROW][C]4563.69726372298[/C][/ROW]
[ROW][C]6777.84754522102[/C][/ROW]
[ROW][C]-2320.53076996816[/C][/ROW]
[ROW][C]9957.25197023381[/C][/ROW]
[ROW][C]-4275.01256308276[/C][/ROW]
[ROW][C]3818.34697184981[/C][/ROW]
[ROW][C]3.48332031059545[/C][/ROW]
[ROW][C]-144.881815391025[/C][/ROW]
[ROW][C]3828.66402911949[/C][/ROW]
[ROW][C]-1449.12951508987[/C][/ROW]
[ROW][C]-1266.67428132641[/C][/ROW]
[ROW][C]650.177914723296[/C][/ROW]
[ROW][C]-2098.54061494287[/C][/ROW]
[ROW][C]66.9076003852533[/C][/ROW]
[ROW][C]-1988.20904039191[/C][/ROW]
[ROW][C]617.550650745696[/C][/ROW]
[ROW][C]2634.77398903739[/C][/ROW]
[ROW][C]4589.22214112988[/C][/ROW]
[ROW][C]-1065.73138501400[/C][/ROW]
[ROW][C]1194.38691639631[/C][/ROW]
[ROW][C]6026.84158741996[/C][/ROW]
[ROW][C]-833.445387508626[/C][/ROW]
[ROW][C]2394.47868785662[/C][/ROW]
[/TABLE]
Source: https://freestatistics.org/blog/index.php?pk=35589&T=2

Globally Unique Identifier (entire table): ba.freestatistics.org/blog/index.php?pk=35589&T=2

As an alternative you can also use a QR Code:  

The GUIDs for individual cells are displayed in the table below:

Estimated ARIMA Residuals
Value
21.5379762202715
-1894.0409671755
6455.20328292694
43.8493637581517
5009.44890535869
-7193.50059200805
-4763.01754711292
-3250.20464543001
-4961.76593510035
2840.81845949446
-4443.45964116622
-4267.11361425887
-1292.01546993382
-5678.78004533326
-4523.53678533896
-1839.54438877224
-4701.51372500298
-4137.6469113874
1367.58249373615
-1904.58856198202
433.511466560192
2908.66089844026
1822.29720032327
-537.280331245181
6728.29583091808
-7597.39505881887
4285.77841621666
10096.6170517689
2747.85461391733
-1581.48677716442
4310.40740173091
-5312.25098913871
3318.091180433
-357.65700675446
-1729.14508175683
5143.92490222659
265.594528874469
2322.36641515234
-2899.52054265905
-3242.35299746476
109.409824269169
3506.03601884267
5956.92504335818
-2625.35239529603
3848.5893895856
236.144076978104
-4028.53915680348
4401.3899850659
-5909.31459074716
10330.3964320811
4563.69726372298
6777.84754522102
-2320.53076996816
9957.25197023381
-4275.01256308276
3818.34697184981
3.48332031059545
-144.881815391025
3828.66402911949
-1449.12951508987
-1266.67428132641
650.177914723296
-2098.54061494287
66.9076003852533
-1988.20904039191
617.550650745696
2634.77398903739
4589.22214112988
-1065.73138501400
1194.38691639631
6026.84158741996
-833.445387508626
2394.47868785662


Parameters (Session):
par1 = 60 ; par2 = 1 ; par3 = 0 ; par4 = 1 ; par5 = 12 ;
Parameters (R input):
par1 = FALSE ; par2 = 1 ; par3 = 0 ; par4 = 1 ; par5 = 12 ; par6 = 1 ; par7 = 0 ; par8 = 2 ; par9 = 0 ;
R code (references can be found in the software module):
library(lattice)
if (par1 == 'TRUE') par1 <- TRUE
if (par1 == 'FALSE') par1 <- FALSE
par2 <- as.numeric(par2) #Box-Cox lambda transformation parameter
par3 <- as.numeric(par3) #degree of non-seasonal differencing
par4 <- as.numeric(par4) #degree of seasonal differencing
par5 <- as.numeric(par5) #seasonal period
par6 <- as.numeric(par6) #degree (p) of the non-seasonal AR(p) polynomial
par7 <- as.numeric(par7) #degree (q) of the non-seasonal MA(q) polynomial
par8 <- as.numeric(par8) #degree (P) of the seasonal AR(P) polynomial
par9 <- as.numeric(par9) #degree (Q) of the seasonal MA(Q) polynomial
armaGR <- function(arima.out, names, n){
try1 <- arima.out$coef
try2 <- sqrt(diag(arima.out$var.coef))
try.data.frame <- data.frame(matrix(NA,ncol=4,nrow=length(names)))
dimnames(try.data.frame) <- list(names,c('coef','std','tstat','pv'))
try.data.frame[,1] <- try1
for(i in 1:length(try2)) try.data.frame[which(rownames(try.data.frame)==names(try2)[i]),2] <- try2[i]
try.data.frame[,3] <- try.data.frame[,1] / try.data.frame[,2]
try.data.frame[,4] <- round((1-pt(abs(try.data.frame[,3]),df=n-(length(try2)+1)))*2,5)
vector <- rep(NA,length(names))
vector[is.na(try.data.frame[,4])] <- 0
maxi <- which.max(try.data.frame[,4])
continue <- max(try.data.frame[,4],na.rm=TRUE) > .05
vector[maxi] <- 0
list(summary=try.data.frame,next.vector=vector,continue=continue)
}
arimaSelect <- function(series, order=c(13,0,0), seasonal=list(order=c(2,0,0),period=12), include.mean=F){
nrc <- order[1]+order[3]+seasonal$order[1]+seasonal$order[3]
coeff <- matrix(NA, nrow=nrc*2, ncol=nrc)
pval <- matrix(NA, nrow=nrc*2, ncol=nrc)
mylist <- rep(list(NULL), nrc)
names <- NULL
if(order[1] > 0) names <- paste('ar',1:order[1],sep='')
if(order[3] > 0) names <- c( names , paste('ma',1:order[3],sep='') )
if(seasonal$order[1] > 0) names <- c(names, paste('sar',1:seasonal$order[1],sep=''))
if(seasonal$order[3] > 0) names <- c(names, paste('sma',1:seasonal$order[3],sep=''))
arima.out <- arima(series, order=order, seasonal=seasonal, include.mean=include.mean, method='ML')
mylist[[1]] <- arima.out
last.arma <- armaGR(arima.out, names, length(series))
mystop <- FALSE
i <- 1
coeff[i,] <- last.arma[[1]][,1]
pval [i,] <- last.arma[[1]][,4]
i <- 2
aic <- arima.out$aic
while(!mystop){
mylist[[i]] <- arima.out
arima.out <- arima(series, order=order, seasonal=seasonal, include.mean=include.mean, method='ML', fixed=last.arma$next.vector)
aic <- c(aic, arima.out$aic)
last.arma <- armaGR(arima.out, names, length(series))
mystop <- !last.arma$continue
coeff[i,] <- last.arma[[1]][,1]
pval [i,] <- last.arma[[1]][,4]
i <- i+1
}
list(coeff, pval, mylist, aic=aic)
}
arimaSelectplot <- function(arimaSelect.out,noms,choix){
noms <- names(arimaSelect.out[[3]][[1]]$coef)
coeff <- arimaSelect.out[[1]]
k <- min(which(is.na(coeff[,1])))-1
coeff <- coeff[1:k,]
pval <- arimaSelect.out[[2]][1:k,]
aic <- arimaSelect.out$aic[1:k]
coeff[coeff==0] <- NA
n <- ncol(coeff)
if(missing(choix)) choix <- k
layout(matrix(c(1,1,1,2,
3,3,3,2,
3,3,3,4,
5,6,7,7),nr=4),
widths=c(10,35,45,15),
heights=c(30,30,15,15))
couleurs <- rainbow(75)[1:50]#(50)
ticks <- pretty(coeff)
par(mar=c(1,1,3,1))
plot(aic,k:1-.5,type='o',pch=21,bg='blue',cex=2,axes=F,lty=2,xpd=NA)
points(aic[choix],k-choix+.5,pch=21,cex=4,bg=2,xpd=NA)
title('aic',line=2)
par(mar=c(3,0,0,0))
plot(0,axes=F,xlab='',ylab='',xlim=range(ticks),ylim=c(.1,1))
rect(xleft = min(ticks) + (0:49)/50*(max(ticks)-min(ticks)),
xright = min(ticks) + (1:50)/50*(max(ticks)-min(ticks)),
ytop = rep(1,50),
ybottom= rep(0,50),col=couleurs,border=NA)
axis(1,ticks)
rect(xleft=min(ticks),xright=max(ticks),ytop=1,ybottom=0)
text(mean(coeff,na.rm=T),.5,'coefficients',cex=2,font=2)
par(mar=c(1,1,3,1))
image(1:n,1:k,t(coeff[k:1,]),axes=F,col=couleurs,zlim=range(ticks))
for(i in 1:n) for(j in 1:k) if(!is.na(coeff[j,i])) {
if(pval[j,i]<.01) symb = 'green'
else if( (pval[j,i]<.05) & (pval[j,i]>=.01)) symb = 'orange'
else if( (pval[j,i]<.1) & (pval[j,i]>=.05)) symb = 'red'
else symb = 'black'
polygon(c(i+.5 ,i+.2 ,i+.5 ,i+.5),
c(k-j+0.5,k-j+0.5,k-j+0.8,k-j+0.5),
col=symb)
if(j==choix) {
rect(xleft=i-.5,
xright=i+.5,
ybottom=k-j+1.5,
ytop=k-j+.5,
lwd=4)
text(i,
k-j+1,
round(coeff[j,i],2),
cex=1.2,
font=2)
}
else{
rect(xleft=i-.5,xright=i+.5,ybottom=k-j+1.5,ytop=k-j+.5)
text(i,k-j+1,round(coeff[j,i],2),cex=1.2,font=1)
}
}
axis(3,1:n,noms)
par(mar=c(0.5,0,0,0.5))
plot(0,axes=F,xlab='',ylab='',type='n',xlim=c(0,8),ylim=c(-.2,.8))
cols <- c('green','orange','red','black')
niv <- c('0','0.01','0.05','0.1')
for(i in 0:3){
polygon(c(1+2*i ,1+2*i ,1+2*i-.5 ,1+2*i),
c(.4 ,.7 , .4 , .4),
col=cols[i+1])
text(2*i,0.5,niv[i+1],cex=1.5)
}
text(8,.5,1,cex=1.5)
text(4,0,'p-value',cex=2)
box()
residus <- arimaSelect.out[[3]][[choix]]$res
par(mar=c(1,2,4,1))
acf(residus,main='')
title('acf',line=.5)
par(mar=c(1,2,4,1))
pacf(residus,main='')
title('pacf',line=.5)
par(mar=c(2,2,4,1))
qqnorm(residus,main='')
title('qq-norm',line=.5)
qqline(residus)
residus
}
if (par2 == 0) x <- log(x)
if (par2 != 0) x <- x^par2
(selection <- arimaSelect(x, order=c(par6,par3,par7), seasonal=list(order=c(par8,par4,par9), period=par5)))
bitmap(file='test1.png')
resid <- arimaSelectplot(selection)
dev.off()
resid
bitmap(file='test2.png')
acf(resid,length(resid)/2, main='Residual Autocorrelation Function')
dev.off()
bitmap(file='test3.png')
pacf(resid,length(resid)/2, main='Residual Partial Autocorrelation Function')
dev.off()
bitmap(file='test4.png')
cpgram(resid, main='Residual Cumulative Periodogram')
dev.off()
bitmap(file='test5.png')
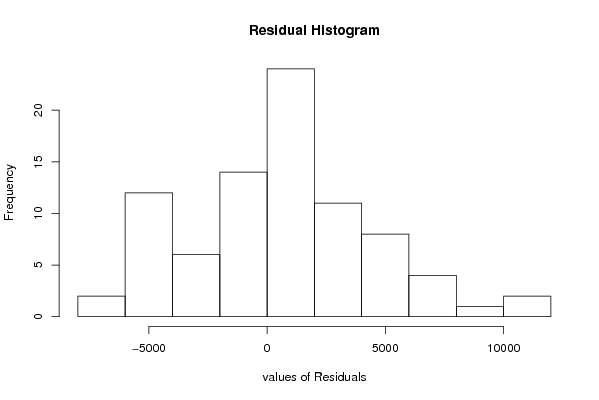
hist(resid, main='Residual Histogram', xlab='values of Residuals')
dev.off()
bitmap(file='test6.png')
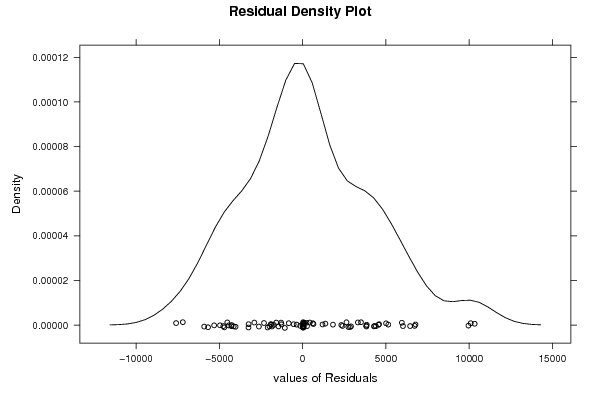
densityplot(~resid,col='black',main='Residual Density Plot', xlab='values of Residuals')
dev.off()
bitmap(file='test7.png')
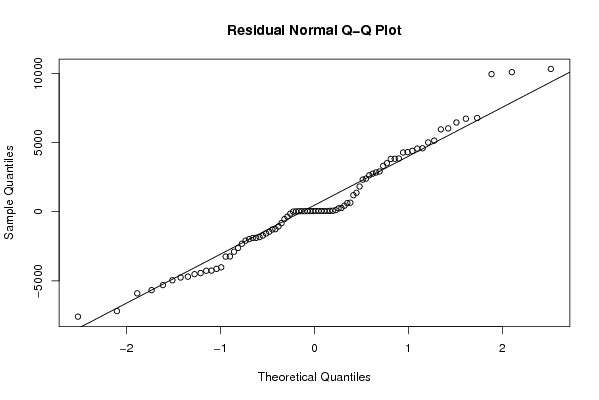
qqnorm(resid, main='Residual Normal Q-Q Plot')
qqline(resid)
dev.off()
ncols <- length(selection[[1]][1,])
nrows <- length(selection[[2]][,1])-1
load(file='createtable')
a<-table.start()
a<-table.row.start(a)
a<-table.element(a,'ARIMA Parameter Estimation and Backward Selection', ncols+1,TRUE)
a<-table.row.end(a)
a<-table.row.start(a)
a<-table.element(a,'Iteration', header=TRUE)
for (i in 1:ncols) {
a<-table.element(a,names(selection[[3]][[1]]$coef)[i],header=TRUE)
}
a<-table.row.end(a)
for (j in 1:nrows) {
a<-table.row.start(a)
mydum <- 'Estimates ('
mydum <- paste(mydum,j)
mydum <- paste(mydum,')')
a<-table.element(a,mydum, header=TRUE)
for (i in 1:ncols) {
a<-table.element(a,round(selection[[1]][j,i],4))
}
a<-table.row.end(a)
a<-table.row.start(a)
a<-table.element(a,'(p-val)', header=TRUE)
for (i in 1:ncols) {
mydum <- '('
mydum <- paste(mydum,round(selection[[2]][j,i],4),sep='')
mydum <- paste(mydum,')')
a<-table.element(a,mydum)
}
a<-table.row.end(a)
}
a<-table.end(a)
table.save(a,file='mytable.tab')
a<-table.start()
a<-table.row.start(a)
a<-table.element(a,'Estimated ARIMA Residuals', 1,TRUE)
a<-table.row.end(a)
a<-table.row.start(a)
a<-table.element(a,'Value', 1,TRUE)
a<-table.row.end(a)
for (i in (par4*par5+par3):length(resid)) {
a<-table.row.start(a)
a<-table.element(a,resid[i])
a<-table.row.end(a)
}
a<-table.end(a)
table.save(a,file='mytable1.tab')