Free Statistics
of Irreproducible Research!
Description of Statistical Computation | |||||||||||||||||||||||||||||||||||||||||
|---|---|---|---|---|---|---|---|---|---|---|---|---|---|---|---|---|---|---|---|---|---|---|---|---|---|---|---|---|---|---|---|---|---|---|---|---|---|---|---|---|---|
| Author's title | |||||||||||||||||||||||||||||||||||||||||
| Author | *The author of this computation has been verified* | ||||||||||||||||||||||||||||||||||||||||
| R Software Module | rwasp_univariatedataseries.wasp | ||||||||||||||||||||||||||||||||||||||||
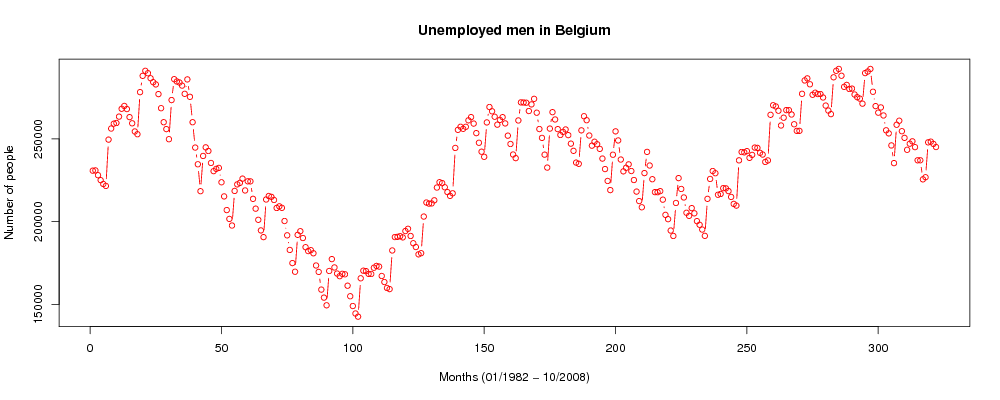
| Title produced by software | Univariate Data Series | ||||||||||||||||||||||||||||||||||||||||
| Date of computation | Sat, 20 Dec 2008 16:05:36 -0700 | ||||||||||||||||||||||||||||||||||||||||
| Cite this page as follows | Statistical Computations at FreeStatistics.org, Office for Research Development and Education, URL https://freestatistics.org/blog/index.php?v=date/2008/Dec/21/t1229814411yc9thf09bapp8u0.htm/, Retrieved Fri, 17 May 2024 05:45:32 +0000 | ||||||||||||||||||||||||||||||||||||||||
| Statistical Computations at FreeStatistics.org, Office for Research Development and Education, URL https://freestatistics.org/blog/index.php?pk=35461, Retrieved Fri, 17 May 2024 05:45:32 +0000 | |||||||||||||||||||||||||||||||||||||||||
| QR Codes: | |||||||||||||||||||||||||||||||||||||||||
|
| |||||||||||||||||||||||||||||||||||||||||
| Original text written by user: | |||||||||||||||||||||||||||||||||||||||||
| IsPrivate? | No (this computation is public) | ||||||||||||||||||||||||||||||||||||||||
| User-defined keywords | s0800650 Jan Werkhoven | ||||||||||||||||||||||||||||||||||||||||
| Estimated Impact | 182 | ||||||||||||||||||||||||||||||||||||||||
Tree of Dependent Computations | |||||||||||||||||||||||||||||||||||||||||
| Family? (F = Feedback message, R = changed R code, M = changed R Module, P = changed Parameters, D = changed Data) | |||||||||||||||||||||||||||||||||||||||||
| - [Univariate Data Series] [Unemployed men in...] [2008-12-20 23:05:36] [721fbc57bdc4e4e6ec78137fe5a723c9] [Current] | |||||||||||||||||||||||||||||||||||||||||
| Feedback Forum | |||||||||||||||||||||||||||||||||||||||||
Post a new message | |||||||||||||||||||||||||||||||||||||||||
Dataset | |||||||||||||||||||||||||||||||||||||||||
| Dataseries X: | |||||||||||||||||||||||||||||||||||||||||
230801 230963 228056 225053 222738 221564 249558 256255 259208 259633 263473 268227 269936 268062 263164 259447 254491 252835 278278 288118 291164 289725 286673 284299 282947 277084 268565 260095 255940 249824 273487 286106 284716 284086 282226 277259 285988 275438 260088 244764 234673 218389 239693 244896 242697 235453 230504 231880 232473 223772 215248 206977 201632 197627 218552 222521 223391 225972 218845 224369 224338 213758 207825 201085 194670 190609 213370 215489 214963 213072 208244 209232 208324 200353 191718 182861 174911 169682 192006 194187 190079 184526 182184 182732 180855 173467 169589 158891 154042 149402 170143 177325 172283 168606 167005 168430 168153 161237 154875 148966 144448 142535 165734 170309 170080 168393 168341 172095 173211 172796 167130 163466 159879 159179 182553 190672 190787 191185 190477 194290 195643 191313 186922 184629 180214 180891 203057 211527 210864 211007 212885 220586 223821 223294 220780 217846 215557 217120 244550 255474 257349 256101 257321 261238 263166 259265 253493 247671 242263 239186 259973 269287 266719 263400 258618 261472 263151 259372 251960 246936 240570 238382 261156 272095 272017 271876 266863 270878 274212 265841 255968 250606 240470 232662 256235 266169 261751 255914 252397 254227 255699 252285 247132 242785 235667 234952 255179 263727 261315 252049 245914 248289 246790 243978 238108 231776 224585 219058 240429 254569 249074 237521 230384 232521 234611 230592 225144 218143 212434 208676 229328 242148 233916 225628 217837 217786 218413 213261 204094 201484 194600 191325 211261 226293 219734 214591 205348 203496 208155 205010 200290 198088 195186 191395 213768 225780 230579 229261 216228 216713 220206 220115 218444 214912 210705 209673 237041 242081 241878 242621 238545 240337 244752 244576 241572 240541 236089 236997 264579 270349 269645 267037 258113 262813 267413 267366 264777 258863 254844 254868 277267 285351 286602 283042 276687 277915 277128 277103 275037 270150 267140 264993 287259 291186 292300 288186 281477 282656 280190 280408 276836 275216 274352 271311 289802 290726 292300 278506 269826 265861 269034 264176 255198 253353 246057 235372 258556 260993 254663 250643 243422 247105 248541 245039 237080 237085 225554 226839 247934 248333 246969 245098 | |||||||||||||||||||||||||||||||||||||||||
Tables (Output of Computation) | |||||||||||||||||||||||||||||||||||||||||
| |||||||||||||||||||||||||||||||||||||||||
Figures (Output of Computation) | |||||||||||||||||||||||||||||||||||||||||
Input Parameters & R Code | |||||||||||||||||||||||||||||||||||||||||
| Parameters (Session): | |||||||||||||||||||||||||||||||||||||||||
| par1 = Unemployed men in Belgium (01/1982 - 10/2008) ; par2 = http://www.freestatistics.org/blog/index.php?v=date/2008/Nov/03/t1225746260yh9sj0p4y1ntjsj.htm ; par3 = Unemployed men in Belgium (01/1982 - 10/2008) ; | |||||||||||||||||||||||||||||||||||||||||
| Parameters (R input): | |||||||||||||||||||||||||||||||||||||||||
| par1 = Unemployed men in Belgium (01/1982 - 10/2008) ; par2 = http://www.freestatistics.org/blog/index.php?v=date/2008/Nov/03/t1225746260yh9sj0p4y1ntjsj.htm ; par3 = Unemployed men in Belgium (01/1982 - 10/2008) ; | |||||||||||||||||||||||||||||||||||||||||
| R code (references can be found in the software module): | |||||||||||||||||||||||||||||||||||||||||
bitmap(file='test1.png') | |||||||||||||||||||||||||||||||||||||||||