Free Statistics

of Irreproducible Research!

Author's title

Author*Unverified author*
R Software Modulerwasp_multipleregression.wasp
Title produced by softwareMultiple Regression
Date of computationSat, 20 Dec 2008 07:33:45 -0700
Cite this page as followsStatistical Computations at FreeStatistics.org, Office for Research Development and Education, URL https://freestatistics.org/blog/index.php?v=date/2008/Dec/20/t12297852173ltxqmx0526xduh.htm/, Retrieved Wed, 22 May 2024 09:56:56 +0000
Statistical Computations at FreeStatistics.org, Office for Research Development and Education, URL https://freestatistics.org/blog/index.php?pk=35396, Retrieved Wed, 22 May 2024 09:56:56 +0000
QR Codes:

Original text written by user:
IsPrivate?No (this computation is public)
User-defined keywords
Estimated Impact222
Family? (F = Feedback message, R = changed R code, M = changed R Module, P = changed Parameters, D = changed Data)
F     [ARIMA Forecasting] [hfdst 21 arima fo...] [2008-12-15 08:32:33] [11edab5c4db3615abbf782b1c6e7cacf]
- RMPD    [Multiple Regression] [paper_Multiple Re...] [2008-12-20 14:33:45] [e860142344f45cb4bd8fdb3c72c8e3d6] [Current]
Feedback Forum

Post a new message
Dataseries X:
0,89	0
0,89	0
0,89	0
0,89	0
0,89	0
0,89	0
0,89	0
0,9	0
0,91	0
0,92	0
0,92	0
0,92	0
0,92	0
0,92	0
0,92	0
0,92	0
0,92	0
0,92	0
0,92	0
0,92	0
0,92	0
0,92	0
0,92	0
0,92	0
0,92	0
0,92	0
0,92	0
0,92	0
0,92	0
0,92	0
0,92	0
0,92	0
0,92	0
0,92	0
0,92	0
0,92	0
0,92	0
0,92	0
1,01	1
1,01	1
1,01	1
1,01	1
1,01	1
1,04	1
1,05	1
1,05	1
1,06	1
1,06	1
1,06	1
1,06	1
1,08	1
1,08	1
1,08	1
1,08	1
1,08	1
1,08	1
1,09	1
1,09	1
1,1	1
1,1	1
1,1	1


Summary of computational transaction
Raw Inputview raw input (R code)
Raw Outputview raw output of R engine
Computing time4 seconds
R Server'Gwilym Jenkins' @ 72.249.127.135

\begin{tabular}{lllllllll}
\hline
Summary of computational transaction \tabularnewline
Raw Input & view raw input (R code)  \tabularnewline
Raw Output & view raw output of R engine  \tabularnewline
Computing time & 4 seconds \tabularnewline
R Server & 'Gwilym Jenkins' @ 72.249.127.135 \tabularnewline
\hline
\end{tabular}
%Source: https://freestatistics.org/blog/index.php?pk=35396&T=0

[TABLE]
[ROW][C]Summary of computational transaction[/C][/ROW]
[ROW][C]Raw Input[/C][C]view raw input (R code) [/C][/ROW]
[ROW][C]Raw Output[/C][C]view raw output of R engine [/C][/ROW]
[ROW][C]Computing time[/C][C]4 seconds[/C][/ROW]
[ROW][C]R Server[/C][C]'Gwilym Jenkins' @ 72.249.127.135[/C][/ROW]
[/TABLE]
Source: https://freestatistics.org/blog/index.php?pk=35396&T=0

Globally Unique Identifier (entire table): ba.freestatistics.org/blog/index.php?pk=35396&T=0

As an alternative you can also use a QR Code:  

The GUIDs for individual cells are displayed in the table below:

Summary of computational transaction
Raw Inputview raw input (R code)
Raw Outputview raw output of R engine
Computing time4 seconds
R Server'Gwilym Jenkins' @ 72.249.127.135


Multiple Linear Regression - Estimated Regression Equation
y[t] = + 0.913684210526315 + 0.14675057208238x[t] + e[t]

\begin{tabular}{lllllllll}
\hline
Multiple Linear Regression - Estimated Regression Equation \tabularnewline
y[t] =  +  0.913684210526315 +  0.14675057208238x[t]  + e[t] \tabularnewline
\hline
\end{tabular}
%Source: https://freestatistics.org/blog/index.php?pk=35396&T=1

[TABLE]
[ROW][C]Multiple Linear Regression - Estimated Regression Equation[/C][/ROW]
[ROW][C]y[t] =  +  0.913684210526315 +  0.14675057208238x[t]  + e[t][/C][/ROW]
[/TABLE]
Source: https://freestatistics.org/blog/index.php?pk=35396&T=1

Globally Unique Identifier (entire table): ba.freestatistics.org/blog/index.php?pk=35396&T=1

As an alternative you can also use a QR Code:  

The GUIDs for individual cells are displayed in the table below:

Multiple Linear Regression - Estimated Regression Equation
y[t] = + 0.913684210526315 + 0.14675057208238x[t] + e[t]


Multiple Linear Regression - Ordinary Least Squares
VariableParameterS.D.T-STATH0: parameter = 02-tail p-value1-tail p-value
(Intercept)0.9136842105263150.003495261.455800
x0.146750572082380.00569125.785800

\begin{tabular}{lllllllll}
\hline
Multiple Linear Regression - Ordinary Least Squares \tabularnewline
Variable & Parameter & S.D. & T-STATH0: parameter = 0 & 2-tail p-value & 1-tail p-value \tabularnewline
(Intercept) & 0.913684210526315 & 0.003495 & 261.4558 & 0 & 0 \tabularnewline
x & 0.14675057208238 & 0.005691 & 25.7858 & 0 & 0 \tabularnewline
\hline
\end{tabular}
%Source: https://freestatistics.org/blog/index.php?pk=35396&T=2

[TABLE]
[ROW][C]Multiple Linear Regression - Ordinary Least Squares[/C][/ROW]
[ROW][C]Variable[/C][C]Parameter[/C][C]S.D.[/C][C]T-STATH0: parameter = 0[/C][C]2-tail p-value[/C][C]1-tail p-value[/C][/ROW]
[ROW][C](Intercept)[/C][C]0.913684210526315[/C][C]0.003495[/C][C]261.4558[/C][C]0[/C][C]0[/C][/ROW]
[ROW][C]x[/C][C]0.14675057208238[/C][C]0.005691[/C][C]25.7858[/C][C]0[/C][C]0[/C][/ROW]
[/TABLE]
Source: https://freestatistics.org/blog/index.php?pk=35396&T=2

Globally Unique Identifier (entire table): ba.freestatistics.org/blog/index.php?pk=35396&T=2

As an alternative you can also use a QR Code:  

The GUIDs for individual cells are displayed in the table below:

Multiple Linear Regression - Ordinary Least Squares
VariableParameterS.D.T-STATH0: parameter = 02-tail p-value1-tail p-value
(Intercept)0.9136842105263150.003495261.455800
x0.146750572082380.00569125.785800


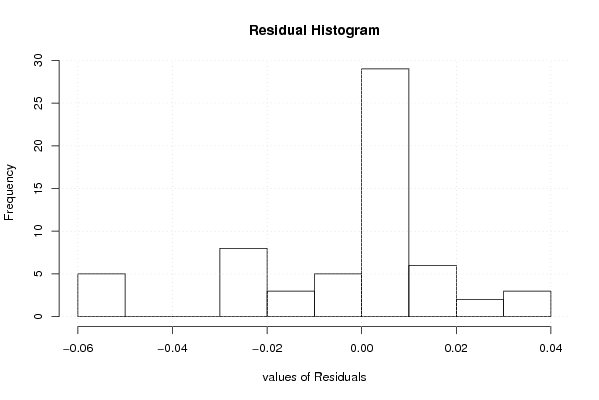
Multiple Linear Regression - Regression Statistics
Multiple R0.958383012188892
R-squared0.918497998052255
Adjusted R-squared0.917116608188734
F-TEST (value)664.90859843943
F-TEST (DF numerator)1
F-TEST (DF denominator)59
p-value0
Multiple Linear Regression - Residual Statistics
Residual Standard Deviation0.0215421788474474
Sum Squared Residuals0.0273798627002292

\begin{tabular}{lllllllll}
\hline
Multiple Linear Regression - Regression Statistics \tabularnewline
Multiple R & 0.958383012188892 \tabularnewline
R-squared & 0.918497998052255 \tabularnewline
Adjusted R-squared & 0.917116608188734 \tabularnewline
F-TEST (value) & 664.90859843943 \tabularnewline
F-TEST (DF numerator) & 1 \tabularnewline
F-TEST (DF denominator) & 59 \tabularnewline
p-value & 0 \tabularnewline
Multiple Linear Regression - Residual Statistics \tabularnewline
Residual Standard Deviation & 0.0215421788474474 \tabularnewline
Sum Squared Residuals & 0.0273798627002292 \tabularnewline
\hline
\end{tabular}
%Source: https://freestatistics.org/blog/index.php?pk=35396&T=3

[TABLE]
[ROW][C]Multiple Linear Regression - Regression Statistics[/C][/ROW]
[ROW][C]Multiple R[/C][C]0.958383012188892[/C][/ROW]
[ROW][C]R-squared[/C][C]0.918497998052255[/C][/ROW]
[ROW][C]Adjusted R-squared[/C][C]0.917116608188734[/C][/ROW]
[ROW][C]F-TEST (value)[/C][C]664.90859843943[/C][/ROW]
[ROW][C]F-TEST (DF numerator)[/C][C]1[/C][/ROW]
[ROW][C]F-TEST (DF denominator)[/C][C]59[/C][/ROW]
[ROW][C]p-value[/C][C]0[/C][/ROW]
[ROW][C]Multiple Linear Regression - Residual Statistics[/C][/ROW]
[ROW][C]Residual Standard Deviation[/C][C]0.0215421788474474[/C][/ROW]
[ROW][C]Sum Squared Residuals[/C][C]0.0273798627002292[/C][/ROW]
[/TABLE]
Source: https://freestatistics.org/blog/index.php?pk=35396&T=3

Globally Unique Identifier (entire table): ba.freestatistics.org/blog/index.php?pk=35396&T=3

As an alternative you can also use a QR Code:  

The GUIDs for individual cells are displayed in the table below:

Multiple Linear Regression - Regression Statistics
Multiple R0.958383012188892
R-squared0.918497998052255
Adjusted R-squared0.917116608188734
F-TEST (value)664.90859843943
F-TEST (DF numerator)1
F-TEST (DF denominator)59
p-value0
Multiple Linear Regression - Residual Statistics
Residual Standard Deviation0.0215421788474474
Sum Squared Residuals0.0273798627002292


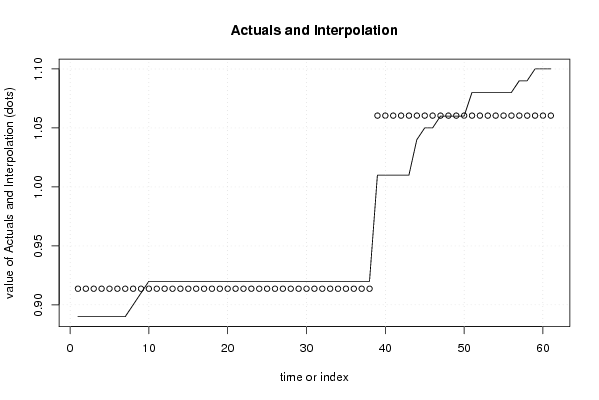
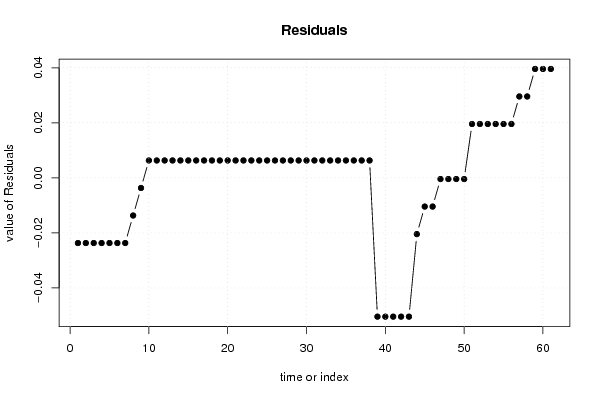
Multiple Linear Regression - Actuals, Interpolation, and Residuals
Time or IndexActualsInterpolationForecastResidualsPrediction Error
10.890.913684210526322-0.0236842105263218
20.890.913684210526316-0.0236842105263156
30.890.913684210526316-0.0236842105263157
40.890.913684210526316-0.0236842105263157
50.890.913684210526316-0.0236842105263157
60.890.913684210526316-0.0236842105263157
70.890.913684210526316-0.0236842105263157
80.90.913684210526316-0.0136842105263156
90.910.913684210526316-0.00368421052631563
100.920.9136842105263160.00631578947368438
110.920.9136842105263160.00631578947368438
120.920.9136842105263160.00631578947368438
130.920.9136842105263160.00631578947368438
140.920.9136842105263160.00631578947368438
150.920.9136842105263160.00631578947368438
160.920.9136842105263160.00631578947368438
170.920.9136842105263160.00631578947368438
180.920.9136842105263160.00631578947368438
190.920.9136842105263160.00631578947368438
200.920.9136842105263160.00631578947368438
210.920.9136842105263160.00631578947368438
220.920.9136842105263160.00631578947368438
230.920.9136842105263160.00631578947368438
240.920.9136842105263160.00631578947368438
250.920.9136842105263160.00631578947368438
260.920.9136842105263160.00631578947368438
270.920.9136842105263160.00631578947368438
280.920.9136842105263160.00631578947368438
290.920.9136842105263160.00631578947368438
300.920.9136842105263160.00631578947368438
310.920.9136842105263160.00631578947368438
320.920.9136842105263160.00631578947368438
330.920.9136842105263160.00631578947368438
340.920.9136842105263160.00631578947368438
350.920.9136842105263160.00631578947368438
360.920.9136842105263160.00631578947368438
370.920.9136842105263160.00631578947368438
380.920.9136842105263160.00631578947368438
391.011.06043478260870-0.0504347826086957
401.011.06043478260870-0.0504347826086957
411.011.06043478260870-0.0504347826086957
421.011.06043478260870-0.0504347826086957
431.011.06043478260870-0.0504347826086957
441.041.06043478260870-0.0204347826086957
451.051.06043478260870-0.0104347826086957
461.051.06043478260870-0.0104347826086957
471.061.06043478260870-0.000434782608695654
481.061.06043478260870-0.000434782608695654
491.061.06043478260870-0.000434782608695654
501.061.06043478260870-0.000434782608695654
511.081.060434782608700.0195652173913044
521.081.060434782608700.0195652173913044
531.081.060434782608700.0195652173913044
541.081.060434782608700.0195652173913044
551.081.060434782608700.0195652173913044
561.081.060434782608700.0195652173913044
571.091.060434782608700.0295652173913044
581.091.060434782608700.0295652173913044
591.11.060434782608700.0395652173913044
601.11.060434782608700.0395652173913044
611.11.060434782608700.0395652173913044

\begin{tabular}{lllllllll}
\hline
Multiple Linear Regression - Actuals, Interpolation, and Residuals \tabularnewline
Time or Index & Actuals & InterpolationForecast & ResidualsPrediction Error \tabularnewline
1 & 0.89 & 0.913684210526322 & -0.0236842105263218 \tabularnewline
2 & 0.89 & 0.913684210526316 & -0.0236842105263156 \tabularnewline
3 & 0.89 & 0.913684210526316 & -0.0236842105263157 \tabularnewline
4 & 0.89 & 0.913684210526316 & -0.0236842105263157 \tabularnewline
5 & 0.89 & 0.913684210526316 & -0.0236842105263157 \tabularnewline
6 & 0.89 & 0.913684210526316 & -0.0236842105263157 \tabularnewline
7 & 0.89 & 0.913684210526316 & -0.0236842105263157 \tabularnewline
8 & 0.9 & 0.913684210526316 & -0.0136842105263156 \tabularnewline
9 & 0.91 & 0.913684210526316 & -0.00368421052631563 \tabularnewline
10 & 0.92 & 0.913684210526316 & 0.00631578947368438 \tabularnewline
11 & 0.92 & 0.913684210526316 & 0.00631578947368438 \tabularnewline
12 & 0.92 & 0.913684210526316 & 0.00631578947368438 \tabularnewline
13 & 0.92 & 0.913684210526316 & 0.00631578947368438 \tabularnewline
14 & 0.92 & 0.913684210526316 & 0.00631578947368438 \tabularnewline
15 & 0.92 & 0.913684210526316 & 0.00631578947368438 \tabularnewline
16 & 0.92 & 0.913684210526316 & 0.00631578947368438 \tabularnewline
17 & 0.92 & 0.913684210526316 & 0.00631578947368438 \tabularnewline
18 & 0.92 & 0.913684210526316 & 0.00631578947368438 \tabularnewline
19 & 0.92 & 0.913684210526316 & 0.00631578947368438 \tabularnewline
20 & 0.92 & 0.913684210526316 & 0.00631578947368438 \tabularnewline
21 & 0.92 & 0.913684210526316 & 0.00631578947368438 \tabularnewline
22 & 0.92 & 0.913684210526316 & 0.00631578947368438 \tabularnewline
23 & 0.92 & 0.913684210526316 & 0.00631578947368438 \tabularnewline
24 & 0.92 & 0.913684210526316 & 0.00631578947368438 \tabularnewline
25 & 0.92 & 0.913684210526316 & 0.00631578947368438 \tabularnewline
26 & 0.92 & 0.913684210526316 & 0.00631578947368438 \tabularnewline
27 & 0.92 & 0.913684210526316 & 0.00631578947368438 \tabularnewline
28 & 0.92 & 0.913684210526316 & 0.00631578947368438 \tabularnewline
29 & 0.92 & 0.913684210526316 & 0.00631578947368438 \tabularnewline
30 & 0.92 & 0.913684210526316 & 0.00631578947368438 \tabularnewline
31 & 0.92 & 0.913684210526316 & 0.00631578947368438 \tabularnewline
32 & 0.92 & 0.913684210526316 & 0.00631578947368438 \tabularnewline
33 & 0.92 & 0.913684210526316 & 0.00631578947368438 \tabularnewline
34 & 0.92 & 0.913684210526316 & 0.00631578947368438 \tabularnewline
35 & 0.92 & 0.913684210526316 & 0.00631578947368438 \tabularnewline
36 & 0.92 & 0.913684210526316 & 0.00631578947368438 \tabularnewline
37 & 0.92 & 0.913684210526316 & 0.00631578947368438 \tabularnewline
38 & 0.92 & 0.913684210526316 & 0.00631578947368438 \tabularnewline
39 & 1.01 & 1.06043478260870 & -0.0504347826086957 \tabularnewline
40 & 1.01 & 1.06043478260870 & -0.0504347826086957 \tabularnewline
41 & 1.01 & 1.06043478260870 & -0.0504347826086957 \tabularnewline
42 & 1.01 & 1.06043478260870 & -0.0504347826086957 \tabularnewline
43 & 1.01 & 1.06043478260870 & -0.0504347826086957 \tabularnewline
44 & 1.04 & 1.06043478260870 & -0.0204347826086957 \tabularnewline
45 & 1.05 & 1.06043478260870 & -0.0104347826086957 \tabularnewline
46 & 1.05 & 1.06043478260870 & -0.0104347826086957 \tabularnewline
47 & 1.06 & 1.06043478260870 & -0.000434782608695654 \tabularnewline
48 & 1.06 & 1.06043478260870 & -0.000434782608695654 \tabularnewline
49 & 1.06 & 1.06043478260870 & -0.000434782608695654 \tabularnewline
50 & 1.06 & 1.06043478260870 & -0.000434782608695654 \tabularnewline
51 & 1.08 & 1.06043478260870 & 0.0195652173913044 \tabularnewline
52 & 1.08 & 1.06043478260870 & 0.0195652173913044 \tabularnewline
53 & 1.08 & 1.06043478260870 & 0.0195652173913044 \tabularnewline
54 & 1.08 & 1.06043478260870 & 0.0195652173913044 \tabularnewline
55 & 1.08 & 1.06043478260870 & 0.0195652173913044 \tabularnewline
56 & 1.08 & 1.06043478260870 & 0.0195652173913044 \tabularnewline
57 & 1.09 & 1.06043478260870 & 0.0295652173913044 \tabularnewline
58 & 1.09 & 1.06043478260870 & 0.0295652173913044 \tabularnewline
59 & 1.1 & 1.06043478260870 & 0.0395652173913044 \tabularnewline
60 & 1.1 & 1.06043478260870 & 0.0395652173913044 \tabularnewline
61 & 1.1 & 1.06043478260870 & 0.0395652173913044 \tabularnewline
\hline
\end{tabular}
%Source: https://freestatistics.org/blog/index.php?pk=35396&T=4

[TABLE]
[ROW][C]Multiple Linear Regression - Actuals, Interpolation, and Residuals[/C][/ROW]
[ROW][C]Time or Index[/C][C]Actuals[/C][C]InterpolationForecast[/C][C]ResidualsPrediction Error[/C][/ROW]
[ROW][C]1[/C][C]0.89[/C][C]0.913684210526322[/C][C]-0.0236842105263218[/C][/ROW]
[ROW][C]2[/C][C]0.89[/C][C]0.913684210526316[/C][C]-0.0236842105263156[/C][/ROW]
[ROW][C]3[/C][C]0.89[/C][C]0.913684210526316[/C][C]-0.0236842105263157[/C][/ROW]
[ROW][C]4[/C][C]0.89[/C][C]0.913684210526316[/C][C]-0.0236842105263157[/C][/ROW]
[ROW][C]5[/C][C]0.89[/C][C]0.913684210526316[/C][C]-0.0236842105263157[/C][/ROW]
[ROW][C]6[/C][C]0.89[/C][C]0.913684210526316[/C][C]-0.0236842105263157[/C][/ROW]
[ROW][C]7[/C][C]0.89[/C][C]0.913684210526316[/C][C]-0.0236842105263157[/C][/ROW]
[ROW][C]8[/C][C]0.9[/C][C]0.913684210526316[/C][C]-0.0136842105263156[/C][/ROW]
[ROW][C]9[/C][C]0.91[/C][C]0.913684210526316[/C][C]-0.00368421052631563[/C][/ROW]
[ROW][C]10[/C][C]0.92[/C][C]0.913684210526316[/C][C]0.00631578947368438[/C][/ROW]
[ROW][C]11[/C][C]0.92[/C][C]0.913684210526316[/C][C]0.00631578947368438[/C][/ROW]
[ROW][C]12[/C][C]0.92[/C][C]0.913684210526316[/C][C]0.00631578947368438[/C][/ROW]
[ROW][C]13[/C][C]0.92[/C][C]0.913684210526316[/C][C]0.00631578947368438[/C][/ROW]
[ROW][C]14[/C][C]0.92[/C][C]0.913684210526316[/C][C]0.00631578947368438[/C][/ROW]
[ROW][C]15[/C][C]0.92[/C][C]0.913684210526316[/C][C]0.00631578947368438[/C][/ROW]
[ROW][C]16[/C][C]0.92[/C][C]0.913684210526316[/C][C]0.00631578947368438[/C][/ROW]
[ROW][C]17[/C][C]0.92[/C][C]0.913684210526316[/C][C]0.00631578947368438[/C][/ROW]
[ROW][C]18[/C][C]0.92[/C][C]0.913684210526316[/C][C]0.00631578947368438[/C][/ROW]
[ROW][C]19[/C][C]0.92[/C][C]0.913684210526316[/C][C]0.00631578947368438[/C][/ROW]
[ROW][C]20[/C][C]0.92[/C][C]0.913684210526316[/C][C]0.00631578947368438[/C][/ROW]
[ROW][C]21[/C][C]0.92[/C][C]0.913684210526316[/C][C]0.00631578947368438[/C][/ROW]
[ROW][C]22[/C][C]0.92[/C][C]0.913684210526316[/C][C]0.00631578947368438[/C][/ROW]
[ROW][C]23[/C][C]0.92[/C][C]0.913684210526316[/C][C]0.00631578947368438[/C][/ROW]
[ROW][C]24[/C][C]0.92[/C][C]0.913684210526316[/C][C]0.00631578947368438[/C][/ROW]
[ROW][C]25[/C][C]0.92[/C][C]0.913684210526316[/C][C]0.00631578947368438[/C][/ROW]
[ROW][C]26[/C][C]0.92[/C][C]0.913684210526316[/C][C]0.00631578947368438[/C][/ROW]
[ROW][C]27[/C][C]0.92[/C][C]0.913684210526316[/C][C]0.00631578947368438[/C][/ROW]
[ROW][C]28[/C][C]0.92[/C][C]0.913684210526316[/C][C]0.00631578947368438[/C][/ROW]
[ROW][C]29[/C][C]0.92[/C][C]0.913684210526316[/C][C]0.00631578947368438[/C][/ROW]
[ROW][C]30[/C][C]0.92[/C][C]0.913684210526316[/C][C]0.00631578947368438[/C][/ROW]
[ROW][C]31[/C][C]0.92[/C][C]0.913684210526316[/C][C]0.00631578947368438[/C][/ROW]
[ROW][C]32[/C][C]0.92[/C][C]0.913684210526316[/C][C]0.00631578947368438[/C][/ROW]
[ROW][C]33[/C][C]0.92[/C][C]0.913684210526316[/C][C]0.00631578947368438[/C][/ROW]
[ROW][C]34[/C][C]0.92[/C][C]0.913684210526316[/C][C]0.00631578947368438[/C][/ROW]
[ROW][C]35[/C][C]0.92[/C][C]0.913684210526316[/C][C]0.00631578947368438[/C][/ROW]
[ROW][C]36[/C][C]0.92[/C][C]0.913684210526316[/C][C]0.00631578947368438[/C][/ROW]
[ROW][C]37[/C][C]0.92[/C][C]0.913684210526316[/C][C]0.00631578947368438[/C][/ROW]
[ROW][C]38[/C][C]0.92[/C][C]0.913684210526316[/C][C]0.00631578947368438[/C][/ROW]
[ROW][C]39[/C][C]1.01[/C][C]1.06043478260870[/C][C]-0.0504347826086957[/C][/ROW]
[ROW][C]40[/C][C]1.01[/C][C]1.06043478260870[/C][C]-0.0504347826086957[/C][/ROW]
[ROW][C]41[/C][C]1.01[/C][C]1.06043478260870[/C][C]-0.0504347826086957[/C][/ROW]
[ROW][C]42[/C][C]1.01[/C][C]1.06043478260870[/C][C]-0.0504347826086957[/C][/ROW]
[ROW][C]43[/C][C]1.01[/C][C]1.06043478260870[/C][C]-0.0504347826086957[/C][/ROW]
[ROW][C]44[/C][C]1.04[/C][C]1.06043478260870[/C][C]-0.0204347826086957[/C][/ROW]
[ROW][C]45[/C][C]1.05[/C][C]1.06043478260870[/C][C]-0.0104347826086957[/C][/ROW]
[ROW][C]46[/C][C]1.05[/C][C]1.06043478260870[/C][C]-0.0104347826086957[/C][/ROW]
[ROW][C]47[/C][C]1.06[/C][C]1.06043478260870[/C][C]-0.000434782608695654[/C][/ROW]
[ROW][C]48[/C][C]1.06[/C][C]1.06043478260870[/C][C]-0.000434782608695654[/C][/ROW]
[ROW][C]49[/C][C]1.06[/C][C]1.06043478260870[/C][C]-0.000434782608695654[/C][/ROW]
[ROW][C]50[/C][C]1.06[/C][C]1.06043478260870[/C][C]-0.000434782608695654[/C][/ROW]
[ROW][C]51[/C][C]1.08[/C][C]1.06043478260870[/C][C]0.0195652173913044[/C][/ROW]
[ROW][C]52[/C][C]1.08[/C][C]1.06043478260870[/C][C]0.0195652173913044[/C][/ROW]
[ROW][C]53[/C][C]1.08[/C][C]1.06043478260870[/C][C]0.0195652173913044[/C][/ROW]
[ROW][C]54[/C][C]1.08[/C][C]1.06043478260870[/C][C]0.0195652173913044[/C][/ROW]
[ROW][C]55[/C][C]1.08[/C][C]1.06043478260870[/C][C]0.0195652173913044[/C][/ROW]
[ROW][C]56[/C][C]1.08[/C][C]1.06043478260870[/C][C]0.0195652173913044[/C][/ROW]
[ROW][C]57[/C][C]1.09[/C][C]1.06043478260870[/C][C]0.0295652173913044[/C][/ROW]
[ROW][C]58[/C][C]1.09[/C][C]1.06043478260870[/C][C]0.0295652173913044[/C][/ROW]
[ROW][C]59[/C][C]1.1[/C][C]1.06043478260870[/C][C]0.0395652173913044[/C][/ROW]
[ROW][C]60[/C][C]1.1[/C][C]1.06043478260870[/C][C]0.0395652173913044[/C][/ROW]
[ROW][C]61[/C][C]1.1[/C][C]1.06043478260870[/C][C]0.0395652173913044[/C][/ROW]
[/TABLE]
Source: https://freestatistics.org/blog/index.php?pk=35396&T=4

Globally Unique Identifier (entire table): ba.freestatistics.org/blog/index.php?pk=35396&T=4

As an alternative you can also use a QR Code:  

The GUIDs for individual cells are displayed in the table below:

Multiple Linear Regression - Actuals, Interpolation, and Residuals
Time or IndexActualsInterpolationForecastResidualsPrediction Error
10.890.913684210526322-0.0236842105263218
20.890.913684210526316-0.0236842105263156
30.890.913684210526316-0.0236842105263157
40.890.913684210526316-0.0236842105263157
50.890.913684210526316-0.0236842105263157
60.890.913684210526316-0.0236842105263157
70.890.913684210526316-0.0236842105263157
80.90.913684210526316-0.0136842105263156
90.910.913684210526316-0.00368421052631563
100.920.9136842105263160.00631578947368438
110.920.9136842105263160.00631578947368438
120.920.9136842105263160.00631578947368438
130.920.9136842105263160.00631578947368438
140.920.9136842105263160.00631578947368438
150.920.9136842105263160.00631578947368438
160.920.9136842105263160.00631578947368438
170.920.9136842105263160.00631578947368438
180.920.9136842105263160.00631578947368438
190.920.9136842105263160.00631578947368438
200.920.9136842105263160.00631578947368438
210.920.9136842105263160.00631578947368438
220.920.9136842105263160.00631578947368438
230.920.9136842105263160.00631578947368438
240.920.9136842105263160.00631578947368438
250.920.9136842105263160.00631578947368438
260.920.9136842105263160.00631578947368438
270.920.9136842105263160.00631578947368438
280.920.9136842105263160.00631578947368438
290.920.9136842105263160.00631578947368438
300.920.9136842105263160.00631578947368438
310.920.9136842105263160.00631578947368438
320.920.9136842105263160.00631578947368438
330.920.9136842105263160.00631578947368438
340.920.9136842105263160.00631578947368438
350.920.9136842105263160.00631578947368438
360.920.9136842105263160.00631578947368438
370.920.9136842105263160.00631578947368438
380.920.9136842105263160.00631578947368438
391.011.06043478260870-0.0504347826086957
401.011.06043478260870-0.0504347826086957
411.011.06043478260870-0.0504347826086957
421.011.06043478260870-0.0504347826086957
431.011.06043478260870-0.0504347826086957
441.041.06043478260870-0.0204347826086957
451.051.06043478260870-0.0104347826086957
461.051.06043478260870-0.0104347826086957
471.061.06043478260870-0.000434782608695654
481.061.06043478260870-0.000434782608695654
491.061.06043478260870-0.000434782608695654
501.061.06043478260870-0.000434782608695654
511.081.060434782608700.0195652173913044
521.081.060434782608700.0195652173913044
531.081.060434782608700.0195652173913044
541.081.060434782608700.0195652173913044
551.081.060434782608700.0195652173913044
561.081.060434782608700.0195652173913044
571.091.060434782608700.0295652173913044
581.091.060434782608700.0295652173913044
591.11.060434782608700.0395652173913044
601.11.060434782608700.0395652173913044
611.11.060434782608700.0395652173913044


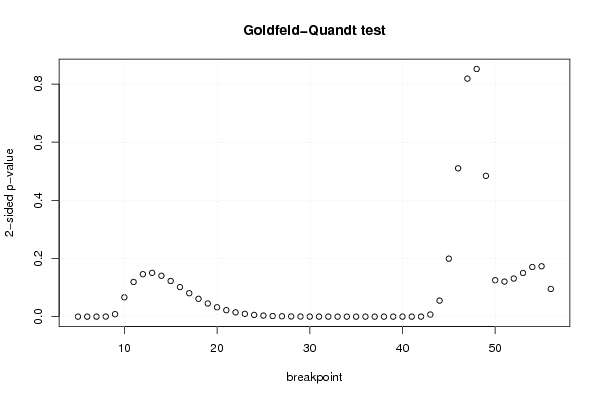
Goldfeld-Quandt test for Heteroskedasticity
p-valuesAlternative Hypothesis
breakpoint indexgreater2-sidedless
53.12109876090732e-436.24219752181464e-431
62.05025748893310e-554.10051497786621e-551
76.92331633376045e-701.38466326675209e-691
80.0001745592578997140.0003491185157994290.9998254407421
90.004277941980618110.008555883961236210.995722058019382
100.03329140579152520.06658281158305040.966708594208475
110.05968923641196410.1193784728239280.940310763588036
120.0730309555710550.146061911142110.926969044428945
130.07529637294009360.1505927458801870.924703627059906
140.07031366942725020.1406273388545000.92968633057275
150.06136312105814030.1227262421162810.93863687894186
160.0508337318144730.1016674636289460.949166268185527
170.04031501693446260.08063003386892520.959684983065537
180.03076079806642070.06152159613284150.96923920193358
190.02264901503831660.04529803007663320.977350984961683
200.01612286639103690.03224573278207370.983877133608963
210.01110971093990010.02221942187980020.9888902890601
220.007416022811030610.01483204562206120.99258397718897
230.00479804641522750.0095960928304550.995201953584772
240.003009646314626260.006019292629252530.996990353685374
250.001830608240340110.003661216480680220.99816939175966
260.001079764483333560.002159528966667120.998920235516666
270.0006175948170188990.001235189634037800.999382405182981
280.0003425111221828560.0006850222443657110.999657488877817
290.0001841488312096540.0003682976624193080.99981585116879
309.5959128681414e-050.0001919182573628280.999904040871319
314.84506775764357e-059.69013551528715e-050.999951549322424
322.36949485686936e-054.73898971373871e-050.999976305051431
331.12194587744095e-052.24389175488189e-050.999988780541226
345.1408627644245e-061.0281725528849e-050.999994859137236
352.27825957576678e-064.55651915153356e-060.999997721740424
369.7587189845546e-071.95174379691092e-060.999999024128102
374.03723865347599e-078.07447730695198e-070.999999596276135
381.61180713140398e-073.22361426280796e-070.999999838819287
392.99560393662437e-075.99120787324874e-070.999999700439606
408.65694807990036e-071.73138961598007e-060.999999134305192
414.68665884150882e-069.37331768301763e-060.999995313341159
426.43696881182715e-050.0001287393762365430.999935630311882
430.00365540144611750.0073108028922350.996344598553883
440.02755788904680080.05511577809360150.9724421109532
450.09973714778150.1994742955630.9002628522185
460.2551066073148990.5102132146297980.744893392685101
470.4093678985073560.8187357970147110.590632101492644
480.5739477922207310.8521044155585370.426052207779269
490.7578209241047620.4843581517904770.242179075895238
500.9373105268395110.1253789463209780.062689473160489
510.9397290567208120.1205418865583760.0602709432791881
520.9344973547102520.1310052905794970.0655026452897484
530.924854084431890.1502918311362210.0751459155681106
540.9145739905888230.1708520188223540.0854260094111768
550.913317063977640.173365872044720.08668293602236
560.9523545131637290.09529097367254170.0476454868362709

\begin{tabular}{lllllllll}
\hline
Goldfeld-Quandt test for Heteroskedasticity \tabularnewline
p-values & Alternative Hypothesis \tabularnewline
breakpoint index & greater & 2-sided & less \tabularnewline
5 & 3.12109876090732e-43 & 6.24219752181464e-43 & 1 \tabularnewline
6 & 2.05025748893310e-55 & 4.10051497786621e-55 & 1 \tabularnewline
7 & 6.92331633376045e-70 & 1.38466326675209e-69 & 1 \tabularnewline
8 & 0.000174559257899714 & 0.000349118515799429 & 0.9998254407421 \tabularnewline
9 & 0.00427794198061811 & 0.00855588396123621 & 0.995722058019382 \tabularnewline
10 & 0.0332914057915252 & 0.0665828115830504 & 0.966708594208475 \tabularnewline
11 & 0.0596892364119641 & 0.119378472823928 & 0.940310763588036 \tabularnewline
12 & 0.073030955571055 & 0.14606191114211 & 0.926969044428945 \tabularnewline
13 & 0.0752963729400936 & 0.150592745880187 & 0.924703627059906 \tabularnewline
14 & 0.0703136694272502 & 0.140627338854500 & 0.92968633057275 \tabularnewline
15 & 0.0613631210581403 & 0.122726242116281 & 0.93863687894186 \tabularnewline
16 & 0.050833731814473 & 0.101667463628946 & 0.949166268185527 \tabularnewline
17 & 0.0403150169344626 & 0.0806300338689252 & 0.959684983065537 \tabularnewline
18 & 0.0307607980664207 & 0.0615215961328415 & 0.96923920193358 \tabularnewline
19 & 0.0226490150383166 & 0.0452980300766332 & 0.977350984961683 \tabularnewline
20 & 0.0161228663910369 & 0.0322457327820737 & 0.983877133608963 \tabularnewline
21 & 0.0111097109399001 & 0.0222194218798002 & 0.9888902890601 \tabularnewline
22 & 0.00741602281103061 & 0.0148320456220612 & 0.99258397718897 \tabularnewline
23 & 0.0047980464152275 & 0.009596092830455 & 0.995201953584772 \tabularnewline
24 & 0.00300964631462626 & 0.00601929262925253 & 0.996990353685374 \tabularnewline
25 & 0.00183060824034011 & 0.00366121648068022 & 0.99816939175966 \tabularnewline
26 & 0.00107976448333356 & 0.00215952896666712 & 0.998920235516666 \tabularnewline
27 & 0.000617594817018899 & 0.00123518963403780 & 0.999382405182981 \tabularnewline
28 & 0.000342511122182856 & 0.000685022244365711 & 0.999657488877817 \tabularnewline
29 & 0.000184148831209654 & 0.000368297662419308 & 0.99981585116879 \tabularnewline
30 & 9.5959128681414e-05 & 0.000191918257362828 & 0.999904040871319 \tabularnewline
31 & 4.84506775764357e-05 & 9.69013551528715e-05 & 0.999951549322424 \tabularnewline
32 & 2.36949485686936e-05 & 4.73898971373871e-05 & 0.999976305051431 \tabularnewline
33 & 1.12194587744095e-05 & 2.24389175488189e-05 & 0.999988780541226 \tabularnewline
34 & 5.1408627644245e-06 & 1.0281725528849e-05 & 0.999994859137236 \tabularnewline
35 & 2.27825957576678e-06 & 4.55651915153356e-06 & 0.999997721740424 \tabularnewline
36 & 9.7587189845546e-07 & 1.95174379691092e-06 & 0.999999024128102 \tabularnewline
37 & 4.03723865347599e-07 & 8.07447730695198e-07 & 0.999999596276135 \tabularnewline
38 & 1.61180713140398e-07 & 3.22361426280796e-07 & 0.999999838819287 \tabularnewline
39 & 2.99560393662437e-07 & 5.99120787324874e-07 & 0.999999700439606 \tabularnewline
40 & 8.65694807990036e-07 & 1.73138961598007e-06 & 0.999999134305192 \tabularnewline
41 & 4.68665884150882e-06 & 9.37331768301763e-06 & 0.999995313341159 \tabularnewline
42 & 6.43696881182715e-05 & 0.000128739376236543 & 0.999935630311882 \tabularnewline
43 & 0.0036554014461175 & 0.007310802892235 & 0.996344598553883 \tabularnewline
44 & 0.0275578890468008 & 0.0551157780936015 & 0.9724421109532 \tabularnewline
45 & 0.0997371477815 & 0.199474295563 & 0.9002628522185 \tabularnewline
46 & 0.255106607314899 & 0.510213214629798 & 0.744893392685101 \tabularnewline
47 & 0.409367898507356 & 0.818735797014711 & 0.590632101492644 \tabularnewline
48 & 0.573947792220731 & 0.852104415558537 & 0.426052207779269 \tabularnewline
49 & 0.757820924104762 & 0.484358151790477 & 0.242179075895238 \tabularnewline
50 & 0.937310526839511 & 0.125378946320978 & 0.062689473160489 \tabularnewline
51 & 0.939729056720812 & 0.120541886558376 & 0.0602709432791881 \tabularnewline
52 & 0.934497354710252 & 0.131005290579497 & 0.0655026452897484 \tabularnewline
53 & 0.92485408443189 & 0.150291831136221 & 0.0751459155681106 \tabularnewline
54 & 0.914573990588823 & 0.170852018822354 & 0.0854260094111768 \tabularnewline
55 & 0.91331706397764 & 0.17336587204472 & 0.08668293602236 \tabularnewline
56 & 0.952354513163729 & 0.0952909736725417 & 0.0476454868362709 \tabularnewline
\hline
\end{tabular}
%Source: https://freestatistics.org/blog/index.php?pk=35396&T=5

[TABLE]
[ROW][C]Goldfeld-Quandt test for Heteroskedasticity[/C][/ROW]
[ROW][C]p-values[/C][C]Alternative Hypothesis[/C][/ROW]
[ROW][C]breakpoint index[/C][C]greater[/C][C]2-sided[/C][C]less[/C][/ROW]
[ROW][C]5[/C][C]3.12109876090732e-43[/C][C]6.24219752181464e-43[/C][C]1[/C][/ROW]
[ROW][C]6[/C][C]2.05025748893310e-55[/C][C]4.10051497786621e-55[/C][C]1[/C][/ROW]
[ROW][C]7[/C][C]6.92331633376045e-70[/C][C]1.38466326675209e-69[/C][C]1[/C][/ROW]
[ROW][C]8[/C][C]0.000174559257899714[/C][C]0.000349118515799429[/C][C]0.9998254407421[/C][/ROW]
[ROW][C]9[/C][C]0.00427794198061811[/C][C]0.00855588396123621[/C][C]0.995722058019382[/C][/ROW]
[ROW][C]10[/C][C]0.0332914057915252[/C][C]0.0665828115830504[/C][C]0.966708594208475[/C][/ROW]
[ROW][C]11[/C][C]0.0596892364119641[/C][C]0.119378472823928[/C][C]0.940310763588036[/C][/ROW]
[ROW][C]12[/C][C]0.073030955571055[/C][C]0.14606191114211[/C][C]0.926969044428945[/C][/ROW]
[ROW][C]13[/C][C]0.0752963729400936[/C][C]0.150592745880187[/C][C]0.924703627059906[/C][/ROW]
[ROW][C]14[/C][C]0.0703136694272502[/C][C]0.140627338854500[/C][C]0.92968633057275[/C][/ROW]
[ROW][C]15[/C][C]0.0613631210581403[/C][C]0.122726242116281[/C][C]0.93863687894186[/C][/ROW]
[ROW][C]16[/C][C]0.050833731814473[/C][C]0.101667463628946[/C][C]0.949166268185527[/C][/ROW]
[ROW][C]17[/C][C]0.0403150169344626[/C][C]0.0806300338689252[/C][C]0.959684983065537[/C][/ROW]
[ROW][C]18[/C][C]0.0307607980664207[/C][C]0.0615215961328415[/C][C]0.96923920193358[/C][/ROW]
[ROW][C]19[/C][C]0.0226490150383166[/C][C]0.0452980300766332[/C][C]0.977350984961683[/C][/ROW]
[ROW][C]20[/C][C]0.0161228663910369[/C][C]0.0322457327820737[/C][C]0.983877133608963[/C][/ROW]
[ROW][C]21[/C][C]0.0111097109399001[/C][C]0.0222194218798002[/C][C]0.9888902890601[/C][/ROW]
[ROW][C]22[/C][C]0.00741602281103061[/C][C]0.0148320456220612[/C][C]0.99258397718897[/C][/ROW]
[ROW][C]23[/C][C]0.0047980464152275[/C][C]0.009596092830455[/C][C]0.995201953584772[/C][/ROW]
[ROW][C]24[/C][C]0.00300964631462626[/C][C]0.00601929262925253[/C][C]0.996990353685374[/C][/ROW]
[ROW][C]25[/C][C]0.00183060824034011[/C][C]0.00366121648068022[/C][C]0.99816939175966[/C][/ROW]
[ROW][C]26[/C][C]0.00107976448333356[/C][C]0.00215952896666712[/C][C]0.998920235516666[/C][/ROW]
[ROW][C]27[/C][C]0.000617594817018899[/C][C]0.00123518963403780[/C][C]0.999382405182981[/C][/ROW]
[ROW][C]28[/C][C]0.000342511122182856[/C][C]0.000685022244365711[/C][C]0.999657488877817[/C][/ROW]
[ROW][C]29[/C][C]0.000184148831209654[/C][C]0.000368297662419308[/C][C]0.99981585116879[/C][/ROW]
[ROW][C]30[/C][C]9.5959128681414e-05[/C][C]0.000191918257362828[/C][C]0.999904040871319[/C][/ROW]
[ROW][C]31[/C][C]4.84506775764357e-05[/C][C]9.69013551528715e-05[/C][C]0.999951549322424[/C][/ROW]
[ROW][C]32[/C][C]2.36949485686936e-05[/C][C]4.73898971373871e-05[/C][C]0.999976305051431[/C][/ROW]
[ROW][C]33[/C][C]1.12194587744095e-05[/C][C]2.24389175488189e-05[/C][C]0.999988780541226[/C][/ROW]
[ROW][C]34[/C][C]5.1408627644245e-06[/C][C]1.0281725528849e-05[/C][C]0.999994859137236[/C][/ROW]
[ROW][C]35[/C][C]2.27825957576678e-06[/C][C]4.55651915153356e-06[/C][C]0.999997721740424[/C][/ROW]
[ROW][C]36[/C][C]9.7587189845546e-07[/C][C]1.95174379691092e-06[/C][C]0.999999024128102[/C][/ROW]
[ROW][C]37[/C][C]4.03723865347599e-07[/C][C]8.07447730695198e-07[/C][C]0.999999596276135[/C][/ROW]
[ROW][C]38[/C][C]1.61180713140398e-07[/C][C]3.22361426280796e-07[/C][C]0.999999838819287[/C][/ROW]
[ROW][C]39[/C][C]2.99560393662437e-07[/C][C]5.99120787324874e-07[/C][C]0.999999700439606[/C][/ROW]
[ROW][C]40[/C][C]8.65694807990036e-07[/C][C]1.73138961598007e-06[/C][C]0.999999134305192[/C][/ROW]
[ROW][C]41[/C][C]4.68665884150882e-06[/C][C]9.37331768301763e-06[/C][C]0.999995313341159[/C][/ROW]
[ROW][C]42[/C][C]6.43696881182715e-05[/C][C]0.000128739376236543[/C][C]0.999935630311882[/C][/ROW]
[ROW][C]43[/C][C]0.0036554014461175[/C][C]0.007310802892235[/C][C]0.996344598553883[/C][/ROW]
[ROW][C]44[/C][C]0.0275578890468008[/C][C]0.0551157780936015[/C][C]0.9724421109532[/C][/ROW]
[ROW][C]45[/C][C]0.0997371477815[/C][C]0.199474295563[/C][C]0.9002628522185[/C][/ROW]
[ROW][C]46[/C][C]0.255106607314899[/C][C]0.510213214629798[/C][C]0.744893392685101[/C][/ROW]
[ROW][C]47[/C][C]0.409367898507356[/C][C]0.818735797014711[/C][C]0.590632101492644[/C][/ROW]
[ROW][C]48[/C][C]0.573947792220731[/C][C]0.852104415558537[/C][C]0.426052207779269[/C][/ROW]
[ROW][C]49[/C][C]0.757820924104762[/C][C]0.484358151790477[/C][C]0.242179075895238[/C][/ROW]
[ROW][C]50[/C][C]0.937310526839511[/C][C]0.125378946320978[/C][C]0.062689473160489[/C][/ROW]
[ROW][C]51[/C][C]0.939729056720812[/C][C]0.120541886558376[/C][C]0.0602709432791881[/C][/ROW]
[ROW][C]52[/C][C]0.934497354710252[/C][C]0.131005290579497[/C][C]0.0655026452897484[/C][/ROW]
[ROW][C]53[/C][C]0.92485408443189[/C][C]0.150291831136221[/C][C]0.0751459155681106[/C][/ROW]
[ROW][C]54[/C][C]0.914573990588823[/C][C]0.170852018822354[/C][C]0.0854260094111768[/C][/ROW]
[ROW][C]55[/C][C]0.91331706397764[/C][C]0.17336587204472[/C][C]0.08668293602236[/C][/ROW]
[ROW][C]56[/C][C]0.952354513163729[/C][C]0.0952909736725417[/C][C]0.0476454868362709[/C][/ROW]
[/TABLE]
Source: https://freestatistics.org/blog/index.php?pk=35396&T=5

Globally Unique Identifier (entire table): ba.freestatistics.org/blog/index.php?pk=35396&T=5

As an alternative you can also use a QR Code:  

The GUIDs for individual cells are displayed in the table below:

Goldfeld-Quandt test for Heteroskedasticity
p-valuesAlternative Hypothesis
breakpoint indexgreater2-sidedless
53.12109876090732e-436.24219752181464e-431
62.05025748893310e-554.10051497786621e-551
76.92331633376045e-701.38466326675209e-691
80.0001745592578997140.0003491185157994290.9998254407421
90.004277941980618110.008555883961236210.995722058019382
100.03329140579152520.06658281158305040.966708594208475
110.05968923641196410.1193784728239280.940310763588036
120.0730309555710550.146061911142110.926969044428945
130.07529637294009360.1505927458801870.924703627059906
140.07031366942725020.1406273388545000.92968633057275
150.06136312105814030.1227262421162810.93863687894186
160.0508337318144730.1016674636289460.949166268185527
170.04031501693446260.08063003386892520.959684983065537
180.03076079806642070.06152159613284150.96923920193358
190.02264901503831660.04529803007663320.977350984961683
200.01612286639103690.03224573278207370.983877133608963
210.01110971093990010.02221942187980020.9888902890601
220.007416022811030610.01483204562206120.99258397718897
230.00479804641522750.0095960928304550.995201953584772
240.003009646314626260.006019292629252530.996990353685374
250.001830608240340110.003661216480680220.99816939175966
260.001079764483333560.002159528966667120.998920235516666
270.0006175948170188990.001235189634037800.999382405182981
280.0003425111221828560.0006850222443657110.999657488877817
290.0001841488312096540.0003682976624193080.99981585116879
309.5959128681414e-050.0001919182573628280.999904040871319
314.84506775764357e-059.69013551528715e-050.999951549322424
322.36949485686936e-054.73898971373871e-050.999976305051431
331.12194587744095e-052.24389175488189e-050.999988780541226
345.1408627644245e-061.0281725528849e-050.999994859137236
352.27825957576678e-064.55651915153356e-060.999997721740424
369.7587189845546e-071.95174379691092e-060.999999024128102
374.03723865347599e-078.07447730695198e-070.999999596276135
381.61180713140398e-073.22361426280796e-070.999999838819287
392.99560393662437e-075.99120787324874e-070.999999700439606
408.65694807990036e-071.73138961598007e-060.999999134305192
414.68665884150882e-069.37331768301763e-060.999995313341159
426.43696881182715e-050.0001287393762365430.999935630311882
430.00365540144611750.0073108028922350.996344598553883
440.02755788904680080.05511577809360150.9724421109532
450.09973714778150.1994742955630.9002628522185
460.2551066073148990.5102132146297980.744893392685101
470.4093678985073560.8187357970147110.590632101492644
480.5739477922207310.8521044155585370.426052207779269
490.7578209241047620.4843581517904770.242179075895238
500.9373105268395110.1253789463209780.062689473160489
510.9397290567208120.1205418865583760.0602709432791881
520.9344973547102520.1310052905794970.0655026452897484
530.924854084431890.1502918311362210.0751459155681106
540.9145739905888230.1708520188223540.0854260094111768
550.913317063977640.173365872044720.08668293602236
560.9523545131637290.09529097367254170.0476454868362709


Meta Analysis of Goldfeld-Quandt test for Heteroskedasticity
Description# significant tests% significant testsOK/NOK
1% type I error level260.5NOK
5% type I error level300.576923076923077NOK
10% type I error level350.673076923076923NOK

\begin{tabular}{lllllllll}
\hline
Meta Analysis of Goldfeld-Quandt test for Heteroskedasticity \tabularnewline
Description & # significant tests & % significant tests & OK/NOK \tabularnewline
1% type I error level & 26 & 0.5 & NOK \tabularnewline
5% type I error level & 30 & 0.576923076923077 & NOK \tabularnewline
10% type I error level & 35 & 0.673076923076923 & NOK \tabularnewline
\hline
\end{tabular}
%Source: https://freestatistics.org/blog/index.php?pk=35396&T=6

[TABLE]
[ROW][C]Meta Analysis of Goldfeld-Quandt test for Heteroskedasticity[/C][/ROW]
[ROW][C]Description[/C][C]# significant tests[/C][C]% significant tests[/C][C]OK/NOK[/C][/ROW]
[ROW][C]1% type I error level[/C][C]26[/C][C]0.5[/C][C]NOK[/C][/ROW]
[ROW][C]5% type I error level[/C][C]30[/C][C]0.576923076923077[/C][C]NOK[/C][/ROW]
[ROW][C]10% type I error level[/C][C]35[/C][C]0.673076923076923[/C][C]NOK[/C][/ROW]
[/TABLE]
Source: https://freestatistics.org/blog/index.php?pk=35396&T=6

Globally Unique Identifier (entire table): ba.freestatistics.org/blog/index.php?pk=35396&T=6

As an alternative you can also use a QR Code:  

The GUIDs for individual cells are displayed in the table below:

Meta Analysis of Goldfeld-Quandt test for Heteroskedasticity
Description# significant tests% significant testsOK/NOK
1% type I error level260.5NOK
5% type I error level300.576923076923077NOK
10% type I error level350.673076923076923NOK


Parameters (Session):
par1 = 1 ; par2 = Do not include Seasonal Dummies ; par3 = No Linear Trend ;
Parameters (R input):
par1 = 1 ; par2 = Do not include Seasonal Dummies ; par3 = No Linear Trend ;
R code (references can be found in the software module):
library(lattice)
library(lmtest)
n25 <- 25 #minimum number of obs. for Goldfeld-Quandt test
par1 <- as.numeric(par1)
x <- t(y)
k <- length(x[1,])
n <- length(x[,1])
x1 <- cbind(x[,par1], x[,1:k!=par1])
mycolnames <- c(colnames(x)[par1], colnames(x)[1:k!=par1])
colnames(x1) <- mycolnames #colnames(x)[par1]
x <- x1
if (par3 == 'First Differences'){
x2 <- array(0, dim=c(n-1,k), dimnames=list(1:(n-1), paste('(1-B)',colnames(x),sep='')))
for (i in 1:n-1) {
for (j in 1:k) {
x2[i,j] <- x[i+1,j] - x[i,j]
}
}
x <- x2
}
if (par2 == 'Include Monthly Dummies'){
x2 <- array(0, dim=c(n,11), dimnames=list(1:n, paste('M', seq(1:11), sep ='')))
for (i in 1:11){
x2[seq(i,n,12),i] <- 1
}
x <- cbind(x, x2)
}
if (par2 == 'Include Quarterly Dummies'){
x2 <- array(0, dim=c(n,3), dimnames=list(1:n, paste('Q', seq(1:3), sep ='')))
for (i in 1:3){
x2[seq(i,n,4),i] <- 1
}
x <- cbind(x, x2)
}
k <- length(x[1,])
if (par3 == 'Linear Trend'){
x <- cbind(x, c(1:n))
colnames(x)[k+1] <- 't'
}
x
k <- length(x[1,])
df <- as.data.frame(x)
(mylm <- lm(df))
(mysum <- summary(mylm))
if (n > n25) {
kp3 <- k + 3
nmkm3 <- n - k - 3
gqarr <- array(NA, dim=c(nmkm3-kp3+1,3))
numgqtests <- 0
numsignificant1 <- 0
numsignificant5 <- 0
numsignificant10 <- 0
for (mypoint in kp3:nmkm3) {
j <- 0
numgqtests <- numgqtests + 1
for (myalt in c('greater', 'two.sided', 'less')) {
j <- j + 1
gqarr[mypoint-kp3+1,j] <- gqtest(mylm, point=mypoint, alternative=myalt)$p.value
}
if (gqarr[mypoint-kp3+1,2] < 0.01) numsignificant1 <- numsignificant1 + 1
if (gqarr[mypoint-kp3+1,2] < 0.05) numsignificant5 <- numsignificant5 + 1
if (gqarr[mypoint-kp3+1,2] < 0.10) numsignificant10 <- numsignificant10 + 1
}
gqarr
}
bitmap(file='test0.png')
plot(x[,1], type='l', main='Actuals and Interpolation', ylab='value of Actuals and Interpolation (dots)', xlab='time or index')
points(x[,1]-mysum$resid)
grid()
dev.off()
bitmap(file='test1.png')
plot(mysum$resid, type='b', pch=19, main='Residuals', ylab='value of Residuals', xlab='time or index')
grid()
dev.off()
bitmap(file='test2.png')
hist(mysum$resid, main='Residual Histogram', xlab='values of Residuals')
grid()
dev.off()
bitmap(file='test3.png')
densityplot(~mysum$resid,col='black',main='Residual Density Plot', xlab='values of Residuals')
dev.off()
bitmap(file='test4.png')
qqnorm(mysum$resid, main='Residual Normal Q-Q Plot')
qqline(mysum$resid)
grid()
dev.off()
(myerror <- as.ts(mysum$resid))
bitmap(file='test5.png')
dum <- cbind(lag(myerror,k=1),myerror)
dum
dum1 <- dum[2:length(myerror),]
dum1
z <- as.data.frame(dum1)
z
plot(z,main=paste('Residual Lag plot, lowess, and regression line'), ylab='values of Residuals', xlab='lagged values of Residuals')
lines(lowess(z))
abline(lm(z))
grid()
dev.off()
bitmap(file='test6.png')
acf(mysum$resid, lag.max=length(mysum$resid)/2, main='Residual Autocorrelation Function')
grid()
dev.off()
bitmap(file='test7.png')
pacf(mysum$resid, lag.max=length(mysum$resid)/2, main='Residual Partial Autocorrelation Function')
grid()
dev.off()
bitmap(file='test8.png')
opar <- par(mfrow = c(2,2), oma = c(0, 0, 1.1, 0))
plot(mylm, las = 1, sub='Residual Diagnostics')
par(opar)
dev.off()
if (n > n25) {
bitmap(file='test9.png')
plot(kp3:nmkm3,gqarr[,2], main='Goldfeld-Quandt test',ylab='2-sided p-value',xlab='breakpoint')
grid()
dev.off()
}
load(file='createtable')
a<-table.start()
a<-table.row.start(a)
a<-table.element(a, 'Multiple Linear Regression - Estimated Regression Equation', 1, TRUE)
a<-table.row.end(a)
myeq <- colnames(x)[1]
myeq <- paste(myeq, '[t] = ', sep='')
for (i in 1:k){
if (mysum$coefficients[i,1] > 0) myeq <- paste(myeq, '+', '')
myeq <- paste(myeq, mysum$coefficients[i,1], sep=' ')
if (rownames(mysum$coefficients)[i] != '(Intercept)') {
myeq <- paste(myeq, rownames(mysum$coefficients)[i], sep='')
if (rownames(mysum$coefficients)[i] != 't') myeq <- paste(myeq, '[t]', sep='')
}
}
myeq <- paste(myeq, ' + e[t]')
a<-table.row.start(a)
a<-table.element(a, myeq)
a<-table.row.end(a)
a<-table.end(a)
table.save(a,file='mytable1.tab')
a<-table.start()
a<-table.row.start(a)
a<-table.element(a,hyperlink('ols1.htm','Multiple Linear Regression - Ordinary Least Squares',''), 6, TRUE)
a<-table.row.end(a)
a<-table.row.start(a)
a<-table.element(a,'Variable',header=TRUE)
a<-table.element(a,'Parameter',header=TRUE)
a<-table.element(a,'S.D.',header=TRUE)
a<-table.element(a,'T-STAT
H0: parameter = 0',header=TRUE)
a<-table.element(a,'2-tail p-value',header=TRUE)
a<-table.element(a,'1-tail p-value',header=TRUE)
a<-table.row.end(a)
for (i in 1:k){
a<-table.row.start(a)
a<-table.element(a,rownames(mysum$coefficients)[i],header=TRUE)
a<-table.element(a,mysum$coefficients[i,1])
a<-table.element(a, round(mysum$coefficients[i,2],6))
a<-table.element(a, round(mysum$coefficients[i,3],4))
a<-table.element(a, round(mysum$coefficients[i,4],6))
a<-table.element(a, round(mysum$coefficients[i,4]/2,6))
a<-table.row.end(a)
}
a<-table.end(a)
table.save(a,file='mytable2.tab')
a<-table.start()
a<-table.row.start(a)
a<-table.element(a, 'Multiple Linear Regression - Regression Statistics', 2, TRUE)
a<-table.row.end(a)
a<-table.row.start(a)
a<-table.element(a, 'Multiple R',1,TRUE)
a<-table.element(a, sqrt(mysum$r.squared))
a<-table.row.end(a)
a<-table.row.start(a)
a<-table.element(a, 'R-squared',1,TRUE)
a<-table.element(a, mysum$r.squared)
a<-table.row.end(a)
a<-table.row.start(a)
a<-table.element(a, 'Adjusted R-squared',1,TRUE)
a<-table.element(a, mysum$adj.r.squared)
a<-table.row.end(a)
a<-table.row.start(a)
a<-table.element(a, 'F-TEST (value)',1,TRUE)
a<-table.element(a, mysum$fstatistic[1])
a<-table.row.end(a)
a<-table.row.start(a)
a<-table.element(a, 'F-TEST (DF numerator)',1,TRUE)
a<-table.element(a, mysum$fstatistic[2])
a<-table.row.end(a)
a<-table.row.start(a)
a<-table.element(a, 'F-TEST (DF denominator)',1,TRUE)
a<-table.element(a, mysum$fstatistic[3])
a<-table.row.end(a)
a<-table.row.start(a)
a<-table.element(a, 'p-value',1,TRUE)
a<-table.element(a, 1-pf(mysum$fstatistic[1],mysum$fstatistic[2],mysum$fstatistic[3]))
a<-table.row.end(a)
a<-table.row.start(a)
a<-table.element(a, 'Multiple Linear Regression - Residual Statistics', 2, TRUE)
a<-table.row.end(a)
a<-table.row.start(a)
a<-table.element(a, 'Residual Standard Deviation',1,TRUE)
a<-table.element(a, mysum$sigma)
a<-table.row.end(a)
a<-table.row.start(a)
a<-table.element(a, 'Sum Squared Residuals',1,TRUE)
a<-table.element(a, sum(myerror*myerror))
a<-table.row.end(a)
a<-table.end(a)
table.save(a,file='mytable3.tab')
a<-table.start()
a<-table.row.start(a)
a<-table.element(a, 'Multiple Linear Regression - Actuals, Interpolation, and Residuals', 4, TRUE)
a<-table.row.end(a)
a<-table.row.start(a)
a<-table.element(a, 'Time or Index', 1, TRUE)
a<-table.element(a, 'Actuals', 1, TRUE)
a<-table.element(a, 'Interpolation
Forecast', 1, TRUE)
a<-table.element(a, 'Residuals
Prediction Error', 1, TRUE)
a<-table.row.end(a)
for (i in 1:n) {
a<-table.row.start(a)
a<-table.element(a,i, 1, TRUE)
a<-table.element(a,x[i])
a<-table.element(a,x[i]-mysum$resid[i])
a<-table.element(a,mysum$resid[i])
a<-table.row.end(a)
}
a<-table.end(a)
table.save(a,file='mytable4.tab')
if (n > n25) {
a<-table.start()
a<-table.row.start(a)
a<-table.element(a,'Goldfeld-Quandt test for Heteroskedasticity',4,TRUE)
a<-table.row.end(a)
a<-table.row.start(a)
a<-table.element(a,'p-values',header=TRUE)
a<-table.element(a,'Alternative Hypothesis',3,header=TRUE)
a<-table.row.end(a)
a<-table.row.start(a)
a<-table.element(a,'breakpoint index',header=TRUE)
a<-table.element(a,'greater',header=TRUE)
a<-table.element(a,'2-sided',header=TRUE)
a<-table.element(a,'less',header=TRUE)
a<-table.row.end(a)
for (mypoint in kp3:nmkm3) {
a<-table.row.start(a)
a<-table.element(a,mypoint,header=TRUE)
a<-table.element(a,gqarr[mypoint-kp3+1,1])
a<-table.element(a,gqarr[mypoint-kp3+1,2])
a<-table.element(a,gqarr[mypoint-kp3+1,3])
a<-table.row.end(a)
}
a<-table.end(a)
table.save(a,file='mytable5.tab')
a<-table.start()
a<-table.row.start(a)
a<-table.element(a,'Meta Analysis of Goldfeld-Quandt test for Heteroskedasticity',4,TRUE)
a<-table.row.end(a)
a<-table.row.start(a)
a<-table.element(a,'Description',header=TRUE)
a<-table.element(a,'# significant tests',header=TRUE)
a<-table.element(a,'% significant tests',header=TRUE)
a<-table.element(a,'OK/NOK',header=TRUE)
a<-table.row.end(a)
a<-table.row.start(a)
a<-table.element(a,'1% type I error level',header=TRUE)
a<-table.element(a,numsignificant1)
a<-table.element(a,numsignificant1/numgqtests)
if (numsignificant1/numgqtests < 0.01) dum <- 'OK' else dum <- 'NOK'
a<-table.element(a,dum)
a<-table.row.end(a)
a<-table.row.start(a)
a<-table.element(a,'5% type I error level',header=TRUE)
a<-table.element(a,numsignificant5)
a<-table.element(a,numsignificant5/numgqtests)
if (numsignificant5/numgqtests < 0.05) dum <- 'OK' else dum <- 'NOK'
a<-table.element(a,dum)
a<-table.row.end(a)
a<-table.row.start(a)
a<-table.element(a,'10% type I error level',header=TRUE)
a<-table.element(a,numsignificant10)
a<-table.element(a,numsignificant10/numgqtests)
if (numsignificant10/numgqtests < 0.1) dum <- 'OK' else dum <- 'NOK'
a<-table.element(a,dum)
a<-table.row.end(a)
a<-table.end(a)
table.save(a,file='mytable6.tab')
}