Free Statistics

of Irreproducible Research!

Author's title

Author*The author of this computation has been verified*
R Software Modulerwasp_autocorrelation.wasp
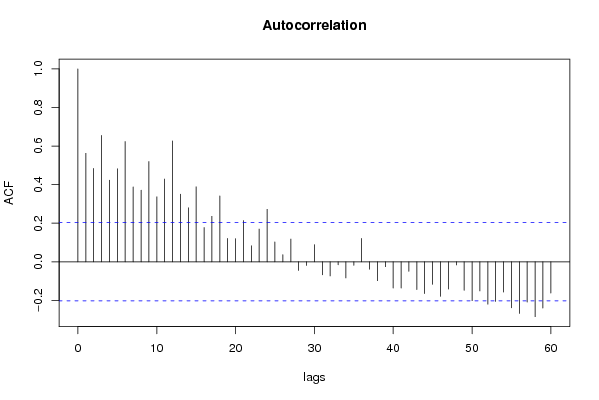
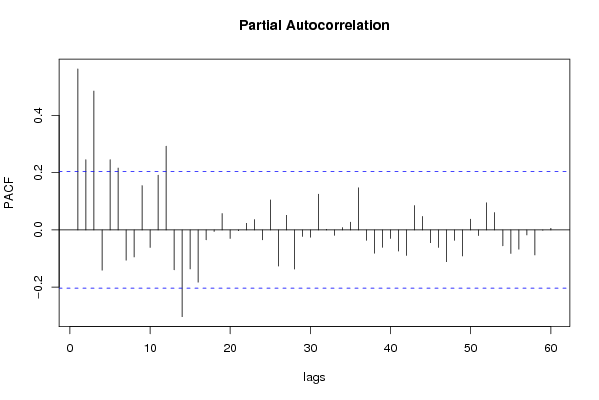
Title produced by software(Partial) Autocorrelation Function
Date of computationSat, 20 Dec 2008 07:04:23 -0700
Cite this page as followsStatistical Computations at FreeStatistics.org, Office for Research Development and Education, URL https://freestatistics.org/blog/index.php?v=date/2008/Dec/20/t1229781948i47crad30wgp0vr.htm/, Retrieved Wed, 15 May 2024 18:55:09 +0000
Statistical Computations at FreeStatistics.org, Office for Research Development and Education, URL https://freestatistics.org/blog/index.php?pk=35374, Retrieved Wed, 15 May 2024 18:55:09 +0000
QR Codes:

Original text written by user:
IsPrivate?No (this computation is public)
User-defined keywords
Estimated Impact213
Family? (F = Feedback message, R = changed R code, M = changed R Module, P = changed Parameters, D = changed Data)
-     [Standard Deviation-Mean Plot] [tinneke_debock.pa...] [2008-12-18 18:24:23] [f9c5a49917ff87aeb076072f2749ef70]
- RMPD  [(Partial) Autocorrelation Function] [tinneke_debock.pa...] [2008-12-18 19:00:06] [f9c5a49917ff87aeb076072f2749ef70]
-   PD    [(Partial) Autocorrelation Function] [Paper statistiek_...] [2008-12-19 09:30:17] [fdc296cbeb5d8064cb0dbd634c3fdc55]
-    D      [(Partial) Autocorrelation Function] [Paper statistiek_...] [2008-12-19 09:33:45] [fdc296cbeb5d8064cb0dbd634c3fdc55]
-   PD          [(Partial) Autocorrelation Function] [Paper statistiek_...] [2008-12-20 14:04:23] [e221948dd14811c7d88a6530ac2a8702] [Current]
Feedback Forum

Post a new message
Dataseries X:
98.6
98
106.8
96.7
100.2
107.7
92
98.4
107.4
117.7
105.7
97.5
99.9
98.2
104.5
100.8
101.5
103.9
99.6
98.4
112.7
118.4
108.1
105.4
114.6
106.9
115.9
109.8
101.8
114.2
110.8
108.4
127.5
128.6
116.6
127.4
105
108.3
125
111.6
106.5
130.3
115
116.1
134
126.5
125.8
136.4
114.9
110.9
125.5
116.8
116.8
125.5
104.2
115.1
132.8
123.3
124.8
122
117.4
117.9
137.4
114.6
124.7
129.6
109.4
120.9
134.9
136.3
133.2
127.2
122.7
120.5
137.8
119.1
124.3
134.4
121.1
122.2
127.7
137.4
132.2
129.2
124.9
124.8
128.2
134.4
118.6
132.6
123.2
112.8
138.3


Summary of computational transaction
Raw Inputview raw input (R code)
Raw Outputview raw output of R engine
Computing time1 seconds
R Server'George Udny Yule' @ 72.249.76.132

\begin{tabular}{lllllllll}
\hline
Summary of computational transaction \tabularnewline
Raw Input & view raw input (R code)  \tabularnewline
Raw Output & view raw output of R engine  \tabularnewline
Computing time & 1 seconds \tabularnewline
R Server & 'George Udny Yule' @ 72.249.76.132 \tabularnewline
\hline
\end{tabular}
%Source: https://freestatistics.org/blog/index.php?pk=35374&T=0

[TABLE]
[ROW][C]Summary of computational transaction[/C][/ROW]
[ROW][C]Raw Input[/C][C]view raw input (R code) [/C][/ROW]
[ROW][C]Raw Output[/C][C]view raw output of R engine [/C][/ROW]
[ROW][C]Computing time[/C][C]1 seconds[/C][/ROW]
[ROW][C]R Server[/C][C]'George Udny Yule' @ 72.249.76.132[/C][/ROW]
[/TABLE]
Source: https://freestatistics.org/blog/index.php?pk=35374&T=0

Globally Unique Identifier (entire table): ba.freestatistics.org/blog/index.php?pk=35374&T=0

As an alternative you can also use a QR Code:  

The GUIDs for individual cells are displayed in the table below:

Summary of computational transaction
Raw Inputview raw input (R code)
Raw Outputview raw output of R engine
Computing time1 seconds
R Server'George Udny Yule' @ 72.249.76.132


Autocorrelation Function
Time lag kACF(k)T-STATP-value
10.5624595.42420
20.4840554.66815e-06
30.6552936.31940
40.4229894.07924.8e-05
50.4821034.64925e-06
60.6231686.00960
70.3878333.74010.000159
80.3711173.57890.000275
90.5198695.01341e-06
100.337033.25020.000803
110.4289614.13673.9e-05
120.6265886.04260
130.3505923.3810.000529
140.2797452.69780.004145
150.3884593.74620.000156
160.1773821.71060.045243
170.235642.27240.012682
180.34123.29040.000707
190.120711.16410.123684
200.1196911.15430.125676
210.2138942.06270.020964
220.0828460.79890.213181
230.1698331.63780.05242
240.2718212.62130.005116
250.1028710.99210.161873
260.0364860.35190.362871
270.1180711.13860.128891
28-0.044813-0.43220.333311
29-0.01897-0.18290.427623
300.0888420.85680.196889
31-0.067972-0.65550.256881
32-0.073847-0.71220.239077
33-0.015876-0.15310.439324
34-0.083912-0.80920.210226
35-0.018242-0.17590.43037
360.121031.16720.123063
37-0.038595-0.37220.355296
38-0.098483-0.94970.172354
39-0.025734-0.24820.402274
40-0.136464-1.3160.095703
41-0.136285-1.31430.095992
42-0.049811-0.48040.31605
43-0.144283-1.39140.08371
44-0.164997-1.59120.057482
45-0.116903-1.12740.131243
46-0.179368-1.72980.043495
47-0.141781-1.36730.087416
48-0.016549-0.15960.436774
49-0.148236-1.42950.078101
50-0.201816-1.94620.027322
51-0.151036-1.45650.074306
52-0.220144-2.1230.018205
53-0.205641-1.98310.025151
54-0.157436-1.51830.066171
55-0.238731-2.30220.011776
56-0.268162-2.58610.00563
57-0.208826-2.01380.023458
58-0.284657-2.74510.00363
59-0.240208-2.31650.011364
60-0.16239-1.5660.060368

\begin{tabular}{lllllllll}
\hline
Autocorrelation Function \tabularnewline
Time lag k & ACF(k) & T-STAT & P-value \tabularnewline
1 & 0.562459 & 5.4242 & 0 \tabularnewline
2 & 0.484055 & 4.6681 & 5e-06 \tabularnewline
3 & 0.655293 & 6.3194 & 0 \tabularnewline
4 & 0.422989 & 4.0792 & 4.8e-05 \tabularnewline
5 & 0.482103 & 4.6492 & 5e-06 \tabularnewline
6 & 0.623168 & 6.0096 & 0 \tabularnewline
7 & 0.387833 & 3.7401 & 0.000159 \tabularnewline
8 & 0.371117 & 3.5789 & 0.000275 \tabularnewline
9 & 0.519869 & 5.0134 & 1e-06 \tabularnewline
10 & 0.33703 & 3.2502 & 0.000803 \tabularnewline
11 & 0.428961 & 4.1367 & 3.9e-05 \tabularnewline
12 & 0.626588 & 6.0426 & 0 \tabularnewline
13 & 0.350592 & 3.381 & 0.000529 \tabularnewline
14 & 0.279745 & 2.6978 & 0.004145 \tabularnewline
15 & 0.388459 & 3.7462 & 0.000156 \tabularnewline
16 & 0.177382 & 1.7106 & 0.045243 \tabularnewline
17 & 0.23564 & 2.2724 & 0.012682 \tabularnewline
18 & 0.3412 & 3.2904 & 0.000707 \tabularnewline
19 & 0.12071 & 1.1641 & 0.123684 \tabularnewline
20 & 0.119691 & 1.1543 & 0.125676 \tabularnewline
21 & 0.213894 & 2.0627 & 0.020964 \tabularnewline
22 & 0.082846 & 0.7989 & 0.213181 \tabularnewline
23 & 0.169833 & 1.6378 & 0.05242 \tabularnewline
24 & 0.271821 & 2.6213 & 0.005116 \tabularnewline
25 & 0.102871 & 0.9921 & 0.161873 \tabularnewline
26 & 0.036486 & 0.3519 & 0.362871 \tabularnewline
27 & 0.118071 & 1.1386 & 0.128891 \tabularnewline
28 & -0.044813 & -0.4322 & 0.333311 \tabularnewline
29 & -0.01897 & -0.1829 & 0.427623 \tabularnewline
30 & 0.088842 & 0.8568 & 0.196889 \tabularnewline
31 & -0.067972 & -0.6555 & 0.256881 \tabularnewline
32 & -0.073847 & -0.7122 & 0.239077 \tabularnewline
33 & -0.015876 & -0.1531 & 0.439324 \tabularnewline
34 & -0.083912 & -0.8092 & 0.210226 \tabularnewline
35 & -0.018242 & -0.1759 & 0.43037 \tabularnewline
36 & 0.12103 & 1.1672 & 0.123063 \tabularnewline
37 & -0.038595 & -0.3722 & 0.355296 \tabularnewline
38 & -0.098483 & -0.9497 & 0.172354 \tabularnewline
39 & -0.025734 & -0.2482 & 0.402274 \tabularnewline
40 & -0.136464 & -1.316 & 0.095703 \tabularnewline
41 & -0.136285 & -1.3143 & 0.095992 \tabularnewline
42 & -0.049811 & -0.4804 & 0.31605 \tabularnewline
43 & -0.144283 & -1.3914 & 0.08371 \tabularnewline
44 & -0.164997 & -1.5912 & 0.057482 \tabularnewline
45 & -0.116903 & -1.1274 & 0.131243 \tabularnewline
46 & -0.179368 & -1.7298 & 0.043495 \tabularnewline
47 & -0.141781 & -1.3673 & 0.087416 \tabularnewline
48 & -0.016549 & -0.1596 & 0.436774 \tabularnewline
49 & -0.148236 & -1.4295 & 0.078101 \tabularnewline
50 & -0.201816 & -1.9462 & 0.027322 \tabularnewline
51 & -0.151036 & -1.4565 & 0.074306 \tabularnewline
52 & -0.220144 & -2.123 & 0.018205 \tabularnewline
53 & -0.205641 & -1.9831 & 0.025151 \tabularnewline
54 & -0.157436 & -1.5183 & 0.066171 \tabularnewline
55 & -0.238731 & -2.3022 & 0.011776 \tabularnewline
56 & -0.268162 & -2.5861 & 0.00563 \tabularnewline
57 & -0.208826 & -2.0138 & 0.023458 \tabularnewline
58 & -0.284657 & -2.7451 & 0.00363 \tabularnewline
59 & -0.240208 & -2.3165 & 0.011364 \tabularnewline
60 & -0.16239 & -1.566 & 0.060368 \tabularnewline
\hline
\end{tabular}
%Source: https://freestatistics.org/blog/index.php?pk=35374&T=1

[TABLE]
[ROW][C]Autocorrelation Function[/C][/ROW]
[ROW][C]Time lag k[/C][C]ACF(k)[/C][C]T-STAT[/C][C]P-value[/C][/ROW]
[ROW][C]1[/C][C]0.562459[/C][C]5.4242[/C][C]0[/C][/ROW]
[ROW][C]2[/C][C]0.484055[/C][C]4.6681[/C][C]5e-06[/C][/ROW]
[ROW][C]3[/C][C]0.655293[/C][C]6.3194[/C][C]0[/C][/ROW]
[ROW][C]4[/C][C]0.422989[/C][C]4.0792[/C][C]4.8e-05[/C][/ROW]
[ROW][C]5[/C][C]0.482103[/C][C]4.6492[/C][C]5e-06[/C][/ROW]
[ROW][C]6[/C][C]0.623168[/C][C]6.0096[/C][C]0[/C][/ROW]
[ROW][C]7[/C][C]0.387833[/C][C]3.7401[/C][C]0.000159[/C][/ROW]
[ROW][C]8[/C][C]0.371117[/C][C]3.5789[/C][C]0.000275[/C][/ROW]
[ROW][C]9[/C][C]0.519869[/C][C]5.0134[/C][C]1e-06[/C][/ROW]
[ROW][C]10[/C][C]0.33703[/C][C]3.2502[/C][C]0.000803[/C][/ROW]
[ROW][C]11[/C][C]0.428961[/C][C]4.1367[/C][C]3.9e-05[/C][/ROW]
[ROW][C]12[/C][C]0.626588[/C][C]6.0426[/C][C]0[/C][/ROW]
[ROW][C]13[/C][C]0.350592[/C][C]3.381[/C][C]0.000529[/C][/ROW]
[ROW][C]14[/C][C]0.279745[/C][C]2.6978[/C][C]0.004145[/C][/ROW]
[ROW][C]15[/C][C]0.388459[/C][C]3.7462[/C][C]0.000156[/C][/ROW]
[ROW][C]16[/C][C]0.177382[/C][C]1.7106[/C][C]0.045243[/C][/ROW]
[ROW][C]17[/C][C]0.23564[/C][C]2.2724[/C][C]0.012682[/C][/ROW]
[ROW][C]18[/C][C]0.3412[/C][C]3.2904[/C][C]0.000707[/C][/ROW]
[ROW][C]19[/C][C]0.12071[/C][C]1.1641[/C][C]0.123684[/C][/ROW]
[ROW][C]20[/C][C]0.119691[/C][C]1.1543[/C][C]0.125676[/C][/ROW]
[ROW][C]21[/C][C]0.213894[/C][C]2.0627[/C][C]0.020964[/C][/ROW]
[ROW][C]22[/C][C]0.082846[/C][C]0.7989[/C][C]0.213181[/C][/ROW]
[ROW][C]23[/C][C]0.169833[/C][C]1.6378[/C][C]0.05242[/C][/ROW]
[ROW][C]24[/C][C]0.271821[/C][C]2.6213[/C][C]0.005116[/C][/ROW]
[ROW][C]25[/C][C]0.102871[/C][C]0.9921[/C][C]0.161873[/C][/ROW]
[ROW][C]26[/C][C]0.036486[/C][C]0.3519[/C][C]0.362871[/C][/ROW]
[ROW][C]27[/C][C]0.118071[/C][C]1.1386[/C][C]0.128891[/C][/ROW]
[ROW][C]28[/C][C]-0.044813[/C][C]-0.4322[/C][C]0.333311[/C][/ROW]
[ROW][C]29[/C][C]-0.01897[/C][C]-0.1829[/C][C]0.427623[/C][/ROW]
[ROW][C]30[/C][C]0.088842[/C][C]0.8568[/C][C]0.196889[/C][/ROW]
[ROW][C]31[/C][C]-0.067972[/C][C]-0.6555[/C][C]0.256881[/C][/ROW]
[ROW][C]32[/C][C]-0.073847[/C][C]-0.7122[/C][C]0.239077[/C][/ROW]
[ROW][C]33[/C][C]-0.015876[/C][C]-0.1531[/C][C]0.439324[/C][/ROW]
[ROW][C]34[/C][C]-0.083912[/C][C]-0.8092[/C][C]0.210226[/C][/ROW]
[ROW][C]35[/C][C]-0.018242[/C][C]-0.1759[/C][C]0.43037[/C][/ROW]
[ROW][C]36[/C][C]0.12103[/C][C]1.1672[/C][C]0.123063[/C][/ROW]
[ROW][C]37[/C][C]-0.038595[/C][C]-0.3722[/C][C]0.355296[/C][/ROW]
[ROW][C]38[/C][C]-0.098483[/C][C]-0.9497[/C][C]0.172354[/C][/ROW]
[ROW][C]39[/C][C]-0.025734[/C][C]-0.2482[/C][C]0.402274[/C][/ROW]
[ROW][C]40[/C][C]-0.136464[/C][C]-1.316[/C][C]0.095703[/C][/ROW]
[ROW][C]41[/C][C]-0.136285[/C][C]-1.3143[/C][C]0.095992[/C][/ROW]
[ROW][C]42[/C][C]-0.049811[/C][C]-0.4804[/C][C]0.31605[/C][/ROW]
[ROW][C]43[/C][C]-0.144283[/C][C]-1.3914[/C][C]0.08371[/C][/ROW]
[ROW][C]44[/C][C]-0.164997[/C][C]-1.5912[/C][C]0.057482[/C][/ROW]
[ROW][C]45[/C][C]-0.116903[/C][C]-1.1274[/C][C]0.131243[/C][/ROW]
[ROW][C]46[/C][C]-0.179368[/C][C]-1.7298[/C][C]0.043495[/C][/ROW]
[ROW][C]47[/C][C]-0.141781[/C][C]-1.3673[/C][C]0.087416[/C][/ROW]
[ROW][C]48[/C][C]-0.016549[/C][C]-0.1596[/C][C]0.436774[/C][/ROW]
[ROW][C]49[/C][C]-0.148236[/C][C]-1.4295[/C][C]0.078101[/C][/ROW]
[ROW][C]50[/C][C]-0.201816[/C][C]-1.9462[/C][C]0.027322[/C][/ROW]
[ROW][C]51[/C][C]-0.151036[/C][C]-1.4565[/C][C]0.074306[/C][/ROW]
[ROW][C]52[/C][C]-0.220144[/C][C]-2.123[/C][C]0.018205[/C][/ROW]
[ROW][C]53[/C][C]-0.205641[/C][C]-1.9831[/C][C]0.025151[/C][/ROW]
[ROW][C]54[/C][C]-0.157436[/C][C]-1.5183[/C][C]0.066171[/C][/ROW]
[ROW][C]55[/C][C]-0.238731[/C][C]-2.3022[/C][C]0.011776[/C][/ROW]
[ROW][C]56[/C][C]-0.268162[/C][C]-2.5861[/C][C]0.00563[/C][/ROW]
[ROW][C]57[/C][C]-0.208826[/C][C]-2.0138[/C][C]0.023458[/C][/ROW]
[ROW][C]58[/C][C]-0.284657[/C][C]-2.7451[/C][C]0.00363[/C][/ROW]
[ROW][C]59[/C][C]-0.240208[/C][C]-2.3165[/C][C]0.011364[/C][/ROW]
[ROW][C]60[/C][C]-0.16239[/C][C]-1.566[/C][C]0.060368[/C][/ROW]
[/TABLE]
Source: https://freestatistics.org/blog/index.php?pk=35374&T=1

Globally Unique Identifier (entire table): ba.freestatistics.org/blog/index.php?pk=35374&T=1

As an alternative you can also use a QR Code:  

The GUIDs for individual cells are displayed in the table below:

Autocorrelation Function
Time lag kACF(k)T-STATP-value
10.5624595.42420
20.4840554.66815e-06
30.6552936.31940
40.4229894.07924.8e-05
50.4821034.64925e-06
60.6231686.00960
70.3878333.74010.000159
80.3711173.57890.000275
90.5198695.01341e-06
100.337033.25020.000803
110.4289614.13673.9e-05
120.6265886.04260
130.3505923.3810.000529
140.2797452.69780.004145
150.3884593.74620.000156
160.1773821.71060.045243
170.235642.27240.012682
180.34123.29040.000707
190.120711.16410.123684
200.1196911.15430.125676
210.2138942.06270.020964
220.0828460.79890.213181
230.1698331.63780.05242
240.2718212.62130.005116
250.1028710.99210.161873
260.0364860.35190.362871
270.1180711.13860.128891
28-0.044813-0.43220.333311
29-0.01897-0.18290.427623
300.0888420.85680.196889
31-0.067972-0.65550.256881
32-0.073847-0.71220.239077
33-0.015876-0.15310.439324
34-0.083912-0.80920.210226
35-0.018242-0.17590.43037
360.121031.16720.123063
37-0.038595-0.37220.355296
38-0.098483-0.94970.172354
39-0.025734-0.24820.402274
40-0.136464-1.3160.095703
41-0.136285-1.31430.095992
42-0.049811-0.48040.31605
43-0.144283-1.39140.08371
44-0.164997-1.59120.057482
45-0.116903-1.12740.131243
46-0.179368-1.72980.043495
47-0.141781-1.36730.087416
48-0.016549-0.15960.436774
49-0.148236-1.42950.078101
50-0.201816-1.94620.027322
51-0.151036-1.45650.074306
52-0.220144-2.1230.018205
53-0.205641-1.98310.025151
54-0.157436-1.51830.066171
55-0.238731-2.30220.011776
56-0.268162-2.58610.00563
57-0.208826-2.01380.023458
58-0.284657-2.74510.00363
59-0.240208-2.31650.011364
60-0.16239-1.5660.060368


Partial Autocorrelation Function
Time lag kPACF(k)T-STATP-value
10.5624595.42420
20.2452962.36560.01004
30.4853614.68075e-06
4-0.140815-1.3580.088879
50.2452952.36550.01004
60.2160032.08310.019995
7-0.105917-1.02140.154852
8-0.094534-0.91160.182155
90.1546891.49180.069572
10-0.061242-0.59060.278112
110.1909921.84190.034341
120.2926332.8220.002917
13-0.139546-1.34570.09083
14-0.303274-2.92470.002166
15-0.136314-1.31460.095944
16-0.182864-1.76350.040553
17-0.03468-0.33440.369399
18-0.005292-0.0510.479705
190.0569570.54930.292067
20-0.029819-0.28760.387161
21-0.002611-0.02520.489983
220.0229570.22140.412639
230.0358820.3460.365049
24-0.034754-0.33520.36913
250.1048151.01080.157367
26-0.126268-1.21770.113211
270.0511190.4930.311596
28-0.137057-1.32170.09475
29-0.02275-0.21940.413411
30-0.025452-0.24550.403323
310.124771.20320.115969
320.0019410.01870.492553
33-0.018913-0.18240.427837
340.0081720.07880.468678
350.0268150.25860.39826
360.1468691.41640.080006
37-0.036354-0.35060.363344
38-0.081511-0.78610.216914
39-0.061054-0.58880.278718
40-0.029739-0.28680.387455
41-0.074207-0.71560.238008
42-0.089134-0.85960.196116
430.0852070.82170.206674
440.0469130.45240.326012
45-0.044825-0.43230.333271
46-0.061473-0.59280.27737
47-0.111292-1.07330.142965
48-0.036643-0.35340.362304
49-0.090993-0.87750.191237
500.0373560.36030.359738
51-0.019756-0.19050.42466
520.0947090.91330.181713
530.0604950.58340.280519
54-0.055863-0.53870.295681
55-0.082507-0.79570.214125
56-0.067406-0.650.258635
57-0.01777-0.17140.432153
58-0.087544-0.84420.200351
59-0.00158-0.01520.493939
600.0056680.05470.478264

\begin{tabular}{lllllllll}
\hline
Partial Autocorrelation Function \tabularnewline
Time lag k & PACF(k) & T-STAT & P-value \tabularnewline
1 & 0.562459 & 5.4242 & 0 \tabularnewline
2 & 0.245296 & 2.3656 & 0.01004 \tabularnewline
3 & 0.485361 & 4.6807 & 5e-06 \tabularnewline
4 & -0.140815 & -1.358 & 0.088879 \tabularnewline
5 & 0.245295 & 2.3655 & 0.01004 \tabularnewline
6 & 0.216003 & 2.0831 & 0.019995 \tabularnewline
7 & -0.105917 & -1.0214 & 0.154852 \tabularnewline
8 & -0.094534 & -0.9116 & 0.182155 \tabularnewline
9 & 0.154689 & 1.4918 & 0.069572 \tabularnewline
10 & -0.061242 & -0.5906 & 0.278112 \tabularnewline
11 & 0.190992 & 1.8419 & 0.034341 \tabularnewline
12 & 0.292633 & 2.822 & 0.002917 \tabularnewline
13 & -0.139546 & -1.3457 & 0.09083 \tabularnewline
14 & -0.303274 & -2.9247 & 0.002166 \tabularnewline
15 & -0.136314 & -1.3146 & 0.095944 \tabularnewline
16 & -0.182864 & -1.7635 & 0.040553 \tabularnewline
17 & -0.03468 & -0.3344 & 0.369399 \tabularnewline
18 & -0.005292 & -0.051 & 0.479705 \tabularnewline
19 & 0.056957 & 0.5493 & 0.292067 \tabularnewline
20 & -0.029819 & -0.2876 & 0.387161 \tabularnewline
21 & -0.002611 & -0.0252 & 0.489983 \tabularnewline
22 & 0.022957 & 0.2214 & 0.412639 \tabularnewline
23 & 0.035882 & 0.346 & 0.365049 \tabularnewline
24 & -0.034754 & -0.3352 & 0.36913 \tabularnewline
25 & 0.104815 & 1.0108 & 0.157367 \tabularnewline
26 & -0.126268 & -1.2177 & 0.113211 \tabularnewline
27 & 0.051119 & 0.493 & 0.311596 \tabularnewline
28 & -0.137057 & -1.3217 & 0.09475 \tabularnewline
29 & -0.02275 & -0.2194 & 0.413411 \tabularnewline
30 & -0.025452 & -0.2455 & 0.403323 \tabularnewline
31 & 0.12477 & 1.2032 & 0.115969 \tabularnewline
32 & 0.001941 & 0.0187 & 0.492553 \tabularnewline
33 & -0.018913 & -0.1824 & 0.427837 \tabularnewline
34 & 0.008172 & 0.0788 & 0.468678 \tabularnewline
35 & 0.026815 & 0.2586 & 0.39826 \tabularnewline
36 & 0.146869 & 1.4164 & 0.080006 \tabularnewline
37 & -0.036354 & -0.3506 & 0.363344 \tabularnewline
38 & -0.081511 & -0.7861 & 0.216914 \tabularnewline
39 & -0.061054 & -0.5888 & 0.278718 \tabularnewline
40 & -0.029739 & -0.2868 & 0.387455 \tabularnewline
41 & -0.074207 & -0.7156 & 0.238008 \tabularnewline
42 & -0.089134 & -0.8596 & 0.196116 \tabularnewline
43 & 0.085207 & 0.8217 & 0.206674 \tabularnewline
44 & 0.046913 & 0.4524 & 0.326012 \tabularnewline
45 & -0.044825 & -0.4323 & 0.333271 \tabularnewline
46 & -0.061473 & -0.5928 & 0.27737 \tabularnewline
47 & -0.111292 & -1.0733 & 0.142965 \tabularnewline
48 & -0.036643 & -0.3534 & 0.362304 \tabularnewline
49 & -0.090993 & -0.8775 & 0.191237 \tabularnewline
50 & 0.037356 & 0.3603 & 0.359738 \tabularnewline
51 & -0.019756 & -0.1905 & 0.42466 \tabularnewline
52 & 0.094709 & 0.9133 & 0.181713 \tabularnewline
53 & 0.060495 & 0.5834 & 0.280519 \tabularnewline
54 & -0.055863 & -0.5387 & 0.295681 \tabularnewline
55 & -0.082507 & -0.7957 & 0.214125 \tabularnewline
56 & -0.067406 & -0.65 & 0.258635 \tabularnewline
57 & -0.01777 & -0.1714 & 0.432153 \tabularnewline
58 & -0.087544 & -0.8442 & 0.200351 \tabularnewline
59 & -0.00158 & -0.0152 & 0.493939 \tabularnewline
60 & 0.005668 & 0.0547 & 0.478264 \tabularnewline
\hline
\end{tabular}
%Source: https://freestatistics.org/blog/index.php?pk=35374&T=2

[TABLE]
[ROW][C]Partial Autocorrelation Function[/C][/ROW]
[ROW][C]Time lag k[/C][C]PACF(k)[/C][C]T-STAT[/C][C]P-value[/C][/ROW]
[ROW][C]1[/C][C]0.562459[/C][C]5.4242[/C][C]0[/C][/ROW]
[ROW][C]2[/C][C]0.245296[/C][C]2.3656[/C][C]0.01004[/C][/ROW]
[ROW][C]3[/C][C]0.485361[/C][C]4.6807[/C][C]5e-06[/C][/ROW]
[ROW][C]4[/C][C]-0.140815[/C][C]-1.358[/C][C]0.088879[/C][/ROW]
[ROW][C]5[/C][C]0.245295[/C][C]2.3655[/C][C]0.01004[/C][/ROW]
[ROW][C]6[/C][C]0.216003[/C][C]2.0831[/C][C]0.019995[/C][/ROW]
[ROW][C]7[/C][C]-0.105917[/C][C]-1.0214[/C][C]0.154852[/C][/ROW]
[ROW][C]8[/C][C]-0.094534[/C][C]-0.9116[/C][C]0.182155[/C][/ROW]
[ROW][C]9[/C][C]0.154689[/C][C]1.4918[/C][C]0.069572[/C][/ROW]
[ROW][C]10[/C][C]-0.061242[/C][C]-0.5906[/C][C]0.278112[/C][/ROW]
[ROW][C]11[/C][C]0.190992[/C][C]1.8419[/C][C]0.034341[/C][/ROW]
[ROW][C]12[/C][C]0.292633[/C][C]2.822[/C][C]0.002917[/C][/ROW]
[ROW][C]13[/C][C]-0.139546[/C][C]-1.3457[/C][C]0.09083[/C][/ROW]
[ROW][C]14[/C][C]-0.303274[/C][C]-2.9247[/C][C]0.002166[/C][/ROW]
[ROW][C]15[/C][C]-0.136314[/C][C]-1.3146[/C][C]0.095944[/C][/ROW]
[ROW][C]16[/C][C]-0.182864[/C][C]-1.7635[/C][C]0.040553[/C][/ROW]
[ROW][C]17[/C][C]-0.03468[/C][C]-0.3344[/C][C]0.369399[/C][/ROW]
[ROW][C]18[/C][C]-0.005292[/C][C]-0.051[/C][C]0.479705[/C][/ROW]
[ROW][C]19[/C][C]0.056957[/C][C]0.5493[/C][C]0.292067[/C][/ROW]
[ROW][C]20[/C][C]-0.029819[/C][C]-0.2876[/C][C]0.387161[/C][/ROW]
[ROW][C]21[/C][C]-0.002611[/C][C]-0.0252[/C][C]0.489983[/C][/ROW]
[ROW][C]22[/C][C]0.022957[/C][C]0.2214[/C][C]0.412639[/C][/ROW]
[ROW][C]23[/C][C]0.035882[/C][C]0.346[/C][C]0.365049[/C][/ROW]
[ROW][C]24[/C][C]-0.034754[/C][C]-0.3352[/C][C]0.36913[/C][/ROW]
[ROW][C]25[/C][C]0.104815[/C][C]1.0108[/C][C]0.157367[/C][/ROW]
[ROW][C]26[/C][C]-0.126268[/C][C]-1.2177[/C][C]0.113211[/C][/ROW]
[ROW][C]27[/C][C]0.051119[/C][C]0.493[/C][C]0.311596[/C][/ROW]
[ROW][C]28[/C][C]-0.137057[/C][C]-1.3217[/C][C]0.09475[/C][/ROW]
[ROW][C]29[/C][C]-0.02275[/C][C]-0.2194[/C][C]0.413411[/C][/ROW]
[ROW][C]30[/C][C]-0.025452[/C][C]-0.2455[/C][C]0.403323[/C][/ROW]
[ROW][C]31[/C][C]0.12477[/C][C]1.2032[/C][C]0.115969[/C][/ROW]
[ROW][C]32[/C][C]0.001941[/C][C]0.0187[/C][C]0.492553[/C][/ROW]
[ROW][C]33[/C][C]-0.018913[/C][C]-0.1824[/C][C]0.427837[/C][/ROW]
[ROW][C]34[/C][C]0.008172[/C][C]0.0788[/C][C]0.468678[/C][/ROW]
[ROW][C]35[/C][C]0.026815[/C][C]0.2586[/C][C]0.39826[/C][/ROW]
[ROW][C]36[/C][C]0.146869[/C][C]1.4164[/C][C]0.080006[/C][/ROW]
[ROW][C]37[/C][C]-0.036354[/C][C]-0.3506[/C][C]0.363344[/C][/ROW]
[ROW][C]38[/C][C]-0.081511[/C][C]-0.7861[/C][C]0.216914[/C][/ROW]
[ROW][C]39[/C][C]-0.061054[/C][C]-0.5888[/C][C]0.278718[/C][/ROW]
[ROW][C]40[/C][C]-0.029739[/C][C]-0.2868[/C][C]0.387455[/C][/ROW]
[ROW][C]41[/C][C]-0.074207[/C][C]-0.7156[/C][C]0.238008[/C][/ROW]
[ROW][C]42[/C][C]-0.089134[/C][C]-0.8596[/C][C]0.196116[/C][/ROW]
[ROW][C]43[/C][C]0.085207[/C][C]0.8217[/C][C]0.206674[/C][/ROW]
[ROW][C]44[/C][C]0.046913[/C][C]0.4524[/C][C]0.326012[/C][/ROW]
[ROW][C]45[/C][C]-0.044825[/C][C]-0.4323[/C][C]0.333271[/C][/ROW]
[ROW][C]46[/C][C]-0.061473[/C][C]-0.5928[/C][C]0.27737[/C][/ROW]
[ROW][C]47[/C][C]-0.111292[/C][C]-1.0733[/C][C]0.142965[/C][/ROW]
[ROW][C]48[/C][C]-0.036643[/C][C]-0.3534[/C][C]0.362304[/C][/ROW]
[ROW][C]49[/C][C]-0.090993[/C][C]-0.8775[/C][C]0.191237[/C][/ROW]
[ROW][C]50[/C][C]0.037356[/C][C]0.3603[/C][C]0.359738[/C][/ROW]
[ROW][C]51[/C][C]-0.019756[/C][C]-0.1905[/C][C]0.42466[/C][/ROW]
[ROW][C]52[/C][C]0.094709[/C][C]0.9133[/C][C]0.181713[/C][/ROW]
[ROW][C]53[/C][C]0.060495[/C][C]0.5834[/C][C]0.280519[/C][/ROW]
[ROW][C]54[/C][C]-0.055863[/C][C]-0.5387[/C][C]0.295681[/C][/ROW]
[ROW][C]55[/C][C]-0.082507[/C][C]-0.7957[/C][C]0.214125[/C][/ROW]
[ROW][C]56[/C][C]-0.067406[/C][C]-0.65[/C][C]0.258635[/C][/ROW]
[ROW][C]57[/C][C]-0.01777[/C][C]-0.1714[/C][C]0.432153[/C][/ROW]
[ROW][C]58[/C][C]-0.087544[/C][C]-0.8442[/C][C]0.200351[/C][/ROW]
[ROW][C]59[/C][C]-0.00158[/C][C]-0.0152[/C][C]0.493939[/C][/ROW]
[ROW][C]60[/C][C]0.005668[/C][C]0.0547[/C][C]0.478264[/C][/ROW]
[/TABLE]
Source: https://freestatistics.org/blog/index.php?pk=35374&T=2

Globally Unique Identifier (entire table): ba.freestatistics.org/blog/index.php?pk=35374&T=2

As an alternative you can also use a QR Code:  

The GUIDs for individual cells are displayed in the table below:

Partial Autocorrelation Function
Time lag kPACF(k)T-STATP-value
10.5624595.42420
20.2452962.36560.01004
30.4853614.68075e-06
4-0.140815-1.3580.088879
50.2452952.36550.01004
60.2160032.08310.019995
7-0.105917-1.02140.154852
8-0.094534-0.91160.182155
90.1546891.49180.069572
10-0.061242-0.59060.278112
110.1909921.84190.034341
120.2926332.8220.002917
13-0.139546-1.34570.09083
14-0.303274-2.92470.002166
15-0.136314-1.31460.095944
16-0.182864-1.76350.040553
17-0.03468-0.33440.369399
18-0.005292-0.0510.479705
190.0569570.54930.292067
20-0.029819-0.28760.387161
21-0.002611-0.02520.489983
220.0229570.22140.412639
230.0358820.3460.365049
24-0.034754-0.33520.36913
250.1048151.01080.157367
26-0.126268-1.21770.113211
270.0511190.4930.311596
28-0.137057-1.32170.09475
29-0.02275-0.21940.413411
30-0.025452-0.24550.403323
310.124771.20320.115969
320.0019410.01870.492553
33-0.018913-0.18240.427837
340.0081720.07880.468678
350.0268150.25860.39826
360.1468691.41640.080006
37-0.036354-0.35060.363344
38-0.081511-0.78610.216914
39-0.061054-0.58880.278718
40-0.029739-0.28680.387455
41-0.074207-0.71560.238008
42-0.089134-0.85960.196116
430.0852070.82170.206674
440.0469130.45240.326012
45-0.044825-0.43230.333271
46-0.061473-0.59280.27737
47-0.111292-1.07330.142965
48-0.036643-0.35340.362304
49-0.090993-0.87750.191237
500.0373560.36030.359738
51-0.019756-0.19050.42466
520.0947090.91330.181713
530.0604950.58340.280519
54-0.055863-0.53870.295681
55-0.082507-0.79570.214125
56-0.067406-0.650.258635
57-0.01777-0.17140.432153
58-0.087544-0.84420.200351
59-0.00158-0.01520.493939
600.0056680.05470.478264


Parameters (Session):
par1 = 60 ; par2 = 1 ; par3 = 0 ; par4 = 0 ; par5 = 12 ;
Parameters (R input):
par1 = 60 ; par2 = 1 ; par3 = 0 ; par4 = 0 ; par5 = 12 ;
R code (references can be found in the software module):
if (par1 == 'Default') {
par1 = 10*log10(length(x))
} else {
par1 <- as.numeric(par1)
}
par2 <- as.numeric(par2)
par3 <- as.numeric(par3)
par4 <- as.numeric(par4)
par5 <- as.numeric(par5)
if (par2 == 0) {
x <- log(x)
} else {
x <- (x ^ par2 - 1) / par2
}
if (par3 > 0) x <- diff(x,lag=1,difference=par3)
if (par4 > 0) x <- diff(x,lag=par5,difference=par4)
bitmap(file='pic1.png')
racf <- acf(x,par1,main='Autocorrelation',xlab='lags',ylab='ACF')
dev.off()
bitmap(file='pic2.png')
rpacf <- pacf(x,par1,main='Partial Autocorrelation',xlab='lags',ylab='PACF')
dev.off()
(myacf <- c(racf$acf))
(mypacf <- c(rpacf$acf))
lengthx <- length(x)
sqrtn <- sqrt(lengthx)
load(file='createtable')
a<-table.start()
a<-table.row.start(a)
a<-table.element(a,'Autocorrelation Function',4,TRUE)
a<-table.row.end(a)
a<-table.row.start(a)
a<-table.element(a,'Time lag k',header=TRUE)
a<-table.element(a,hyperlink('basics.htm','ACF(k)','click here for more information about the Autocorrelation Function'),header=TRUE)
a<-table.element(a,'T-STAT',header=TRUE)
a<-table.element(a,'P-value',header=TRUE)
a<-table.row.end(a)
for (i in 2:(par1+1)) {
a<-table.row.start(a)
a<-table.element(a,i-1,header=TRUE)
a<-table.element(a,round(myacf[i],6))
mytstat <- myacf[i]*sqrtn
a<-table.element(a,round(mytstat,4))
a<-table.element(a,round(1-pt(abs(mytstat),lengthx),6))
a<-table.row.end(a)
}
a<-table.end(a)
table.save(a,file='mytable.tab')
a<-table.start()
a<-table.row.start(a)
a<-table.element(a,'Partial Autocorrelation Function',4,TRUE)
a<-table.row.end(a)
a<-table.row.start(a)
a<-table.element(a,'Time lag k',header=TRUE)
a<-table.element(a,hyperlink('basics.htm','PACF(k)','click here for more information about the Partial Autocorrelation Function'),header=TRUE)
a<-table.element(a,'T-STAT',header=TRUE)
a<-table.element(a,'P-value',header=TRUE)
a<-table.row.end(a)
for (i in 1:par1) {
a<-table.row.start(a)
a<-table.element(a,i,header=TRUE)
a<-table.element(a,round(mypacf[i],6))
mytstat <- mypacf[i]*sqrtn
a<-table.element(a,round(mytstat,4))
a<-table.element(a,round(1-pt(abs(mytstat),lengthx),6))
a<-table.row.end(a)
}
a<-table.end(a)
table.save(a,file='mytable1.tab')