Free Statistics

of Irreproducible Research!

Author's title

Author*The author of this computation has been verified*
R Software Modulerwasp_centraltendency.wasp
Title produced by softwareCentral Tendency
Date of computationSat, 20 Dec 2008 00:56:53 -0700
Cite this page as followsStatistical Computations at FreeStatistics.org, Office for Research Development and Education, URL https://freestatistics.org/blog/index.php?v=date/2008/Dec/20/t12297601028e5nowad10zuy5i.htm/, Retrieved Wed, 22 May 2024 11:55:48 +0000
Statistical Computations at FreeStatistics.org, Office for Research Development and Education, URL https://freestatistics.org/blog/index.php?pk=35291, Retrieved Wed, 22 May 2024 11:55:48 +0000
QR Codes:

Original text written by user:
IsPrivate?No (this computation is public)
User-defined keywords
Estimated Impact212
Family? (F = Feedback message, R = changed R code, M = changed R Module, P = changed Parameters, D = changed Data)
-       [Central Tendency] [textiel] [2008-12-20 07:56:53] [5925747fb2a6bb4cfcd8015825ee5e92] [Current]
Feedback Forum

Post a new message
Dataseries X:
101.3
102
109.2
88.6
94.3
98.3
86.4
80.6
104.1
108.2
93.4
71.9
94.1
94.9
96.4
91.1
84.4
86.4
88
75.1
109.7
103
82.1
68
96.4
94.3
90
88
76.1
82.5
81.4
66.5
97.2
94.1
80.7
70.5
87.8
89.5
99.6
84.2
75.1
92
80.8
73.1
99.8
90
83.1
72.4
78.8
87.3
91
80.1
73.6
86.4
74.5
71.2
92.4
81.5
85.3
69.9
84.2
90.7
100.3
79.4
84.8
92.9
81.6
76
98.7
89.1
88.7
67.1


Summary of computational transaction
Raw Inputview raw input (R code)
Raw Outputview raw output of R engine
Computing time1 seconds
R Server'Gwilym Jenkins' @ 72.249.127.135

\begin{tabular}{lllllllll}
\hline
Summary of computational transaction \tabularnewline
Raw Input & view raw input (R code)  \tabularnewline
Raw Output & view raw output of R engine  \tabularnewline
Computing time & 1 seconds \tabularnewline
R Server & 'Gwilym Jenkins' @ 72.249.127.135 \tabularnewline
\hline
\end{tabular}
%Source: https://freestatistics.org/blog/index.php?pk=35291&T=0

[TABLE]
[ROW][C]Summary of computational transaction[/C][/ROW]
[ROW][C]Raw Input[/C][C]view raw input (R code) [/C][/ROW]
[ROW][C]Raw Output[/C][C]view raw output of R engine [/C][/ROW]
[ROW][C]Computing time[/C][C]1 seconds[/C][/ROW]
[ROW][C]R Server[/C][C]'Gwilym Jenkins' @ 72.249.127.135[/C][/ROW]
[/TABLE]
Source: https://freestatistics.org/blog/index.php?pk=35291&T=0

Globally Unique Identifier (entire table): ba.freestatistics.org/blog/index.php?pk=35291&T=0

As an alternative you can also use a QR Code:  

The GUIDs for individual cells are displayed in the table below:

Summary of computational transaction
Raw Inputview raw input (R code)
Raw Outputview raw output of R engine
Computing time1 seconds
R Server'Gwilym Jenkins' @ 72.249.127.135


Central Tendency - Ungrouped Data
MeasureValueS.E.Value/S.E.
Arithmetic Mean86.97361111111111.2448092428473069.8690274119213
Geometric Mean86.3349274151293
Harmonic Mean85.690677783484
Quadratic Mean87.603807470528
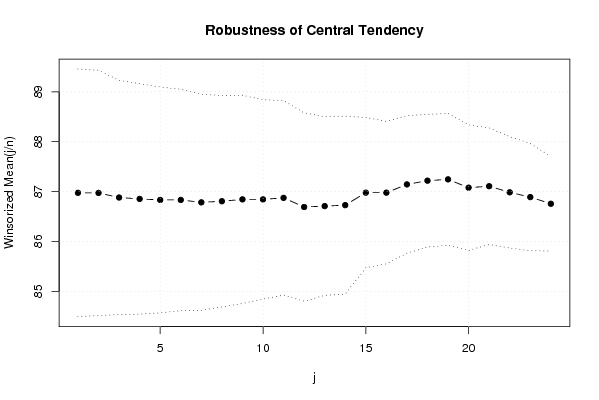
Winsorized Mean ( 1 / 24 )86.9751.2411356270599370.0769505795523
Winsorized Mean ( 2 / 24 )86.97222222222221.2287142634024070.7831143600381
Winsorized Mean ( 3 / 24 )86.88055555555551.1735171759131274.0343280344009
Winsorized Mean ( 4 / 24 )86.85277777777781.1544582091777875.2325004814472
Winsorized Mean ( 5 / 24 )86.83194444444441.1314794738056676.7419528631752
Winsorized Mean ( 6 / 24 )86.83194444444441.1094078175976778.2687331629515
Winsorized Mean ( 7 / 24 )86.78333333333331.0827716131286380.1492505724044
Winsorized Mean ( 8 / 24 )86.80555555555561.0587161314456081.9913411889068
Winsorized Mean ( 9 / 24 )86.84305555555551.0431155677073783.2535322489965
Winsorized Mean ( 10 / 24 )86.84305555555560.99985489242355686.855658969729
Winsorized Mean ( 11 / 24 )86.87361111111110.97392650476336289.1993499367995
Winsorized Mean ( 12 / 24 )86.69027777777780.9443994368130691.7940803420213
Winsorized Mean ( 13 / 24 )86.70833333333330.89429103506580196.9576233389765
Winsorized Mean ( 14 / 24 )86.72777777777780.89101808762858997.3355973149776
Winsorized Mean ( 15 / 24 )86.97777777777780.75331614874616115.459860939588
Winsorized Mean ( 16 / 24 )86.97777777777780.713631037385869121.880598266003
Winsorized Mean ( 17 / 24 )87.14305555555550.689372223515235126.409293242477
Winsorized Mean ( 18 / 24 )87.21805555555560.664301339097784131.292909440782
Winsorized Mean ( 19 / 24 )87.24444444444440.660608888552183132.066712931539
Winsorized Mean ( 20 / 24 )87.07777777777780.628727452086458138.498450304351
Winsorized Mean ( 21 / 24 )87.10694444444450.583843929415936149.195598439439
Winsorized Mean ( 22 / 24 )86.98472222222220.558515175076888155.742808976045
Winsorized Mean ( 23 / 24 )86.88888888888890.536793920831022161.866380219758
Winsorized Mean ( 24 / 24 )86.75555555555550.474184453031134182.957401916042
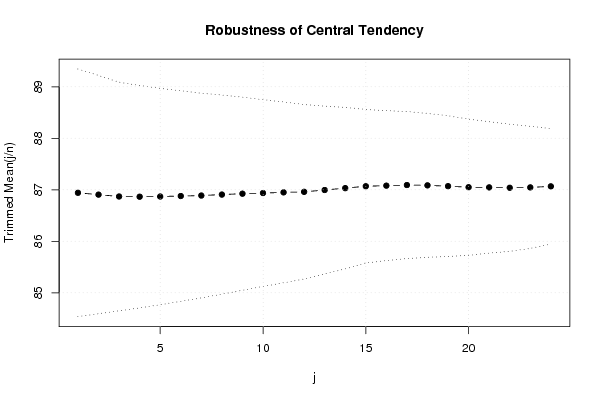
Trimmed Mean ( 1 / 24 )86.94142857142861.2026170442422872.2935276758918
Trimmed Mean ( 2 / 24 )86.90588235294121.1567602619249475.1286893347484
Trimmed Mean ( 3 / 24 )86.8696969696971.1099674908550778.263280398218
Trimmed Mean ( 4 / 24 )86.8656251.0797266398563580.4514974378674
Trimmed Mean ( 5 / 24 )86.86935483870971.0503445298868082.7055812325426
Trimmed Mean ( 6 / 24 )86.87833333333331.0220619782490285.002999017899
Trimmed Mean ( 7 / 24 )86.88793103448280.9938683082142487.4239879834794
Trimmed Mean ( 8 / 24 )86.90714285714290.966278364422589.9400690908394
Trimmed Mean ( 9 / 24 )86.9240740740740.93814622799945792.6551442406102
Trimmed Mean ( 10 / 24 )86.93653846153850.90679531534840495.8722845057224
Trimmed Mean ( 11 / 24 )86.950.87775804392410499.0591890349206
Trimmed Mean ( 12 / 24 )86.96041666666670.846973855923666102.671901922914
Trimmed Mean ( 13 / 24 )86.9956521739130.81436354640743106.826554992171
Trimmed Mean ( 14 / 24 )87.03181818181820.784157165445271110.987722891493
Trimmed Mean ( 15 / 24 )87.06904761904760.745123426666187116.851845617859
Trimmed Mean ( 16 / 24 )87.080.727819011032628119.645129736926
Trimmed Mean ( 17 / 24 )87.09210526315790.71323977421233122.107751715527
Trimmed Mean ( 18 / 24 )87.08611111111110.69829898515116124.711782435513
Trimmed Mean ( 19 / 24 )87.07058823529410.682823766509257127.515462269888
Trimmed Mean ( 20 / 24 )87.050.660766905365127131.740859436503
Trimmed Mean ( 21 / 24 )87.04666666666670.637645333144708136.512669570362
Trimmed Mean ( 22 / 24 )87.03928571428570.61677046071401141.121034904175
Trimmed Mean ( 23 / 24 )87.04615384615380.592471505818719146.920405439359
Trimmed Mean ( 24 / 24 )87.06666666666670.561366947941848155.097600572818
Median87.55
Midrange88.1
Midmean - Weighted Average at Xnp86.8972972972973
Midmean - Weighted Average at X(n+1)p87.0861111111111
Midmean - Empirical Distribution Function86.8972972972973
Midmean - Empirical Distribution Function - Averaging87.0861111111111
Midmean - Empirical Distribution Function - Interpolation87.0861111111111
Midmean - Closest Observation86.8972972972973
Midmean - True Basic - Statistics Graphics Toolkit87.0861111111111
Midmean - MS Excel (old versions)87.2769230769231
Number of observations72

\begin{tabular}{lllllllll}
\hline
Central Tendency - Ungrouped Data \tabularnewline
Measure & Value & S.E. & Value/S.E. \tabularnewline
Arithmetic Mean & 86.9736111111111 & 1.24480924284730 & 69.8690274119213 \tabularnewline
Geometric Mean & 86.3349274151293 &  &  \tabularnewline
Harmonic Mean & 85.690677783484 &  &  \tabularnewline
Quadratic Mean & 87.603807470528 &  &  \tabularnewline
Winsorized Mean ( 1 / 24 ) & 86.975 & 1.24113562705993 & 70.0769505795523 \tabularnewline
Winsorized Mean ( 2 / 24 ) & 86.9722222222222 & 1.22871426340240 & 70.7831143600381 \tabularnewline
Winsorized Mean ( 3 / 24 ) & 86.8805555555555 & 1.17351717591312 & 74.0343280344009 \tabularnewline
Winsorized Mean ( 4 / 24 ) & 86.8527777777778 & 1.15445820917778 & 75.2325004814472 \tabularnewline
Winsorized Mean ( 5 / 24 ) & 86.8319444444444 & 1.13147947380566 & 76.7419528631752 \tabularnewline
Winsorized Mean ( 6 / 24 ) & 86.8319444444444 & 1.10940781759767 & 78.2687331629515 \tabularnewline
Winsorized Mean ( 7 / 24 ) & 86.7833333333333 & 1.08277161312863 & 80.1492505724044 \tabularnewline
Winsorized Mean ( 8 / 24 ) & 86.8055555555556 & 1.05871613144560 & 81.9913411889068 \tabularnewline
Winsorized Mean ( 9 / 24 ) & 86.8430555555555 & 1.04311556770737 & 83.2535322489965 \tabularnewline
Winsorized Mean ( 10 / 24 ) & 86.8430555555556 & 0.999854892423556 & 86.855658969729 \tabularnewline
Winsorized Mean ( 11 / 24 ) & 86.8736111111111 & 0.973926504763362 & 89.1993499367995 \tabularnewline
Winsorized Mean ( 12 / 24 ) & 86.6902777777778 & 0.94439943681306 & 91.7940803420213 \tabularnewline
Winsorized Mean ( 13 / 24 ) & 86.7083333333333 & 0.894291035065801 & 96.9576233389765 \tabularnewline
Winsorized Mean ( 14 / 24 ) & 86.7277777777778 & 0.891018087628589 & 97.3355973149776 \tabularnewline
Winsorized Mean ( 15 / 24 ) & 86.9777777777778 & 0.75331614874616 & 115.459860939588 \tabularnewline
Winsorized Mean ( 16 / 24 ) & 86.9777777777778 & 0.713631037385869 & 121.880598266003 \tabularnewline
Winsorized Mean ( 17 / 24 ) & 87.1430555555555 & 0.689372223515235 & 126.409293242477 \tabularnewline
Winsorized Mean ( 18 / 24 ) & 87.2180555555556 & 0.664301339097784 & 131.292909440782 \tabularnewline
Winsorized Mean ( 19 / 24 ) & 87.2444444444444 & 0.660608888552183 & 132.066712931539 \tabularnewline
Winsorized Mean ( 20 / 24 ) & 87.0777777777778 & 0.628727452086458 & 138.498450304351 \tabularnewline
Winsorized Mean ( 21 / 24 ) & 87.1069444444445 & 0.583843929415936 & 149.195598439439 \tabularnewline
Winsorized Mean ( 22 / 24 ) & 86.9847222222222 & 0.558515175076888 & 155.742808976045 \tabularnewline
Winsorized Mean ( 23 / 24 ) & 86.8888888888889 & 0.536793920831022 & 161.866380219758 \tabularnewline
Winsorized Mean ( 24 / 24 ) & 86.7555555555555 & 0.474184453031134 & 182.957401916042 \tabularnewline
Trimmed Mean ( 1 / 24 ) & 86.9414285714286 & 1.20261704424228 & 72.2935276758918 \tabularnewline
Trimmed Mean ( 2 / 24 ) & 86.9058823529412 & 1.15676026192494 & 75.1286893347484 \tabularnewline
Trimmed Mean ( 3 / 24 ) & 86.869696969697 & 1.10996749085507 & 78.263280398218 \tabularnewline
Trimmed Mean ( 4 / 24 ) & 86.865625 & 1.07972663985635 & 80.4514974378674 \tabularnewline
Trimmed Mean ( 5 / 24 ) & 86.8693548387097 & 1.05034452988680 & 82.7055812325426 \tabularnewline
Trimmed Mean ( 6 / 24 ) & 86.8783333333333 & 1.02206197824902 & 85.002999017899 \tabularnewline
Trimmed Mean ( 7 / 24 ) & 86.8879310344828 & 0.99386830821424 & 87.4239879834794 \tabularnewline
Trimmed Mean ( 8 / 24 ) & 86.9071428571429 & 0.9662783644225 & 89.9400690908394 \tabularnewline
Trimmed Mean ( 9 / 24 ) & 86.924074074074 & 0.938146227999457 & 92.6551442406102 \tabularnewline
Trimmed Mean ( 10 / 24 ) & 86.9365384615385 & 0.906795315348404 & 95.8722845057224 \tabularnewline
Trimmed Mean ( 11 / 24 ) & 86.95 & 0.877758043924104 & 99.0591890349206 \tabularnewline
Trimmed Mean ( 12 / 24 ) & 86.9604166666667 & 0.846973855923666 & 102.671901922914 \tabularnewline
Trimmed Mean ( 13 / 24 ) & 86.995652173913 & 0.81436354640743 & 106.826554992171 \tabularnewline
Trimmed Mean ( 14 / 24 ) & 87.0318181818182 & 0.784157165445271 & 110.987722891493 \tabularnewline
Trimmed Mean ( 15 / 24 ) & 87.0690476190476 & 0.745123426666187 & 116.851845617859 \tabularnewline
Trimmed Mean ( 16 / 24 ) & 87.08 & 0.727819011032628 & 119.645129736926 \tabularnewline
Trimmed Mean ( 17 / 24 ) & 87.0921052631579 & 0.71323977421233 & 122.107751715527 \tabularnewline
Trimmed Mean ( 18 / 24 ) & 87.0861111111111 & 0.69829898515116 & 124.711782435513 \tabularnewline
Trimmed Mean ( 19 / 24 ) & 87.0705882352941 & 0.682823766509257 & 127.515462269888 \tabularnewline
Trimmed Mean ( 20 / 24 ) & 87.05 & 0.660766905365127 & 131.740859436503 \tabularnewline
Trimmed Mean ( 21 / 24 ) & 87.0466666666667 & 0.637645333144708 & 136.512669570362 \tabularnewline
Trimmed Mean ( 22 / 24 ) & 87.0392857142857 & 0.61677046071401 & 141.121034904175 \tabularnewline
Trimmed Mean ( 23 / 24 ) & 87.0461538461538 & 0.592471505818719 & 146.920405439359 \tabularnewline
Trimmed Mean ( 24 / 24 ) & 87.0666666666667 & 0.561366947941848 & 155.097600572818 \tabularnewline
Median & 87.55 &  &  \tabularnewline
Midrange & 88.1 &  &  \tabularnewline
Midmean - Weighted Average at Xnp & 86.8972972972973 &  &  \tabularnewline
Midmean - Weighted Average at X(n+1)p & 87.0861111111111 &  &  \tabularnewline
Midmean - Empirical Distribution Function & 86.8972972972973 &  &  \tabularnewline
Midmean - Empirical Distribution Function - Averaging & 87.0861111111111 &  &  \tabularnewline
Midmean - Empirical Distribution Function - Interpolation & 87.0861111111111 &  &  \tabularnewline
Midmean - Closest Observation & 86.8972972972973 &  &  \tabularnewline
Midmean - True Basic - Statistics Graphics Toolkit & 87.0861111111111 &  &  \tabularnewline
Midmean - MS Excel (old versions) & 87.2769230769231 &  &  \tabularnewline
Number of observations & 72 &  &  \tabularnewline
\hline
\end{tabular}
%Source: https://freestatistics.org/blog/index.php?pk=35291&T=1

[TABLE]
[ROW][C]Central Tendency - Ungrouped Data[/C][/ROW]
[ROW][C]Measure[/C][C]Value[/C][C]S.E.[/C][C]Value/S.E.[/C][/ROW]
[ROW][C]Arithmetic Mean[/C][C]86.9736111111111[/C][C]1.24480924284730[/C][C]69.8690274119213[/C][/ROW]
[ROW][C]Geometric Mean[/C][C]86.3349274151293[/C][C][/C][C][/C][/ROW]
[ROW][C]Harmonic Mean[/C][C]85.690677783484[/C][C][/C][C][/C][/ROW]
[ROW][C]Quadratic Mean[/C][C]87.603807470528[/C][C][/C][C][/C][/ROW]
[ROW][C]Winsorized Mean ( 1 / 24 )[/C][C]86.975[/C][C]1.24113562705993[/C][C]70.0769505795523[/C][/ROW]
[ROW][C]Winsorized Mean ( 2 / 24 )[/C][C]86.9722222222222[/C][C]1.22871426340240[/C][C]70.7831143600381[/C][/ROW]
[ROW][C]Winsorized Mean ( 3 / 24 )[/C][C]86.8805555555555[/C][C]1.17351717591312[/C][C]74.0343280344009[/C][/ROW]
[ROW][C]Winsorized Mean ( 4 / 24 )[/C][C]86.8527777777778[/C][C]1.15445820917778[/C][C]75.2325004814472[/C][/ROW]
[ROW][C]Winsorized Mean ( 5 / 24 )[/C][C]86.8319444444444[/C][C]1.13147947380566[/C][C]76.7419528631752[/C][/ROW]
[ROW][C]Winsorized Mean ( 6 / 24 )[/C][C]86.8319444444444[/C][C]1.10940781759767[/C][C]78.2687331629515[/C][/ROW]
[ROW][C]Winsorized Mean ( 7 / 24 )[/C][C]86.7833333333333[/C][C]1.08277161312863[/C][C]80.1492505724044[/C][/ROW]
[ROW][C]Winsorized Mean ( 8 / 24 )[/C][C]86.8055555555556[/C][C]1.05871613144560[/C][C]81.9913411889068[/C][/ROW]
[ROW][C]Winsorized Mean ( 9 / 24 )[/C][C]86.8430555555555[/C][C]1.04311556770737[/C][C]83.2535322489965[/C][/ROW]
[ROW][C]Winsorized Mean ( 10 / 24 )[/C][C]86.8430555555556[/C][C]0.999854892423556[/C][C]86.855658969729[/C][/ROW]
[ROW][C]Winsorized Mean ( 11 / 24 )[/C][C]86.8736111111111[/C][C]0.973926504763362[/C][C]89.1993499367995[/C][/ROW]
[ROW][C]Winsorized Mean ( 12 / 24 )[/C][C]86.6902777777778[/C][C]0.94439943681306[/C][C]91.7940803420213[/C][/ROW]
[ROW][C]Winsorized Mean ( 13 / 24 )[/C][C]86.7083333333333[/C][C]0.894291035065801[/C][C]96.9576233389765[/C][/ROW]
[ROW][C]Winsorized Mean ( 14 / 24 )[/C][C]86.7277777777778[/C][C]0.891018087628589[/C][C]97.3355973149776[/C][/ROW]
[ROW][C]Winsorized Mean ( 15 / 24 )[/C][C]86.9777777777778[/C][C]0.75331614874616[/C][C]115.459860939588[/C][/ROW]
[ROW][C]Winsorized Mean ( 16 / 24 )[/C][C]86.9777777777778[/C][C]0.713631037385869[/C][C]121.880598266003[/C][/ROW]
[ROW][C]Winsorized Mean ( 17 / 24 )[/C][C]87.1430555555555[/C][C]0.689372223515235[/C][C]126.409293242477[/C][/ROW]
[ROW][C]Winsorized Mean ( 18 / 24 )[/C][C]87.2180555555556[/C][C]0.664301339097784[/C][C]131.292909440782[/C][/ROW]
[ROW][C]Winsorized Mean ( 19 / 24 )[/C][C]87.2444444444444[/C][C]0.660608888552183[/C][C]132.066712931539[/C][/ROW]
[ROW][C]Winsorized Mean ( 20 / 24 )[/C][C]87.0777777777778[/C][C]0.628727452086458[/C][C]138.498450304351[/C][/ROW]
[ROW][C]Winsorized Mean ( 21 / 24 )[/C][C]87.1069444444445[/C][C]0.583843929415936[/C][C]149.195598439439[/C][/ROW]
[ROW][C]Winsorized Mean ( 22 / 24 )[/C][C]86.9847222222222[/C][C]0.558515175076888[/C][C]155.742808976045[/C][/ROW]
[ROW][C]Winsorized Mean ( 23 / 24 )[/C][C]86.8888888888889[/C][C]0.536793920831022[/C][C]161.866380219758[/C][/ROW]
[ROW][C]Winsorized Mean ( 24 / 24 )[/C][C]86.7555555555555[/C][C]0.474184453031134[/C][C]182.957401916042[/C][/ROW]
[ROW][C]Trimmed Mean ( 1 / 24 )[/C][C]86.9414285714286[/C][C]1.20261704424228[/C][C]72.2935276758918[/C][/ROW]
[ROW][C]Trimmed Mean ( 2 / 24 )[/C][C]86.9058823529412[/C][C]1.15676026192494[/C][C]75.1286893347484[/C][/ROW]
[ROW][C]Trimmed Mean ( 3 / 24 )[/C][C]86.869696969697[/C][C]1.10996749085507[/C][C]78.263280398218[/C][/ROW]
[ROW][C]Trimmed Mean ( 4 / 24 )[/C][C]86.865625[/C][C]1.07972663985635[/C][C]80.4514974378674[/C][/ROW]
[ROW][C]Trimmed Mean ( 5 / 24 )[/C][C]86.8693548387097[/C][C]1.05034452988680[/C][C]82.7055812325426[/C][/ROW]
[ROW][C]Trimmed Mean ( 6 / 24 )[/C][C]86.8783333333333[/C][C]1.02206197824902[/C][C]85.002999017899[/C][/ROW]
[ROW][C]Trimmed Mean ( 7 / 24 )[/C][C]86.8879310344828[/C][C]0.99386830821424[/C][C]87.4239879834794[/C][/ROW]
[ROW][C]Trimmed Mean ( 8 / 24 )[/C][C]86.9071428571429[/C][C]0.9662783644225[/C][C]89.9400690908394[/C][/ROW]
[ROW][C]Trimmed Mean ( 9 / 24 )[/C][C]86.924074074074[/C][C]0.938146227999457[/C][C]92.6551442406102[/C][/ROW]
[ROW][C]Trimmed Mean ( 10 / 24 )[/C][C]86.9365384615385[/C][C]0.906795315348404[/C][C]95.8722845057224[/C][/ROW]
[ROW][C]Trimmed Mean ( 11 / 24 )[/C][C]86.95[/C][C]0.877758043924104[/C][C]99.0591890349206[/C][/ROW]
[ROW][C]Trimmed Mean ( 12 / 24 )[/C][C]86.9604166666667[/C][C]0.846973855923666[/C][C]102.671901922914[/C][/ROW]
[ROW][C]Trimmed Mean ( 13 / 24 )[/C][C]86.995652173913[/C][C]0.81436354640743[/C][C]106.826554992171[/C][/ROW]
[ROW][C]Trimmed Mean ( 14 / 24 )[/C][C]87.0318181818182[/C][C]0.784157165445271[/C][C]110.987722891493[/C][/ROW]
[ROW][C]Trimmed Mean ( 15 / 24 )[/C][C]87.0690476190476[/C][C]0.745123426666187[/C][C]116.851845617859[/C][/ROW]
[ROW][C]Trimmed Mean ( 16 / 24 )[/C][C]87.08[/C][C]0.727819011032628[/C][C]119.645129736926[/C][/ROW]
[ROW][C]Trimmed Mean ( 17 / 24 )[/C][C]87.0921052631579[/C][C]0.71323977421233[/C][C]122.107751715527[/C][/ROW]
[ROW][C]Trimmed Mean ( 18 / 24 )[/C][C]87.0861111111111[/C][C]0.69829898515116[/C][C]124.711782435513[/C][/ROW]
[ROW][C]Trimmed Mean ( 19 / 24 )[/C][C]87.0705882352941[/C][C]0.682823766509257[/C][C]127.515462269888[/C][/ROW]
[ROW][C]Trimmed Mean ( 20 / 24 )[/C][C]87.05[/C][C]0.660766905365127[/C][C]131.740859436503[/C][/ROW]
[ROW][C]Trimmed Mean ( 21 / 24 )[/C][C]87.0466666666667[/C][C]0.637645333144708[/C][C]136.512669570362[/C][/ROW]
[ROW][C]Trimmed Mean ( 22 / 24 )[/C][C]87.0392857142857[/C][C]0.61677046071401[/C][C]141.121034904175[/C][/ROW]
[ROW][C]Trimmed Mean ( 23 / 24 )[/C][C]87.0461538461538[/C][C]0.592471505818719[/C][C]146.920405439359[/C][/ROW]
[ROW][C]Trimmed Mean ( 24 / 24 )[/C][C]87.0666666666667[/C][C]0.561366947941848[/C][C]155.097600572818[/C][/ROW]
[ROW][C]Median[/C][C]87.55[/C][C][/C][C][/C][/ROW]
[ROW][C]Midrange[/C][C]88.1[/C][C][/C][C][/C][/ROW]
[ROW][C]Midmean - Weighted Average at Xnp[/C][C]86.8972972972973[/C][C][/C][C][/C][/ROW]
[ROW][C]Midmean - Weighted Average at X(n+1)p[/C][C]87.0861111111111[/C][C][/C][C][/C][/ROW]
[ROW][C]Midmean - Empirical Distribution Function[/C][C]86.8972972972973[/C][C][/C][C][/C][/ROW]
[ROW][C]Midmean - Empirical Distribution Function - Averaging[/C][C]87.0861111111111[/C][C][/C][C][/C][/ROW]
[ROW][C]Midmean - Empirical Distribution Function - Interpolation[/C][C]87.0861111111111[/C][C][/C][C][/C][/ROW]
[ROW][C]Midmean - Closest Observation[/C][C]86.8972972972973[/C][C][/C][C][/C][/ROW]
[ROW][C]Midmean - True Basic - Statistics Graphics Toolkit[/C][C]87.0861111111111[/C][C][/C][C][/C][/ROW]
[ROW][C]Midmean - MS Excel (old versions)[/C][C]87.2769230769231[/C][C][/C][C][/C][/ROW]
[ROW][C]Number of observations[/C][C]72[/C][C][/C][C][/C][/ROW]
[/TABLE]
Source: https://freestatistics.org/blog/index.php?pk=35291&T=1

Globally Unique Identifier (entire table): ba.freestatistics.org/blog/index.php?pk=35291&T=1

As an alternative you can also use a QR Code:  

The GUIDs for individual cells are displayed in the table below:

Central Tendency - Ungrouped Data
MeasureValueS.E.Value/S.E.
Arithmetic Mean86.97361111111111.2448092428473069.8690274119213
Geometric Mean86.3349274151293
Harmonic Mean85.690677783484
Quadratic Mean87.603807470528
Winsorized Mean ( 1 / 24 )86.9751.2411356270599370.0769505795523
Winsorized Mean ( 2 / 24 )86.97222222222221.2287142634024070.7831143600381
Winsorized Mean ( 3 / 24 )86.88055555555551.1735171759131274.0343280344009
Winsorized Mean ( 4 / 24 )86.85277777777781.1544582091777875.2325004814472
Winsorized Mean ( 5 / 24 )86.83194444444441.1314794738056676.7419528631752
Winsorized Mean ( 6 / 24 )86.83194444444441.1094078175976778.2687331629515
Winsorized Mean ( 7 / 24 )86.78333333333331.0827716131286380.1492505724044
Winsorized Mean ( 8 / 24 )86.80555555555561.0587161314456081.9913411889068
Winsorized Mean ( 9 / 24 )86.84305555555551.0431155677073783.2535322489965
Winsorized Mean ( 10 / 24 )86.84305555555560.99985489242355686.855658969729
Winsorized Mean ( 11 / 24 )86.87361111111110.97392650476336289.1993499367995
Winsorized Mean ( 12 / 24 )86.69027777777780.9443994368130691.7940803420213
Winsorized Mean ( 13 / 24 )86.70833333333330.89429103506580196.9576233389765
Winsorized Mean ( 14 / 24 )86.72777777777780.89101808762858997.3355973149776
Winsorized Mean ( 15 / 24 )86.97777777777780.75331614874616115.459860939588
Winsorized Mean ( 16 / 24 )86.97777777777780.713631037385869121.880598266003
Winsorized Mean ( 17 / 24 )87.14305555555550.689372223515235126.409293242477
Winsorized Mean ( 18 / 24 )87.21805555555560.664301339097784131.292909440782
Winsorized Mean ( 19 / 24 )87.24444444444440.660608888552183132.066712931539
Winsorized Mean ( 20 / 24 )87.07777777777780.628727452086458138.498450304351
Winsorized Mean ( 21 / 24 )87.10694444444450.583843929415936149.195598439439
Winsorized Mean ( 22 / 24 )86.98472222222220.558515175076888155.742808976045
Winsorized Mean ( 23 / 24 )86.88888888888890.536793920831022161.866380219758
Winsorized Mean ( 24 / 24 )86.75555555555550.474184453031134182.957401916042
Trimmed Mean ( 1 / 24 )86.94142857142861.2026170442422872.2935276758918
Trimmed Mean ( 2 / 24 )86.90588235294121.1567602619249475.1286893347484
Trimmed Mean ( 3 / 24 )86.8696969696971.1099674908550778.263280398218
Trimmed Mean ( 4 / 24 )86.8656251.0797266398563580.4514974378674
Trimmed Mean ( 5 / 24 )86.86935483870971.0503445298868082.7055812325426
Trimmed Mean ( 6 / 24 )86.87833333333331.0220619782490285.002999017899
Trimmed Mean ( 7 / 24 )86.88793103448280.9938683082142487.4239879834794
Trimmed Mean ( 8 / 24 )86.90714285714290.966278364422589.9400690908394
Trimmed Mean ( 9 / 24 )86.9240740740740.93814622799945792.6551442406102
Trimmed Mean ( 10 / 24 )86.93653846153850.90679531534840495.8722845057224
Trimmed Mean ( 11 / 24 )86.950.87775804392410499.0591890349206
Trimmed Mean ( 12 / 24 )86.96041666666670.846973855923666102.671901922914
Trimmed Mean ( 13 / 24 )86.9956521739130.81436354640743106.826554992171
Trimmed Mean ( 14 / 24 )87.03181818181820.784157165445271110.987722891493
Trimmed Mean ( 15 / 24 )87.06904761904760.745123426666187116.851845617859
Trimmed Mean ( 16 / 24 )87.080.727819011032628119.645129736926
Trimmed Mean ( 17 / 24 )87.09210526315790.71323977421233122.107751715527
Trimmed Mean ( 18 / 24 )87.08611111111110.69829898515116124.711782435513
Trimmed Mean ( 19 / 24 )87.07058823529410.682823766509257127.515462269888
Trimmed Mean ( 20 / 24 )87.050.660766905365127131.740859436503
Trimmed Mean ( 21 / 24 )87.04666666666670.637645333144708136.512669570362
Trimmed Mean ( 22 / 24 )87.03928571428570.61677046071401141.121034904175
Trimmed Mean ( 23 / 24 )87.04615384615380.592471505818719146.920405439359
Trimmed Mean ( 24 / 24 )87.06666666666670.561366947941848155.097600572818
Median87.55
Midrange88.1
Midmean - Weighted Average at Xnp86.8972972972973
Midmean - Weighted Average at X(n+1)p87.0861111111111
Midmean - Empirical Distribution Function86.8972972972973
Midmean - Empirical Distribution Function - Averaging87.0861111111111
Midmean - Empirical Distribution Function - Interpolation87.0861111111111
Midmean - Closest Observation86.8972972972973
Midmean - True Basic - Statistics Graphics Toolkit87.0861111111111
Midmean - MS Excel (old versions)87.2769230769231
Number of observations72


Parameters (Session):
Parameters (R input):
R code (references can be found in the software module):
geomean <- function(x) {
return(exp(mean(log(x))))
}
harmean <- function(x) {
return(1/mean(1/x))
}
quamean <- function(x) {
return(sqrt(mean(x*x)))
}
winmean <- function(x) {
x <-sort(x[!is.na(x)])
n<-length(x)
denom <- 3
nodenom <- n/denom
if (nodenom>40) denom <- n/40
sqrtn = sqrt(n)
roundnodenom = floor(nodenom)
win <- array(NA,dim=c(roundnodenom,2))
for (j in 1:roundnodenom) {
win[j,1] <- (j*x[j+1]+sum(x[(j+1):(n-j)])+j*x[n-j])/n
win[j,2] <- sd(c(rep(x[j+1],j),x[(j+1):(n-j)],rep(x[n-j],j)))/sqrtn
}
return(win)
}
trimean <- function(x) {
x <-sort(x[!is.na(x)])
n<-length(x)
denom <- 3
nodenom <- n/denom
if (nodenom>40) denom <- n/40
sqrtn = sqrt(n)
roundnodenom = floor(nodenom)
tri <- array(NA,dim=c(roundnodenom,2))
for (j in 1:roundnodenom) {
tri[j,1] <- mean(x,trim=j/n)
tri[j,2] <- sd(x[(j+1):(n-j)]) / sqrt(n-j*2)
}
return(tri)
}
midrange <- function(x) {
return((max(x)+min(x))/2)
}
q1 <- function(data,n,p,i,f) {
np <- n*p;
i <<- floor(np)
f <<- np - i
qvalue <- (1-f)*data[i] + f*data[i+1]
}
q2 <- function(data,n,p,i,f) {
np <- (n+1)*p
i <<- floor(np)
f <<- np - i
qvalue <- (1-f)*data[i] + f*data[i+1]
}
q3 <- function(data,n,p,i,f) {
np <- n*p
i <<- floor(np)
f <<- np - i
if (f==0) {
qvalue <- data[i]
} else {
qvalue <- data[i+1]
}
}
q4 <- function(data,n,p,i,f) {
np <- n*p
i <<- floor(np)
f <<- np - i
if (f==0) {
qvalue <- (data[i]+data[i+1])/2
} else {
qvalue <- data[i+1]
}
}
q5 <- function(data,n,p,i,f) {
np <- (n-1)*p
i <<- floor(np)
f <<- np - i
if (f==0) {
qvalue <- data[i+1]
} else {
qvalue <- data[i+1] + f*(data[i+2]-data[i+1])
}
}
q6 <- function(data,n,p,i,f) {
np <- n*p+0.5
i <<- floor(np)
f <<- np - i
qvalue <- data[i]
}
q7 <- function(data,n,p,i,f) {
np <- (n+1)*p
i <<- floor(np)
f <<- np - i
if (f==0) {
qvalue <- data[i]
} else {
qvalue <- f*data[i] + (1-f)*data[i+1]
}
}
q8 <- function(data,n,p,i,f) {
np <- (n+1)*p
i <<- floor(np)
f <<- np - i
if (f==0) {
qvalue <- data[i]
} else {
if (f == 0.5) {
qvalue <- (data[i]+data[i+1])/2
} else {
if (f < 0.5) {
qvalue <- data[i]
} else {
qvalue <- data[i+1]
}
}
}
}
midmean <- function(x,def) {
x <-sort(x[!is.na(x)])
n<-length(x)
if (def==1) {
qvalue1 <- q1(x,n,0.25,i,f)
qvalue3 <- q1(x,n,0.75,i,f)
}
if (def==2) {
qvalue1 <- q2(x,n,0.25,i,f)
qvalue3 <- q2(x,n,0.75,i,f)
}
if (def==3) {
qvalue1 <- q3(x,n,0.25,i,f)
qvalue3 <- q3(x,n,0.75,i,f)
}
if (def==4) {
qvalue1 <- q4(x,n,0.25,i,f)
qvalue3 <- q4(x,n,0.75,i,f)
}
if (def==5) {
qvalue1 <- q5(x,n,0.25,i,f)
qvalue3 <- q5(x,n,0.75,i,f)
}
if (def==6) {
qvalue1 <- q6(x,n,0.25,i,f)
qvalue3 <- q6(x,n,0.75,i,f)
}
if (def==7) {
qvalue1 <- q7(x,n,0.25,i,f)
qvalue3 <- q7(x,n,0.75,i,f)
}
if (def==8) {
qvalue1 <- q8(x,n,0.25,i,f)
qvalue3 <- q8(x,n,0.75,i,f)
}
midm <- 0
myn <- 0
roundno4 <- round(n/4)
round3no4 <- round(3*n/4)
for (i in 1:n) {
if ((x[i]>=qvalue1) & (x[i]<=qvalue3)){
midm = midm + x[i]
myn = myn + 1
}
}
midm = midm / myn
return(midm)
}
(arm <- mean(x))
sqrtn <- sqrt(length(x))
(armse <- sd(x) / sqrtn)
(armose <- arm / armse)
(geo <- geomean(x))
(har <- harmean(x))
(qua <- quamean(x))
(win <- winmean(x))
(tri <- trimean(x))
(midr <- midrange(x))
midm <- array(NA,dim=8)
for (j in 1:8) midm[j] <- midmean(x,j)
midm
bitmap(file='test1.png')
lb <- win[,1] - 2*win[,2]
ub <- win[,1] + 2*win[,2]
if ((ylimmin == '') | (ylimmax == '')) plot(win[,1],type='b',main=main, xlab='j', pch=19, ylab='Winsorized Mean(j/n)', ylim=c(min(lb),max(ub))) else plot(win[,1],type='l',main=main, xlab='j', pch=19, ylab='Winsorized Mean(j/n)', ylim=c(ylimmin,ylimmax))
lines(ub,lty=3)
lines(lb,lty=3)
grid()
dev.off()
bitmap(file='test2.png')
lb <- tri[,1] - 2*tri[,2]
ub <- tri[,1] + 2*tri[,2]
if ((ylimmin == '') | (ylimmax == '')) plot(tri[,1],type='b',main=main, xlab='j', pch=19, ylab='Trimmed Mean(j/n)', ylim=c(min(lb),max(ub))) else plot(tri[,1],type='l',main=main, xlab='j', pch=19, ylab='Trimmed Mean(j/n)', ylim=c(ylimmin,ylimmax))
lines(ub,lty=3)
lines(lb,lty=3)
grid()
dev.off()
load(file='createtable')
a<-table.start()
a<-table.row.start(a)
a<-table.element(a,'Central Tendency - Ungrouped Data',4,TRUE)
a<-table.row.end(a)
a<-table.row.start(a)
a<-table.element(a,'Measure',header=TRUE)
a<-table.element(a,'Value',header=TRUE)
a<-table.element(a,'S.E.',header=TRUE)
a<-table.element(a,'Value/S.E.',header=TRUE)
a<-table.row.end(a)
a<-table.row.start(a)
a<-table.element(a,hyperlink('arithmetic_mean.htm', 'Arithmetic Mean', 'click to view the definition of the Arithmetic Mean'),header=TRUE)
a<-table.element(a,arm)
a<-table.element(a,hyperlink('arithmetic_mean_standard_error.htm', armse, 'click to view the definition of the Standard Error of the Arithmetic Mean'))
a<-table.element(a,armose)
a<-table.row.end(a)
a<-table.row.start(a)
a<-table.element(a,hyperlink('geometric_mean.htm', 'Geometric Mean', 'click to view the definition of the Geometric Mean'),header=TRUE)
a<-table.element(a,geo)
a<-table.element(a,'')
a<-table.row.end(a)
a<-table.row.start(a)
a<-table.element(a,hyperlink('harmonic_mean.htm', 'Harmonic Mean', 'click to view the definition of the Harmonic Mean'),header=TRUE)
a<-table.element(a,har)
a<-table.element(a,'')
a<-table.row.end(a)
a<-table.row.start(a)
a<-table.element(a,hyperlink('quadratic_mean.htm', 'Quadratic Mean', 'click to view the definition of the Quadratic Mean'),header=TRUE)
a<-table.element(a,qua)
a<-table.element(a,'')
a<-table.row.end(a)
for (j in 1:length(win[,1])) {
a<-table.row.start(a)
mylabel <- paste('Winsorized Mean (',j)
mylabel <- paste(mylabel,'/')
mylabel <- paste(mylabel,length(win[,1]))
mylabel <- paste(mylabel,')')
a<-table.element(a,hyperlink('winsorized_mean.htm', mylabel, 'click to view the definition of the Winsorized Mean'),header=TRUE)
a<-table.element(a,win[j,1])
a<-table.element(a,win[j,2])
a<-table.element(a,win[j,1]/win[j,2])
a<-table.row.end(a)
}
for (j in 1:length(tri[,1])) {
a<-table.row.start(a)
mylabel <- paste('Trimmed Mean (',j)
mylabel <- paste(mylabel,'/')
mylabel <- paste(mylabel,length(tri[,1]))
mylabel <- paste(mylabel,')')
a<-table.element(a,hyperlink('arithmetic_mean.htm', mylabel, 'click to view the definition of the Trimmed Mean'),header=TRUE)
a<-table.element(a,tri[j,1])
a<-table.element(a,tri[j,2])
a<-table.element(a,tri[j,1]/tri[j,2])
a<-table.row.end(a)
}
a<-table.row.start(a)
a<-table.element(a,hyperlink('median_1.htm', 'Median', 'click to view the definition of the Median'),header=TRUE)
a<-table.element(a,median(x))
a<-table.element(a,'')
a<-table.row.end(a)
a<-table.row.start(a)
a<-table.element(a,hyperlink('midrange.htm', 'Midrange', 'click to view the definition of the Midrange'),header=TRUE)
a<-table.element(a,midr)
a<-table.element(a,'')
a<-table.row.end(a)
a<-table.row.start(a)
mymid <- hyperlink('midmean.htm', 'Midmean', 'click to view the definition of the Midmean')
mylabel <- paste(mymid,hyperlink('method_1.htm','Weighted Average at Xnp',''),sep=' - ')
a<-table.element(a,mylabel,header=TRUE)
a<-table.element(a,midm[1])
a<-table.element(a,'')
a<-table.row.end(a)
a<-table.row.start(a)
mymid <- hyperlink('midmean.htm', 'Midmean', 'click to view the definition of the Midmean')
mylabel <- paste(mymid,hyperlink('method_2.htm','Weighted Average at X(n+1)p',''),sep=' - ')
a<-table.element(a,mylabel,header=TRUE)
a<-table.element(a,midm[2])
a<-table.element(a,'')
a<-table.row.end(a)
a<-table.row.start(a)
mymid <- hyperlink('midmean.htm', 'Midmean', 'click to view the definition of the Midmean')
mylabel <- paste(mymid,hyperlink('method_3.htm','Empirical Distribution Function',''),sep=' - ')
a<-table.element(a,mylabel,header=TRUE)
a<-table.element(a,midm[3])
a<-table.element(a,'')
a<-table.row.end(a)
a<-table.row.start(a)
mymid <- hyperlink('midmean.htm', 'Midmean', 'click to view the definition of the Midmean')
mylabel <- paste(mymid,hyperlink('method_4.htm','Empirical Distribution Function - Averaging',''),sep=' - ')
a<-table.element(a,mylabel,header=TRUE)
a<-table.element(a,midm[4])
a<-table.element(a,'')
a<-table.row.end(a)
a<-table.row.start(a)
mymid <- hyperlink('midmean.htm', 'Midmean', 'click to view the definition of the Midmean')
mylabel <- paste(mymid,hyperlink('method_5.htm','Empirical Distribution Function - Interpolation',''),sep=' - ')
a<-table.element(a,mylabel,header=TRUE)
a<-table.element(a,midm[5])
a<-table.element(a,'')
a<-table.row.end(a)
a<-table.row.start(a)
mymid <- hyperlink('midmean.htm', 'Midmean', 'click to view the definition of the Midmean')
mylabel <- paste(mymid,hyperlink('method_6.htm','Closest Observation',''),sep=' - ')
a<-table.element(a,mylabel,header=TRUE)
a<-table.element(a,midm[6])
a<-table.element(a,'')
a<-table.row.end(a)
a<-table.row.start(a)
mymid <- hyperlink('midmean.htm', 'Midmean', 'click to view the definition of the Midmean')
mylabel <- paste(mymid,hyperlink('method_7.htm','True Basic - Statistics Graphics Toolkit',''),sep=' - ')
a<-table.element(a,mylabel,header=TRUE)
a<-table.element(a,midm[7])
a<-table.element(a,'')
a<-table.row.end(a)
a<-table.row.start(a)
mymid <- hyperlink('midmean.htm', 'Midmean', 'click to view the definition of the Midmean')
mylabel <- paste(mymid,hyperlink('method_8.htm','MS Excel (old versions)',''),sep=' - ')
a<-table.element(a,mylabel,header=TRUE)
a<-table.element(a,midm[8])
a<-table.element(a,'')
a<-table.row.end(a)
a<-table.row.start(a)
a<-table.element(a,'Number of observations',header=TRUE)
a<-table.element(a,length(x))
a<-table.element(a,'')
a<-table.row.end(a)
a<-table.end(a)
table.save(a,file='mytable.tab')