Free Statistics

of Irreproducible Research!

Author's title

Author*The author of this computation has been verified*
R Software Modulerwasp_autocorrelation.wasp
Title produced by software(Partial) Autocorrelation Function
Date of computationFri, 19 Dec 2008 19:26:02 -0700
Cite this page as followsStatistical Computations at FreeStatistics.org, Office for Research Development and Education, URL https://freestatistics.org/blog/index.php?v=date/2008/Dec/20/t1229740141qvzou5x94x32el4.htm/, Retrieved Wed, 22 May 2024 08:22:06 +0000
Statistical Computations at FreeStatistics.org, Office for Research Development and Education, URL https://freestatistics.org/blog/index.php?pk=35288, Retrieved Wed, 22 May 2024 08:22:06 +0000
QR Codes:

Original text written by user:
IsPrivate?No (this computation is public)
User-defined keywords
Estimated Impact208
Family? (F = Feedback message, R = changed R code, M = changed R Module, P = changed Parameters, D = changed Data)
-     [Multiple Regression] [Werkloosheid- Azië] [2008-12-17 14:33:28] [5e74953d94072114d25d7276793b561e]
- RMPD    [(Partial) Autocorrelation Function] [] [2008-12-20 02:26:02] [5925747fb2a6bb4cfcd8015825ee5e92] [Current]
Feedback Forum

Post a new message
Dataseries X:
99.2
93.6
104.2
95.3
102.7
103.1
100
107.2
107
119
110.4
101.7
102.4
98.8
105.6
104.4
106.3
107.2
108.5
106.9
114.2
125.9
110.6
110.5
106.7
104.7
107.4
109.8
103.4
114.8
114.3
109.6
118.3
127.3
112.3
114.9
108.2
105.4
122.1
113.5
110
125.3
114.3
115.6
127.1
123
122.2
126.4
112.7
105.8
120.9
116.3
115.7
127.9
108.3
121.1
128.6
123.1
127.7
126.6
118.4
110
129.6
115.8
125.9
128.4
114
125.6
128.5
136.6
133.1
124.6


Summary of computational transaction
Raw Inputview raw input (R code)
Raw Outputview raw output of R engine
Computing time2 seconds
R Server'Sir Ronald Aylmer Fisher' @ 193.190.124.24

\begin{tabular}{lllllllll}
\hline
Summary of computational transaction \tabularnewline
Raw Input & view raw input (R code)  \tabularnewline
Raw Output & view raw output of R engine  \tabularnewline
Computing time & 2 seconds \tabularnewline
R Server & 'Sir Ronald Aylmer Fisher' @ 193.190.124.24 \tabularnewline
\hline
\end{tabular}
%Source: https://freestatistics.org/blog/index.php?pk=35288&T=0

[TABLE]
[ROW][C]Summary of computational transaction[/C][/ROW]
[ROW][C]Raw Input[/C][C]view raw input (R code) [/C][/ROW]
[ROW][C]Raw Output[/C][C]view raw output of R engine [/C][/ROW]
[ROW][C]Computing time[/C][C]2 seconds[/C][/ROW]
[ROW][C]R Server[/C][C]'Sir Ronald Aylmer Fisher' @ 193.190.124.24[/C][/ROW]
[/TABLE]
Source: https://freestatistics.org/blog/index.php?pk=35288&T=0

Globally Unique Identifier (entire table): ba.freestatistics.org/blog/index.php?pk=35288&T=0

As an alternative you can also use a QR Code:  

The GUIDs for individual cells are displayed in the table below:

Summary of computational transaction
Raw Inputview raw input (R code)
Raw Outputview raw output of R engine
Computing time2 seconds
R Server'Sir Ronald Aylmer Fisher' @ 193.190.124.24


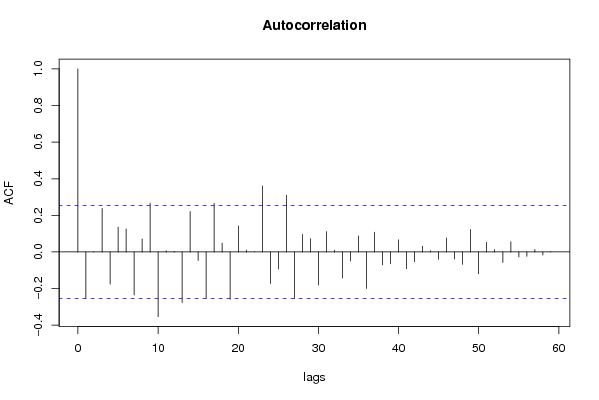
Autocorrelation Function
Time lag kACF(k)T-STATP-value
1-0.254583-1.9720.026613
2-0.000801-0.00620.497536
30.237271.83790.035516
4-0.176-1.36330.088943
50.1347421.04370.150403
60.1256070.97290.167243
7-0.234871-1.81930.036928
80.0709070.54920.292439
90.2669052.06740.021507
10-0.353542-2.73850.004056
110.0064690.05010.4801
120.0032230.0250.490081
13-0.275709-2.13560.0184
140.2208221.71050.046172
15-0.047357-0.36680.35752
16-0.255007-1.97530.026421
170.2658142.0590.021922
180.0472430.36590.357847
19-0.258656-2.00350.024821
200.1418791.0990.138082
210.0100470.07780.469115
22-0.000482-0.00370.498518
230.3602692.79060.003521
24-0.172728-1.33790.092981
25-0.093754-0.72620.235265
260.3101212.40220.009705
27-0.254472-1.97110.026663
280.0950510.73630.23222
290.0720510.55810.289424
30-0.180848-1.40080.083206
310.1113570.86260.195904
320.0096010.07440.470483
33-0.142076-1.10050.137751
34-0.050089-0.3880.3497
350.087470.67750.250333
36-0.199486-1.54520.063776
370.1075520.83310.204047
38-0.070431-0.54560.293697
39-0.065123-0.50440.307899
400.0660050.51130.305519
41-0.091374-0.70780.240912
42-0.054052-0.41870.33847
430.0309250.23950.405749
440.0060430.04680.481411
45-0.039615-0.30690.380008
460.0759550.58830.279255
47-0.039081-0.30270.381574
48-0.067721-0.52460.30091
490.1229440.95230.172378
50-0.119406-0.92490.179357
510.0532320.41230.340781
520.0130020.10070.460056
53-0.05795-0.44890.327567
540.0551790.42740.335304
55-0.027886-0.2160.414858
56-0.023362-0.1810.428504
570.0138860.10760.457351
58-0.016356-0.12670.449803
590.0012450.00960.496167
60NANANA

\begin{tabular}{lllllllll}
\hline
Autocorrelation Function \tabularnewline
Time lag k & ACF(k) & T-STAT & P-value \tabularnewline
1 & -0.254583 & -1.972 & 0.026613 \tabularnewline
2 & -0.000801 & -0.0062 & 0.497536 \tabularnewline
3 & 0.23727 & 1.8379 & 0.035516 \tabularnewline
4 & -0.176 & -1.3633 & 0.088943 \tabularnewline
5 & 0.134742 & 1.0437 & 0.150403 \tabularnewline
6 & 0.125607 & 0.9729 & 0.167243 \tabularnewline
7 & -0.234871 & -1.8193 & 0.036928 \tabularnewline
8 & 0.070907 & 0.5492 & 0.292439 \tabularnewline
9 & 0.266905 & 2.0674 & 0.021507 \tabularnewline
10 & -0.353542 & -2.7385 & 0.004056 \tabularnewline
11 & 0.006469 & 0.0501 & 0.4801 \tabularnewline
12 & 0.003223 & 0.025 & 0.490081 \tabularnewline
13 & -0.275709 & -2.1356 & 0.0184 \tabularnewline
14 & 0.220822 & 1.7105 & 0.046172 \tabularnewline
15 & -0.047357 & -0.3668 & 0.35752 \tabularnewline
16 & -0.255007 & -1.9753 & 0.026421 \tabularnewline
17 & 0.265814 & 2.059 & 0.021922 \tabularnewline
18 & 0.047243 & 0.3659 & 0.357847 \tabularnewline
19 & -0.258656 & -2.0035 & 0.024821 \tabularnewline
20 & 0.141879 & 1.099 & 0.138082 \tabularnewline
21 & 0.010047 & 0.0778 & 0.469115 \tabularnewline
22 & -0.000482 & -0.0037 & 0.498518 \tabularnewline
23 & 0.360269 & 2.7906 & 0.003521 \tabularnewline
24 & -0.172728 & -1.3379 & 0.092981 \tabularnewline
25 & -0.093754 & -0.7262 & 0.235265 \tabularnewline
26 & 0.310121 & 2.4022 & 0.009705 \tabularnewline
27 & -0.254472 & -1.9711 & 0.026663 \tabularnewline
28 & 0.095051 & 0.7363 & 0.23222 \tabularnewline
29 & 0.072051 & 0.5581 & 0.289424 \tabularnewline
30 & -0.180848 & -1.4008 & 0.083206 \tabularnewline
31 & 0.111357 & 0.8626 & 0.195904 \tabularnewline
32 & 0.009601 & 0.0744 & 0.470483 \tabularnewline
33 & -0.142076 & -1.1005 & 0.137751 \tabularnewline
34 & -0.050089 & -0.388 & 0.3497 \tabularnewline
35 & 0.08747 & 0.6775 & 0.250333 \tabularnewline
36 & -0.199486 & -1.5452 & 0.063776 \tabularnewline
37 & 0.107552 & 0.8331 & 0.204047 \tabularnewline
38 & -0.070431 & -0.5456 & 0.293697 \tabularnewline
39 & -0.065123 & -0.5044 & 0.307899 \tabularnewline
40 & 0.066005 & 0.5113 & 0.305519 \tabularnewline
41 & -0.091374 & -0.7078 & 0.240912 \tabularnewline
42 & -0.054052 & -0.4187 & 0.33847 \tabularnewline
43 & 0.030925 & 0.2395 & 0.405749 \tabularnewline
44 & 0.006043 & 0.0468 & 0.481411 \tabularnewline
45 & -0.039615 & -0.3069 & 0.380008 \tabularnewline
46 & 0.075955 & 0.5883 & 0.279255 \tabularnewline
47 & -0.039081 & -0.3027 & 0.381574 \tabularnewline
48 & -0.067721 & -0.5246 & 0.30091 \tabularnewline
49 & 0.122944 & 0.9523 & 0.172378 \tabularnewline
50 & -0.119406 & -0.9249 & 0.179357 \tabularnewline
51 & 0.053232 & 0.4123 & 0.340781 \tabularnewline
52 & 0.013002 & 0.1007 & 0.460056 \tabularnewline
53 & -0.05795 & -0.4489 & 0.327567 \tabularnewline
54 & 0.055179 & 0.4274 & 0.335304 \tabularnewline
55 & -0.027886 & -0.216 & 0.414858 \tabularnewline
56 & -0.023362 & -0.181 & 0.428504 \tabularnewline
57 & 0.013886 & 0.1076 & 0.457351 \tabularnewline
58 & -0.016356 & -0.1267 & 0.449803 \tabularnewline
59 & 0.001245 & 0.0096 & 0.496167 \tabularnewline
60 & NA & NA & NA \tabularnewline
\hline
\end{tabular}
%Source: https://freestatistics.org/blog/index.php?pk=35288&T=1

[TABLE]
[ROW][C]Autocorrelation Function[/C][/ROW]
[ROW][C]Time lag k[/C][C]ACF(k)[/C][C]T-STAT[/C][C]P-value[/C][/ROW]
[ROW][C]1[/C][C]-0.254583[/C][C]-1.972[/C][C]0.026613[/C][/ROW]
[ROW][C]2[/C][C]-0.000801[/C][C]-0.0062[/C][C]0.497536[/C][/ROW]
[ROW][C]3[/C][C]0.23727[/C][C]1.8379[/C][C]0.035516[/C][/ROW]
[ROW][C]4[/C][C]-0.176[/C][C]-1.3633[/C][C]0.088943[/C][/ROW]
[ROW][C]5[/C][C]0.134742[/C][C]1.0437[/C][C]0.150403[/C][/ROW]
[ROW][C]6[/C][C]0.125607[/C][C]0.9729[/C][C]0.167243[/C][/ROW]
[ROW][C]7[/C][C]-0.234871[/C][C]-1.8193[/C][C]0.036928[/C][/ROW]
[ROW][C]8[/C][C]0.070907[/C][C]0.5492[/C][C]0.292439[/C][/ROW]
[ROW][C]9[/C][C]0.266905[/C][C]2.0674[/C][C]0.021507[/C][/ROW]
[ROW][C]10[/C][C]-0.353542[/C][C]-2.7385[/C][C]0.004056[/C][/ROW]
[ROW][C]11[/C][C]0.006469[/C][C]0.0501[/C][C]0.4801[/C][/ROW]
[ROW][C]12[/C][C]0.003223[/C][C]0.025[/C][C]0.490081[/C][/ROW]
[ROW][C]13[/C][C]-0.275709[/C][C]-2.1356[/C][C]0.0184[/C][/ROW]
[ROW][C]14[/C][C]0.220822[/C][C]1.7105[/C][C]0.046172[/C][/ROW]
[ROW][C]15[/C][C]-0.047357[/C][C]-0.3668[/C][C]0.35752[/C][/ROW]
[ROW][C]16[/C][C]-0.255007[/C][C]-1.9753[/C][C]0.026421[/C][/ROW]
[ROW][C]17[/C][C]0.265814[/C][C]2.059[/C][C]0.021922[/C][/ROW]
[ROW][C]18[/C][C]0.047243[/C][C]0.3659[/C][C]0.357847[/C][/ROW]
[ROW][C]19[/C][C]-0.258656[/C][C]-2.0035[/C][C]0.024821[/C][/ROW]
[ROW][C]20[/C][C]0.141879[/C][C]1.099[/C][C]0.138082[/C][/ROW]
[ROW][C]21[/C][C]0.010047[/C][C]0.0778[/C][C]0.469115[/C][/ROW]
[ROW][C]22[/C][C]-0.000482[/C][C]-0.0037[/C][C]0.498518[/C][/ROW]
[ROW][C]23[/C][C]0.360269[/C][C]2.7906[/C][C]0.003521[/C][/ROW]
[ROW][C]24[/C][C]-0.172728[/C][C]-1.3379[/C][C]0.092981[/C][/ROW]
[ROW][C]25[/C][C]-0.093754[/C][C]-0.7262[/C][C]0.235265[/C][/ROW]
[ROW][C]26[/C][C]0.310121[/C][C]2.4022[/C][C]0.009705[/C][/ROW]
[ROW][C]27[/C][C]-0.254472[/C][C]-1.9711[/C][C]0.026663[/C][/ROW]
[ROW][C]28[/C][C]0.095051[/C][C]0.7363[/C][C]0.23222[/C][/ROW]
[ROW][C]29[/C][C]0.072051[/C][C]0.5581[/C][C]0.289424[/C][/ROW]
[ROW][C]30[/C][C]-0.180848[/C][C]-1.4008[/C][C]0.083206[/C][/ROW]
[ROW][C]31[/C][C]0.111357[/C][C]0.8626[/C][C]0.195904[/C][/ROW]
[ROW][C]32[/C][C]0.009601[/C][C]0.0744[/C][C]0.470483[/C][/ROW]
[ROW][C]33[/C][C]-0.142076[/C][C]-1.1005[/C][C]0.137751[/C][/ROW]
[ROW][C]34[/C][C]-0.050089[/C][C]-0.388[/C][C]0.3497[/C][/ROW]
[ROW][C]35[/C][C]0.08747[/C][C]0.6775[/C][C]0.250333[/C][/ROW]
[ROW][C]36[/C][C]-0.199486[/C][C]-1.5452[/C][C]0.063776[/C][/ROW]
[ROW][C]37[/C][C]0.107552[/C][C]0.8331[/C][C]0.204047[/C][/ROW]
[ROW][C]38[/C][C]-0.070431[/C][C]-0.5456[/C][C]0.293697[/C][/ROW]
[ROW][C]39[/C][C]-0.065123[/C][C]-0.5044[/C][C]0.307899[/C][/ROW]
[ROW][C]40[/C][C]0.066005[/C][C]0.5113[/C][C]0.305519[/C][/ROW]
[ROW][C]41[/C][C]-0.091374[/C][C]-0.7078[/C][C]0.240912[/C][/ROW]
[ROW][C]42[/C][C]-0.054052[/C][C]-0.4187[/C][C]0.33847[/C][/ROW]
[ROW][C]43[/C][C]0.030925[/C][C]0.2395[/C][C]0.405749[/C][/ROW]
[ROW][C]44[/C][C]0.006043[/C][C]0.0468[/C][C]0.481411[/C][/ROW]
[ROW][C]45[/C][C]-0.039615[/C][C]-0.3069[/C][C]0.380008[/C][/ROW]
[ROW][C]46[/C][C]0.075955[/C][C]0.5883[/C][C]0.279255[/C][/ROW]
[ROW][C]47[/C][C]-0.039081[/C][C]-0.3027[/C][C]0.381574[/C][/ROW]
[ROW][C]48[/C][C]-0.067721[/C][C]-0.5246[/C][C]0.30091[/C][/ROW]
[ROW][C]49[/C][C]0.122944[/C][C]0.9523[/C][C]0.172378[/C][/ROW]
[ROW][C]50[/C][C]-0.119406[/C][C]-0.9249[/C][C]0.179357[/C][/ROW]
[ROW][C]51[/C][C]0.053232[/C][C]0.4123[/C][C]0.340781[/C][/ROW]
[ROW][C]52[/C][C]0.013002[/C][C]0.1007[/C][C]0.460056[/C][/ROW]
[ROW][C]53[/C][C]-0.05795[/C][C]-0.4489[/C][C]0.327567[/C][/ROW]
[ROW][C]54[/C][C]0.055179[/C][C]0.4274[/C][C]0.335304[/C][/ROW]
[ROW][C]55[/C][C]-0.027886[/C][C]-0.216[/C][C]0.414858[/C][/ROW]
[ROW][C]56[/C][C]-0.023362[/C][C]-0.181[/C][C]0.428504[/C][/ROW]
[ROW][C]57[/C][C]0.013886[/C][C]0.1076[/C][C]0.457351[/C][/ROW]
[ROW][C]58[/C][C]-0.016356[/C][C]-0.1267[/C][C]0.449803[/C][/ROW]
[ROW][C]59[/C][C]0.001245[/C][C]0.0096[/C][C]0.496167[/C][/ROW]
[ROW][C]60[/C][C]NA[/C][C]NA[/C][C]NA[/C][/ROW]
[/TABLE]
Source: https://freestatistics.org/blog/index.php?pk=35288&T=1

Globally Unique Identifier (entire table): ba.freestatistics.org/blog/index.php?pk=35288&T=1

As an alternative you can also use a QR Code:  

The GUIDs for individual cells are displayed in the table below:

Autocorrelation Function
Time lag kACF(k)T-STATP-value
1-0.254583-1.9720.026613
2-0.000801-0.00620.497536
30.237271.83790.035516
4-0.176-1.36330.088943
50.1347421.04370.150403
60.1256070.97290.167243
7-0.234871-1.81930.036928
80.0709070.54920.292439
90.2669052.06740.021507
10-0.353542-2.73850.004056
110.0064690.05010.4801
120.0032230.0250.490081
13-0.275709-2.13560.0184
140.2208221.71050.046172
15-0.047357-0.36680.35752
16-0.255007-1.97530.026421
170.2658142.0590.021922
180.0472430.36590.357847
19-0.258656-2.00350.024821
200.1418791.0990.138082
210.0100470.07780.469115
22-0.000482-0.00370.498518
230.3602692.79060.003521
24-0.172728-1.33790.092981
25-0.093754-0.72620.235265
260.3101212.40220.009705
27-0.254472-1.97110.026663
280.0950510.73630.23222
290.0720510.55810.289424
30-0.180848-1.40080.083206
310.1113570.86260.195904
320.0096010.07440.470483
33-0.142076-1.10050.137751
34-0.050089-0.3880.3497
350.087470.67750.250333
36-0.199486-1.54520.063776
370.1075520.83310.204047
38-0.070431-0.54560.293697
39-0.065123-0.50440.307899
400.0660050.51130.305519
41-0.091374-0.70780.240912
42-0.054052-0.41870.33847
430.0309250.23950.405749
440.0060430.04680.481411
45-0.039615-0.30690.380008
460.0759550.58830.279255
47-0.039081-0.30270.381574
48-0.067721-0.52460.30091
490.1229440.95230.172378
50-0.119406-0.92490.179357
510.0532320.41230.340781
520.0130020.10070.460056
53-0.05795-0.44890.327567
540.0551790.42740.335304
55-0.027886-0.2160.414858
56-0.023362-0.1810.428504
570.0138860.10760.457351
58-0.016356-0.12670.449803
590.0012450.00960.496167
60NANANA


Partial Autocorrelation Function
Time lag kPACF(k)T-STATP-value
1-0.254583-1.9720.026613
2-0.07016-0.54350.294413
30.235541.82450.036529
4-0.062936-0.48750.313839
50.0890640.68990.246463
60.1418711.09890.138095
7-0.144055-1.11580.134469
8-0.088558-0.6860.247688
90.2889182.2380.014474
10-0.200973-1.55670.062397
11-0.247673-1.91850.029907
12-0.07986-0.61860.269262
13-0.147066-1.13920.129581
140.0162060.12550.450262
150.0906510.70220.242642
16-0.070928-0.54940.292383
170.0828270.64160.261795
180.2054711.59160.058369
19-0.108517-0.84060.201964
20-0.141453-1.09570.138796
210.1602851.24160.109615
220.144451.11890.13382
230.1269780.98360.164638
240.0156220.1210.452046
25-0.119432-0.92510.179306
26-0.02239-0.17340.431449
27-0.168125-1.30230.098897
280.1260470.97640.166403
290.0273610.21190.416436
30-0.063229-0.48980.313041
31-0.08008-0.62030.268704
32-0.153373-1.1880.119753
330.1762321.36510.088661
340.0403260.31240.377922
35-0.020128-0.15590.438312
360.0016010.01240.495074
370.0170280.13190.447754
38-0.158635-1.22880.111976
390.0318310.24660.403045
40-0.132599-1.02710.154247
41-0.083337-0.64550.260525
420.0886760.68690.247403
43-0.059835-0.46350.322347
44-0.150821-1.16830.123663
45-0.016015-0.12410.450844
46-0.053241-0.41240.340756
470.0457250.35420.36222
480.0378240.2930.385274
490.1013880.78530.217671
50-0.136956-1.06090.146504
51-0.10653-0.82520.206269
520.0240310.18610.426479
530.0575970.44610.32855
54-0.014715-0.1140.454818
550.0349840.2710.393667
56-0.108343-0.83920.202338
57-0.050975-0.39480.347177
580.055210.42770.335215
590.0014930.01160.495405
60NANANA

\begin{tabular}{lllllllll}
\hline
Partial Autocorrelation Function \tabularnewline
Time lag k & PACF(k) & T-STAT & P-value \tabularnewline
1 & -0.254583 & -1.972 & 0.026613 \tabularnewline
2 & -0.07016 & -0.5435 & 0.294413 \tabularnewline
3 & 0.23554 & 1.8245 & 0.036529 \tabularnewline
4 & -0.062936 & -0.4875 & 0.313839 \tabularnewline
5 & 0.089064 & 0.6899 & 0.246463 \tabularnewline
6 & 0.141871 & 1.0989 & 0.138095 \tabularnewline
7 & -0.144055 & -1.1158 & 0.134469 \tabularnewline
8 & -0.088558 & -0.686 & 0.247688 \tabularnewline
9 & 0.288918 & 2.238 & 0.014474 \tabularnewline
10 & -0.200973 & -1.5567 & 0.062397 \tabularnewline
11 & -0.247673 & -1.9185 & 0.029907 \tabularnewline
12 & -0.07986 & -0.6186 & 0.269262 \tabularnewline
13 & -0.147066 & -1.1392 & 0.129581 \tabularnewline
14 & 0.016206 & 0.1255 & 0.450262 \tabularnewline
15 & 0.090651 & 0.7022 & 0.242642 \tabularnewline
16 & -0.070928 & -0.5494 & 0.292383 \tabularnewline
17 & 0.082827 & 0.6416 & 0.261795 \tabularnewline
18 & 0.205471 & 1.5916 & 0.058369 \tabularnewline
19 & -0.108517 & -0.8406 & 0.201964 \tabularnewline
20 & -0.141453 & -1.0957 & 0.138796 \tabularnewline
21 & 0.160285 & 1.2416 & 0.109615 \tabularnewline
22 & 0.14445 & 1.1189 & 0.13382 \tabularnewline
23 & 0.126978 & 0.9836 & 0.164638 \tabularnewline
24 & 0.015622 & 0.121 & 0.452046 \tabularnewline
25 & -0.119432 & -0.9251 & 0.179306 \tabularnewline
26 & -0.02239 & -0.1734 & 0.431449 \tabularnewline
27 & -0.168125 & -1.3023 & 0.098897 \tabularnewline
28 & 0.126047 & 0.9764 & 0.166403 \tabularnewline
29 & 0.027361 & 0.2119 & 0.416436 \tabularnewline
30 & -0.063229 & -0.4898 & 0.313041 \tabularnewline
31 & -0.08008 & -0.6203 & 0.268704 \tabularnewline
32 & -0.153373 & -1.188 & 0.119753 \tabularnewline
33 & 0.176232 & 1.3651 & 0.088661 \tabularnewline
34 & 0.040326 & 0.3124 & 0.377922 \tabularnewline
35 & -0.020128 & -0.1559 & 0.438312 \tabularnewline
36 & 0.001601 & 0.0124 & 0.495074 \tabularnewline
37 & 0.017028 & 0.1319 & 0.447754 \tabularnewline
38 & -0.158635 & -1.2288 & 0.111976 \tabularnewline
39 & 0.031831 & 0.2466 & 0.403045 \tabularnewline
40 & -0.132599 & -1.0271 & 0.154247 \tabularnewline
41 & -0.083337 & -0.6455 & 0.260525 \tabularnewline
42 & 0.088676 & 0.6869 & 0.247403 \tabularnewline
43 & -0.059835 & -0.4635 & 0.322347 \tabularnewline
44 & -0.150821 & -1.1683 & 0.123663 \tabularnewline
45 & -0.016015 & -0.1241 & 0.450844 \tabularnewline
46 & -0.053241 & -0.4124 & 0.340756 \tabularnewline
47 & 0.045725 & 0.3542 & 0.36222 \tabularnewline
48 & 0.037824 & 0.293 & 0.385274 \tabularnewline
49 & 0.101388 & 0.7853 & 0.217671 \tabularnewline
50 & -0.136956 & -1.0609 & 0.146504 \tabularnewline
51 & -0.10653 & -0.8252 & 0.206269 \tabularnewline
52 & 0.024031 & 0.1861 & 0.426479 \tabularnewline
53 & 0.057597 & 0.4461 & 0.32855 \tabularnewline
54 & -0.014715 & -0.114 & 0.454818 \tabularnewline
55 & 0.034984 & 0.271 & 0.393667 \tabularnewline
56 & -0.108343 & -0.8392 & 0.202338 \tabularnewline
57 & -0.050975 & -0.3948 & 0.347177 \tabularnewline
58 & 0.05521 & 0.4277 & 0.335215 \tabularnewline
59 & 0.001493 & 0.0116 & 0.495405 \tabularnewline
60 & NA & NA & NA \tabularnewline
\hline
\end{tabular}
%Source: https://freestatistics.org/blog/index.php?pk=35288&T=2

[TABLE]
[ROW][C]Partial Autocorrelation Function[/C][/ROW]
[ROW][C]Time lag k[/C][C]PACF(k)[/C][C]T-STAT[/C][C]P-value[/C][/ROW]
[ROW][C]1[/C][C]-0.254583[/C][C]-1.972[/C][C]0.026613[/C][/ROW]
[ROW][C]2[/C][C]-0.07016[/C][C]-0.5435[/C][C]0.294413[/C][/ROW]
[ROW][C]3[/C][C]0.23554[/C][C]1.8245[/C][C]0.036529[/C][/ROW]
[ROW][C]4[/C][C]-0.062936[/C][C]-0.4875[/C][C]0.313839[/C][/ROW]
[ROW][C]5[/C][C]0.089064[/C][C]0.6899[/C][C]0.246463[/C][/ROW]
[ROW][C]6[/C][C]0.141871[/C][C]1.0989[/C][C]0.138095[/C][/ROW]
[ROW][C]7[/C][C]-0.144055[/C][C]-1.1158[/C][C]0.134469[/C][/ROW]
[ROW][C]8[/C][C]-0.088558[/C][C]-0.686[/C][C]0.247688[/C][/ROW]
[ROW][C]9[/C][C]0.288918[/C][C]2.238[/C][C]0.014474[/C][/ROW]
[ROW][C]10[/C][C]-0.200973[/C][C]-1.5567[/C][C]0.062397[/C][/ROW]
[ROW][C]11[/C][C]-0.247673[/C][C]-1.9185[/C][C]0.029907[/C][/ROW]
[ROW][C]12[/C][C]-0.07986[/C][C]-0.6186[/C][C]0.269262[/C][/ROW]
[ROW][C]13[/C][C]-0.147066[/C][C]-1.1392[/C][C]0.129581[/C][/ROW]
[ROW][C]14[/C][C]0.016206[/C][C]0.1255[/C][C]0.450262[/C][/ROW]
[ROW][C]15[/C][C]0.090651[/C][C]0.7022[/C][C]0.242642[/C][/ROW]
[ROW][C]16[/C][C]-0.070928[/C][C]-0.5494[/C][C]0.292383[/C][/ROW]
[ROW][C]17[/C][C]0.082827[/C][C]0.6416[/C][C]0.261795[/C][/ROW]
[ROW][C]18[/C][C]0.205471[/C][C]1.5916[/C][C]0.058369[/C][/ROW]
[ROW][C]19[/C][C]-0.108517[/C][C]-0.8406[/C][C]0.201964[/C][/ROW]
[ROW][C]20[/C][C]-0.141453[/C][C]-1.0957[/C][C]0.138796[/C][/ROW]
[ROW][C]21[/C][C]0.160285[/C][C]1.2416[/C][C]0.109615[/C][/ROW]
[ROW][C]22[/C][C]0.14445[/C][C]1.1189[/C][C]0.13382[/C][/ROW]
[ROW][C]23[/C][C]0.126978[/C][C]0.9836[/C][C]0.164638[/C][/ROW]
[ROW][C]24[/C][C]0.015622[/C][C]0.121[/C][C]0.452046[/C][/ROW]
[ROW][C]25[/C][C]-0.119432[/C][C]-0.9251[/C][C]0.179306[/C][/ROW]
[ROW][C]26[/C][C]-0.02239[/C][C]-0.1734[/C][C]0.431449[/C][/ROW]
[ROW][C]27[/C][C]-0.168125[/C][C]-1.3023[/C][C]0.098897[/C][/ROW]
[ROW][C]28[/C][C]0.126047[/C][C]0.9764[/C][C]0.166403[/C][/ROW]
[ROW][C]29[/C][C]0.027361[/C][C]0.2119[/C][C]0.416436[/C][/ROW]
[ROW][C]30[/C][C]-0.063229[/C][C]-0.4898[/C][C]0.313041[/C][/ROW]
[ROW][C]31[/C][C]-0.08008[/C][C]-0.6203[/C][C]0.268704[/C][/ROW]
[ROW][C]32[/C][C]-0.153373[/C][C]-1.188[/C][C]0.119753[/C][/ROW]
[ROW][C]33[/C][C]0.176232[/C][C]1.3651[/C][C]0.088661[/C][/ROW]
[ROW][C]34[/C][C]0.040326[/C][C]0.3124[/C][C]0.377922[/C][/ROW]
[ROW][C]35[/C][C]-0.020128[/C][C]-0.1559[/C][C]0.438312[/C][/ROW]
[ROW][C]36[/C][C]0.001601[/C][C]0.0124[/C][C]0.495074[/C][/ROW]
[ROW][C]37[/C][C]0.017028[/C][C]0.1319[/C][C]0.447754[/C][/ROW]
[ROW][C]38[/C][C]-0.158635[/C][C]-1.2288[/C][C]0.111976[/C][/ROW]
[ROW][C]39[/C][C]0.031831[/C][C]0.2466[/C][C]0.403045[/C][/ROW]
[ROW][C]40[/C][C]-0.132599[/C][C]-1.0271[/C][C]0.154247[/C][/ROW]
[ROW][C]41[/C][C]-0.083337[/C][C]-0.6455[/C][C]0.260525[/C][/ROW]
[ROW][C]42[/C][C]0.088676[/C][C]0.6869[/C][C]0.247403[/C][/ROW]
[ROW][C]43[/C][C]-0.059835[/C][C]-0.4635[/C][C]0.322347[/C][/ROW]
[ROW][C]44[/C][C]-0.150821[/C][C]-1.1683[/C][C]0.123663[/C][/ROW]
[ROW][C]45[/C][C]-0.016015[/C][C]-0.1241[/C][C]0.450844[/C][/ROW]
[ROW][C]46[/C][C]-0.053241[/C][C]-0.4124[/C][C]0.340756[/C][/ROW]
[ROW][C]47[/C][C]0.045725[/C][C]0.3542[/C][C]0.36222[/C][/ROW]
[ROW][C]48[/C][C]0.037824[/C][C]0.293[/C][C]0.385274[/C][/ROW]
[ROW][C]49[/C][C]0.101388[/C][C]0.7853[/C][C]0.217671[/C][/ROW]
[ROW][C]50[/C][C]-0.136956[/C][C]-1.0609[/C][C]0.146504[/C][/ROW]
[ROW][C]51[/C][C]-0.10653[/C][C]-0.8252[/C][C]0.206269[/C][/ROW]
[ROW][C]52[/C][C]0.024031[/C][C]0.1861[/C][C]0.426479[/C][/ROW]
[ROW][C]53[/C][C]0.057597[/C][C]0.4461[/C][C]0.32855[/C][/ROW]
[ROW][C]54[/C][C]-0.014715[/C][C]-0.114[/C][C]0.454818[/C][/ROW]
[ROW][C]55[/C][C]0.034984[/C][C]0.271[/C][C]0.393667[/C][/ROW]
[ROW][C]56[/C][C]-0.108343[/C][C]-0.8392[/C][C]0.202338[/C][/ROW]
[ROW][C]57[/C][C]-0.050975[/C][C]-0.3948[/C][C]0.347177[/C][/ROW]
[ROW][C]58[/C][C]0.05521[/C][C]0.4277[/C][C]0.335215[/C][/ROW]
[ROW][C]59[/C][C]0.001493[/C][C]0.0116[/C][C]0.495405[/C][/ROW]
[ROW][C]60[/C][C]NA[/C][C]NA[/C][C]NA[/C][/ROW]
[/TABLE]
Source: https://freestatistics.org/blog/index.php?pk=35288&T=2

Globally Unique Identifier (entire table): ba.freestatistics.org/blog/index.php?pk=35288&T=2

As an alternative you can also use a QR Code:  

The GUIDs for individual cells are displayed in the table below:

Partial Autocorrelation Function
Time lag kPACF(k)T-STATP-value
1-0.254583-1.9720.026613
2-0.07016-0.54350.294413
30.235541.82450.036529
4-0.062936-0.48750.313839
50.0890640.68990.246463
60.1418711.09890.138095
7-0.144055-1.11580.134469
8-0.088558-0.6860.247688
90.2889182.2380.014474
10-0.200973-1.55670.062397
11-0.247673-1.91850.029907
12-0.07986-0.61860.269262
13-0.147066-1.13920.129581
140.0162060.12550.450262
150.0906510.70220.242642
16-0.070928-0.54940.292383
170.0828270.64160.261795
180.2054711.59160.058369
19-0.108517-0.84060.201964
20-0.141453-1.09570.138796
210.1602851.24160.109615
220.144451.11890.13382
230.1269780.98360.164638
240.0156220.1210.452046
25-0.119432-0.92510.179306
26-0.02239-0.17340.431449
27-0.168125-1.30230.098897
280.1260470.97640.166403
290.0273610.21190.416436
30-0.063229-0.48980.313041
31-0.08008-0.62030.268704
32-0.153373-1.1880.119753
330.1762321.36510.088661
340.0403260.31240.377922
35-0.020128-0.15590.438312
360.0016010.01240.495074
370.0170280.13190.447754
38-0.158635-1.22880.111976
390.0318310.24660.403045
40-0.132599-1.02710.154247
41-0.083337-0.64550.260525
420.0886760.68690.247403
43-0.059835-0.46350.322347
44-0.150821-1.16830.123663
45-0.016015-0.12410.450844
46-0.053241-0.41240.340756
470.0457250.35420.36222
480.0378240.2930.385274
490.1013880.78530.217671
50-0.136956-1.06090.146504
51-0.10653-0.82520.206269
520.0240310.18610.426479
530.0575970.44610.32855
54-0.014715-0.1140.454818
550.0349840.2710.393667
56-0.108343-0.83920.202338
57-0.050975-0.39480.347177
580.055210.42770.335215
590.0014930.01160.495405
60NANANA


Parameters (Session):
par1 = 1 ; par2 = Include Monthly Dummies ; par3 = No Linear Trend ;
Parameters (R input):
par1 = 60 ; par2 = -0.7 ; par3 = 0 ; par4 = 1 ; par5 = 12 ;
R code (references can be found in the software module):
if (par1 == 'Default') {
par1 = 10*log10(length(x))
} else {
par1 <- as.numeric(par1)
}
par2 <- as.numeric(par2)
par3 <- as.numeric(par3)
par4 <- as.numeric(par4)
par5 <- as.numeric(par5)
if (par2 == 0) {
x <- log(x)
} else {
x <- (x ^ par2 - 1) / par2
}
if (par3 > 0) x <- diff(x,lag=1,difference=par3)
if (par4 > 0) x <- diff(x,lag=par5,difference=par4)
bitmap(file='pic1.png')
racf <- acf(x,par1,main='Autocorrelation',xlab='lags',ylab='ACF')
dev.off()
bitmap(file='pic2.png')
rpacf <- pacf(x,par1,main='Partial Autocorrelation',xlab='lags',ylab='PACF')
dev.off()
(myacf <- c(racf$acf))
(mypacf <- c(rpacf$acf))
lengthx <- length(x)
sqrtn <- sqrt(lengthx)
load(file='createtable')
a<-table.start()
a<-table.row.start(a)
a<-table.element(a,'Autocorrelation Function',4,TRUE)
a<-table.row.end(a)
a<-table.row.start(a)
a<-table.element(a,'Time lag k',header=TRUE)
a<-table.element(a,hyperlink('basics.htm','ACF(k)','click here for more information about the Autocorrelation Function'),header=TRUE)
a<-table.element(a,'T-STAT',header=TRUE)
a<-table.element(a,'P-value',header=TRUE)
a<-table.row.end(a)
for (i in 2:(par1+1)) {
a<-table.row.start(a)
a<-table.element(a,i-1,header=TRUE)
a<-table.element(a,round(myacf[i],6))
mytstat <- myacf[i]*sqrtn
a<-table.element(a,round(mytstat,4))
a<-table.element(a,round(1-pt(abs(mytstat),lengthx),6))
a<-table.row.end(a)
}
a<-table.end(a)
table.save(a,file='mytable.tab')
a<-table.start()
a<-table.row.start(a)
a<-table.element(a,'Partial Autocorrelation Function',4,TRUE)
a<-table.row.end(a)
a<-table.row.start(a)
a<-table.element(a,'Time lag k',header=TRUE)
a<-table.element(a,hyperlink('basics.htm','PACF(k)','click here for more information about the Partial Autocorrelation Function'),header=TRUE)
a<-table.element(a,'T-STAT',header=TRUE)
a<-table.element(a,'P-value',header=TRUE)
a<-table.row.end(a)
for (i in 1:par1) {
a<-table.row.start(a)
a<-table.element(a,i,header=TRUE)
a<-table.element(a,round(mypacf[i],6))
mytstat <- mypacf[i]*sqrtn
a<-table.element(a,round(mytstat,4))
a<-table.element(a,round(1-pt(abs(mytstat),lengthx),6))
a<-table.row.end(a)
}
a<-table.end(a)
table.save(a,file='mytable1.tab')