Free Statistics

of Irreproducible Research!

Author's title

Author*The author of this computation has been verified*
R Software Modulerwasp_autocorrelation.wasp
Title produced by software(Partial) Autocorrelation Function
Date of computationFri, 19 Dec 2008 12:52:27 -0700
Cite this page as followsStatistical Computations at FreeStatistics.org, Office for Research Development and Education, URL https://freestatistics.org/blog/index.php?v=date/2008/Dec/19/t1229716910mscaekwbgitei3c.htm/, Retrieved Wed, 15 May 2024 23:49:07 +0000
Statistical Computations at FreeStatistics.org, Office for Research Development and Education, URL https://freestatistics.org/blog/index.php?pk=35256, Retrieved Wed, 15 May 2024 23:49:07 +0000
QR Codes:

Original text written by user:
IsPrivate?No (this computation is public)
User-defined keywords
Estimated Impact188
Family? (F = Feedback message, R = changed R code, M = changed R Module, P = changed Parameters, D = changed Data)
-     [(Partial) Autocorrelation Function] [Autocorrelation F...] [2008-12-12 14:23:51] [1ce0d16c8f4225c977b42c8fa93bc163]
-   P   [(Partial) Autocorrelation Function] [Autocorrelation F...] [2008-12-18 11:12:14] [1ce0d16c8f4225c977b42c8fa93bc163]
-   P     [(Partial) Autocorrelation Function] [Autocorrelation F...] [2008-12-19 19:24:43] [1ce0d16c8f4225c977b42c8fa93bc163]
-   P         [(Partial) Autocorrelation Function] [Autocorrelation F...] [2008-12-19 19:52:27] [8758b22b4a10c08c31202f233362e983] [Current]
Feedback Forum

Post a new message
Dataseries X:
9700
9081
9084
9743
8587
9731
9563
9998
9437
10038
9918
9252
9737
9035
9133
9487
8700
9627
8947
9283
8829
9947
9628
9318
9605
8640
9214
9567
8547
9185
9470
9123
9278
10170
9434
9655
9429
8739
9552
9687
9019
9672
9206
9069
9788
10312
10105
9863
9656
9295
9946
9701
9049
10190
9706
9765
9893
9994
10433
10073
10112
9266
9820
10097
9115
10411
9678
10408
10153
10368
10581
10597
10680
9738
9556


Summary of computational transaction
Raw Inputview raw input (R code)
Raw Outputview raw output of R engine
Computing time1 seconds
R Server'Gwilym Jenkins' @ 72.249.127.135

\begin{tabular}{lllllllll}
\hline
Summary of computational transaction \tabularnewline
Raw Input & view raw input (R code)  \tabularnewline
Raw Output & view raw output of R engine  \tabularnewline
Computing time & 1 seconds \tabularnewline
R Server & 'Gwilym Jenkins' @ 72.249.127.135 \tabularnewline
\hline
\end{tabular}
%Source: https://freestatistics.org/blog/index.php?pk=35256&T=0

[TABLE]
[ROW][C]Summary of computational transaction[/C][/ROW]
[ROW][C]Raw Input[/C][C]view raw input (R code) [/C][/ROW]
[ROW][C]Raw Output[/C][C]view raw output of R engine [/C][/ROW]
[ROW][C]Computing time[/C][C]1 seconds[/C][/ROW]
[ROW][C]R Server[/C][C]'Gwilym Jenkins' @ 72.249.127.135[/C][/ROW]
[/TABLE]
Source: https://freestatistics.org/blog/index.php?pk=35256&T=0

Globally Unique Identifier (entire table): ba.freestatistics.org/blog/index.php?pk=35256&T=0

As an alternative you can also use a QR Code:  

The GUIDs for individual cells are displayed in the table below:

Summary of computational transaction
Raw Inputview raw input (R code)
Raw Outputview raw output of R engine
Computing time1 seconds
R Server'Gwilym Jenkins' @ 72.249.127.135


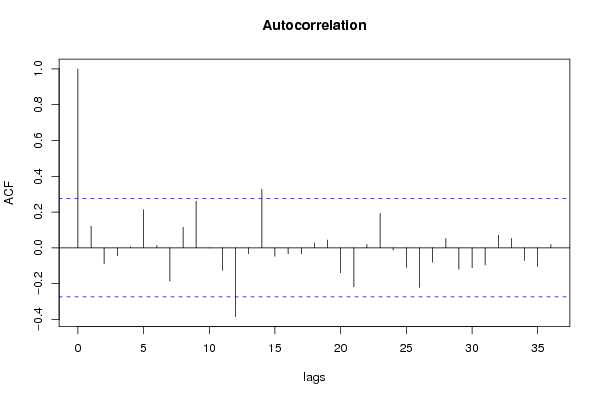
Autocorrelation Function
Time lag kACF(k)T-STATP-value
10.1202320.85860.197281
2-0.089672-0.64040.262395
3-0.044192-0.31560.376799
40.0068510.04890.480585
50.2129321.52060.067263
60.0122010.08710.465454
7-0.185915-1.32770.095095
80.1150710.82180.207516
90.2598881.8560.03462
10-0.000833-0.00590.497638
11-0.12693-0.90650.184478
12-0.385114-2.75030.00411
13-0.033379-0.23840.406272
140.3266352.33260.011825
15-0.047024-0.33580.369194
16-0.033152-0.23680.406898
17-0.034205-0.24430.404
180.0247790.1770.430121
190.0433370.30950.379105
20-0.139178-0.99390.162474
21-0.217931-1.55630.062906
220.0188520.13460.446718
230.1922961.37330.087838
24-0.013017-0.0930.463151
25-0.109685-0.78330.218534
26-0.222044-1.58570.059493
27-0.080924-0.57790.282933
280.0513270.36660.357735
29-0.119157-0.85090.199388
30-0.111341-0.79510.21511
31-0.095742-0.68370.248618
320.0695410.49660.310794
330.0513860.3670.357579
34-0.071047-0.50740.307039
35-0.104249-0.74450.229999
360.0188980.1350.446589

\begin{tabular}{lllllllll}
\hline
Autocorrelation Function \tabularnewline
Time lag k & ACF(k) & T-STAT & P-value \tabularnewline
1 & 0.120232 & 0.8586 & 0.197281 \tabularnewline
2 & -0.089672 & -0.6404 & 0.262395 \tabularnewline
3 & -0.044192 & -0.3156 & 0.376799 \tabularnewline
4 & 0.006851 & 0.0489 & 0.480585 \tabularnewline
5 & 0.212932 & 1.5206 & 0.067263 \tabularnewline
6 & 0.012201 & 0.0871 & 0.465454 \tabularnewline
7 & -0.185915 & -1.3277 & 0.095095 \tabularnewline
8 & 0.115071 & 0.8218 & 0.207516 \tabularnewline
9 & 0.259888 & 1.856 & 0.03462 \tabularnewline
10 & -0.000833 & -0.0059 & 0.497638 \tabularnewline
11 & -0.12693 & -0.9065 & 0.184478 \tabularnewline
12 & -0.385114 & -2.7503 & 0.00411 \tabularnewline
13 & -0.033379 & -0.2384 & 0.406272 \tabularnewline
14 & 0.326635 & 2.3326 & 0.011825 \tabularnewline
15 & -0.047024 & -0.3358 & 0.369194 \tabularnewline
16 & -0.033152 & -0.2368 & 0.406898 \tabularnewline
17 & -0.034205 & -0.2443 & 0.404 \tabularnewline
18 & 0.024779 & 0.177 & 0.430121 \tabularnewline
19 & 0.043337 & 0.3095 & 0.379105 \tabularnewline
20 & -0.139178 & -0.9939 & 0.162474 \tabularnewline
21 & -0.217931 & -1.5563 & 0.062906 \tabularnewline
22 & 0.018852 & 0.1346 & 0.446718 \tabularnewline
23 & 0.192296 & 1.3733 & 0.087838 \tabularnewline
24 & -0.013017 & -0.093 & 0.463151 \tabularnewline
25 & -0.109685 & -0.7833 & 0.218534 \tabularnewline
26 & -0.222044 & -1.5857 & 0.059493 \tabularnewline
27 & -0.080924 & -0.5779 & 0.282933 \tabularnewline
28 & 0.051327 & 0.3666 & 0.357735 \tabularnewline
29 & -0.119157 & -0.8509 & 0.199388 \tabularnewline
30 & -0.111341 & -0.7951 & 0.21511 \tabularnewline
31 & -0.095742 & -0.6837 & 0.248618 \tabularnewline
32 & 0.069541 & 0.4966 & 0.310794 \tabularnewline
33 & 0.051386 & 0.367 & 0.357579 \tabularnewline
34 & -0.071047 & -0.5074 & 0.307039 \tabularnewline
35 & -0.104249 & -0.7445 & 0.229999 \tabularnewline
36 & 0.018898 & 0.135 & 0.446589 \tabularnewline
\hline
\end{tabular}
%Source: https://freestatistics.org/blog/index.php?pk=35256&T=1

[TABLE]
[ROW][C]Autocorrelation Function[/C][/ROW]
[ROW][C]Time lag k[/C][C]ACF(k)[/C][C]T-STAT[/C][C]P-value[/C][/ROW]
[ROW][C]1[/C][C]0.120232[/C][C]0.8586[/C][C]0.197281[/C][/ROW]
[ROW][C]2[/C][C]-0.089672[/C][C]-0.6404[/C][C]0.262395[/C][/ROW]
[ROW][C]3[/C][C]-0.044192[/C][C]-0.3156[/C][C]0.376799[/C][/ROW]
[ROW][C]4[/C][C]0.006851[/C][C]0.0489[/C][C]0.480585[/C][/ROW]
[ROW][C]5[/C][C]0.212932[/C][C]1.5206[/C][C]0.067263[/C][/ROW]
[ROW][C]6[/C][C]0.012201[/C][C]0.0871[/C][C]0.465454[/C][/ROW]
[ROW][C]7[/C][C]-0.185915[/C][C]-1.3277[/C][C]0.095095[/C][/ROW]
[ROW][C]8[/C][C]0.115071[/C][C]0.8218[/C][C]0.207516[/C][/ROW]
[ROW][C]9[/C][C]0.259888[/C][C]1.856[/C][C]0.03462[/C][/ROW]
[ROW][C]10[/C][C]-0.000833[/C][C]-0.0059[/C][C]0.497638[/C][/ROW]
[ROW][C]11[/C][C]-0.12693[/C][C]-0.9065[/C][C]0.184478[/C][/ROW]
[ROW][C]12[/C][C]-0.385114[/C][C]-2.7503[/C][C]0.00411[/C][/ROW]
[ROW][C]13[/C][C]-0.033379[/C][C]-0.2384[/C][C]0.406272[/C][/ROW]
[ROW][C]14[/C][C]0.326635[/C][C]2.3326[/C][C]0.011825[/C][/ROW]
[ROW][C]15[/C][C]-0.047024[/C][C]-0.3358[/C][C]0.369194[/C][/ROW]
[ROW][C]16[/C][C]-0.033152[/C][C]-0.2368[/C][C]0.406898[/C][/ROW]
[ROW][C]17[/C][C]-0.034205[/C][C]-0.2443[/C][C]0.404[/C][/ROW]
[ROW][C]18[/C][C]0.024779[/C][C]0.177[/C][C]0.430121[/C][/ROW]
[ROW][C]19[/C][C]0.043337[/C][C]0.3095[/C][C]0.379105[/C][/ROW]
[ROW][C]20[/C][C]-0.139178[/C][C]-0.9939[/C][C]0.162474[/C][/ROW]
[ROW][C]21[/C][C]-0.217931[/C][C]-1.5563[/C][C]0.062906[/C][/ROW]
[ROW][C]22[/C][C]0.018852[/C][C]0.1346[/C][C]0.446718[/C][/ROW]
[ROW][C]23[/C][C]0.192296[/C][C]1.3733[/C][C]0.087838[/C][/ROW]
[ROW][C]24[/C][C]-0.013017[/C][C]-0.093[/C][C]0.463151[/C][/ROW]
[ROW][C]25[/C][C]-0.109685[/C][C]-0.7833[/C][C]0.218534[/C][/ROW]
[ROW][C]26[/C][C]-0.222044[/C][C]-1.5857[/C][C]0.059493[/C][/ROW]
[ROW][C]27[/C][C]-0.080924[/C][C]-0.5779[/C][C]0.282933[/C][/ROW]
[ROW][C]28[/C][C]0.051327[/C][C]0.3666[/C][C]0.357735[/C][/ROW]
[ROW][C]29[/C][C]-0.119157[/C][C]-0.8509[/C][C]0.199388[/C][/ROW]
[ROW][C]30[/C][C]-0.111341[/C][C]-0.7951[/C][C]0.21511[/C][/ROW]
[ROW][C]31[/C][C]-0.095742[/C][C]-0.6837[/C][C]0.248618[/C][/ROW]
[ROW][C]32[/C][C]0.069541[/C][C]0.4966[/C][C]0.310794[/C][/ROW]
[ROW][C]33[/C][C]0.051386[/C][C]0.367[/C][C]0.357579[/C][/ROW]
[ROW][C]34[/C][C]-0.071047[/C][C]-0.5074[/C][C]0.307039[/C][/ROW]
[ROW][C]35[/C][C]-0.104249[/C][C]-0.7445[/C][C]0.229999[/C][/ROW]
[ROW][C]36[/C][C]0.018898[/C][C]0.135[/C][C]0.446589[/C][/ROW]
[/TABLE]
Source: https://freestatistics.org/blog/index.php?pk=35256&T=1

Globally Unique Identifier (entire table): ba.freestatistics.org/blog/index.php?pk=35256&T=1

As an alternative you can also use a QR Code:  

The GUIDs for individual cells are displayed in the table below:

Autocorrelation Function
Time lag kACF(k)T-STATP-value
10.1202320.85860.197281
2-0.089672-0.64040.262395
3-0.044192-0.31560.376799
40.0068510.04890.480585
50.2129321.52060.067263
60.0122010.08710.465454
7-0.185915-1.32770.095095
80.1150710.82180.207516
90.2598881.8560.03462
10-0.000833-0.00590.497638
11-0.12693-0.90650.184478
12-0.385114-2.75030.00411
13-0.033379-0.23840.406272
140.3266352.33260.011825
15-0.047024-0.33580.369194
16-0.033152-0.23680.406898
17-0.034205-0.24430.404
180.0247790.1770.430121
190.0433370.30950.379105
20-0.139178-0.99390.162474
21-0.217931-1.55630.062906
220.0188520.13460.446718
230.1922961.37330.087838
24-0.013017-0.0930.463151
25-0.109685-0.78330.218534
26-0.222044-1.58570.059493
27-0.080924-0.57790.282933
280.0513270.36660.357735
29-0.119157-0.85090.199388
30-0.111341-0.79510.21511
31-0.095742-0.68370.248618
320.0695410.49660.310794
330.0513860.3670.357579
34-0.071047-0.50740.307039
35-0.104249-0.74450.229999
360.0188980.1350.446589


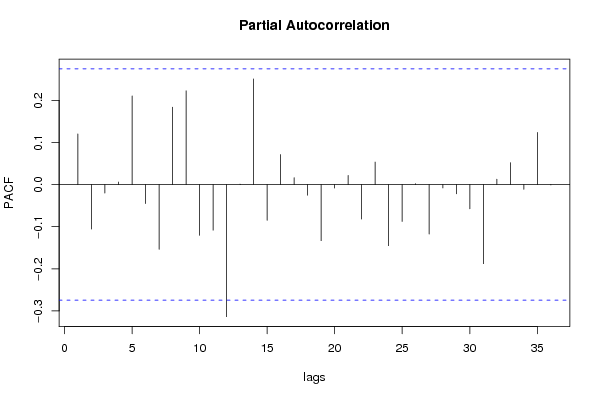
Partial Autocorrelation Function
Time lag kPACF(k)T-STATP-value
10.1202320.85860.197281
2-0.105655-0.75450.227001
3-0.02008-0.14340.443271
40.0059660.04260.483092
50.2103691.50230.069589
6-0.045047-0.32170.374498
7-0.153793-1.09830.138615
80.1836391.31140.09779
90.2225361.58920.059095
10-0.120355-0.85950.197043
11-0.108127-0.77220.221785
12-0.31349-2.23880.014781
130.001090.00780.496909
140.2506851.79020.039676
15-0.084731-0.60510.273899
160.0712070.50850.306641
170.0162890.11630.453925
18-0.025162-0.17970.429052
19-0.133121-0.95070.173128
20-0.008198-0.05850.476772
210.0215810.15410.439061
22-0.081749-0.58380.280961
230.0534980.3820.352006
24-0.144962-1.03520.152722
25-0.087423-0.62430.267599
260.0020.01430.494329
27-0.117331-0.83790.202995
28-0.00789-0.05630.477643
29-0.021886-0.15630.438209
30-0.057439-0.41020.34169
31-0.187766-1.34090.092945
320.0127670.09120.463855
330.0518750.37050.356288
34-0.011258-0.08040.468118
350.1237170.88350.190551
36-0.000713-0.00510.49798

\begin{tabular}{lllllllll}
\hline
Partial Autocorrelation Function \tabularnewline
Time lag k & PACF(k) & T-STAT & P-value \tabularnewline
1 & 0.120232 & 0.8586 & 0.197281 \tabularnewline
2 & -0.105655 & -0.7545 & 0.227001 \tabularnewline
3 & -0.02008 & -0.1434 & 0.443271 \tabularnewline
4 & 0.005966 & 0.0426 & 0.483092 \tabularnewline
5 & 0.210369 & 1.5023 & 0.069589 \tabularnewline
6 & -0.045047 & -0.3217 & 0.374498 \tabularnewline
7 & -0.153793 & -1.0983 & 0.138615 \tabularnewline
8 & 0.183639 & 1.3114 & 0.09779 \tabularnewline
9 & 0.222536 & 1.5892 & 0.059095 \tabularnewline
10 & -0.120355 & -0.8595 & 0.197043 \tabularnewline
11 & -0.108127 & -0.7722 & 0.221785 \tabularnewline
12 & -0.31349 & -2.2388 & 0.014781 \tabularnewline
13 & 0.00109 & 0.0078 & 0.496909 \tabularnewline
14 & 0.250685 & 1.7902 & 0.039676 \tabularnewline
15 & -0.084731 & -0.6051 & 0.273899 \tabularnewline
16 & 0.071207 & 0.5085 & 0.306641 \tabularnewline
17 & 0.016289 & 0.1163 & 0.453925 \tabularnewline
18 & -0.025162 & -0.1797 & 0.429052 \tabularnewline
19 & -0.133121 & -0.9507 & 0.173128 \tabularnewline
20 & -0.008198 & -0.0585 & 0.476772 \tabularnewline
21 & 0.021581 & 0.1541 & 0.439061 \tabularnewline
22 & -0.081749 & -0.5838 & 0.280961 \tabularnewline
23 & 0.053498 & 0.382 & 0.352006 \tabularnewline
24 & -0.144962 & -1.0352 & 0.152722 \tabularnewline
25 & -0.087423 & -0.6243 & 0.267599 \tabularnewline
26 & 0.002 & 0.0143 & 0.494329 \tabularnewline
27 & -0.117331 & -0.8379 & 0.202995 \tabularnewline
28 & -0.00789 & -0.0563 & 0.477643 \tabularnewline
29 & -0.021886 & -0.1563 & 0.438209 \tabularnewline
30 & -0.057439 & -0.4102 & 0.34169 \tabularnewline
31 & -0.187766 & -1.3409 & 0.092945 \tabularnewline
32 & 0.012767 & 0.0912 & 0.463855 \tabularnewline
33 & 0.051875 & 0.3705 & 0.356288 \tabularnewline
34 & -0.011258 & -0.0804 & 0.468118 \tabularnewline
35 & 0.123717 & 0.8835 & 0.190551 \tabularnewline
36 & -0.000713 & -0.0051 & 0.49798 \tabularnewline
\hline
\end{tabular}
%Source: https://freestatistics.org/blog/index.php?pk=35256&T=2

[TABLE]
[ROW][C]Partial Autocorrelation Function[/C][/ROW]
[ROW][C]Time lag k[/C][C]PACF(k)[/C][C]T-STAT[/C][C]P-value[/C][/ROW]
[ROW][C]1[/C][C]0.120232[/C][C]0.8586[/C][C]0.197281[/C][/ROW]
[ROW][C]2[/C][C]-0.105655[/C][C]-0.7545[/C][C]0.227001[/C][/ROW]
[ROW][C]3[/C][C]-0.02008[/C][C]-0.1434[/C][C]0.443271[/C][/ROW]
[ROW][C]4[/C][C]0.005966[/C][C]0.0426[/C][C]0.483092[/C][/ROW]
[ROW][C]5[/C][C]0.210369[/C][C]1.5023[/C][C]0.069589[/C][/ROW]
[ROW][C]6[/C][C]-0.045047[/C][C]-0.3217[/C][C]0.374498[/C][/ROW]
[ROW][C]7[/C][C]-0.153793[/C][C]-1.0983[/C][C]0.138615[/C][/ROW]
[ROW][C]8[/C][C]0.183639[/C][C]1.3114[/C][C]0.09779[/C][/ROW]
[ROW][C]9[/C][C]0.222536[/C][C]1.5892[/C][C]0.059095[/C][/ROW]
[ROW][C]10[/C][C]-0.120355[/C][C]-0.8595[/C][C]0.197043[/C][/ROW]
[ROW][C]11[/C][C]-0.108127[/C][C]-0.7722[/C][C]0.221785[/C][/ROW]
[ROW][C]12[/C][C]-0.31349[/C][C]-2.2388[/C][C]0.014781[/C][/ROW]
[ROW][C]13[/C][C]0.00109[/C][C]0.0078[/C][C]0.496909[/C][/ROW]
[ROW][C]14[/C][C]0.250685[/C][C]1.7902[/C][C]0.039676[/C][/ROW]
[ROW][C]15[/C][C]-0.084731[/C][C]-0.6051[/C][C]0.273899[/C][/ROW]
[ROW][C]16[/C][C]0.071207[/C][C]0.5085[/C][C]0.306641[/C][/ROW]
[ROW][C]17[/C][C]0.016289[/C][C]0.1163[/C][C]0.453925[/C][/ROW]
[ROW][C]18[/C][C]-0.025162[/C][C]-0.1797[/C][C]0.429052[/C][/ROW]
[ROW][C]19[/C][C]-0.133121[/C][C]-0.9507[/C][C]0.173128[/C][/ROW]
[ROW][C]20[/C][C]-0.008198[/C][C]-0.0585[/C][C]0.476772[/C][/ROW]
[ROW][C]21[/C][C]0.021581[/C][C]0.1541[/C][C]0.439061[/C][/ROW]
[ROW][C]22[/C][C]-0.081749[/C][C]-0.5838[/C][C]0.280961[/C][/ROW]
[ROW][C]23[/C][C]0.053498[/C][C]0.382[/C][C]0.352006[/C][/ROW]
[ROW][C]24[/C][C]-0.144962[/C][C]-1.0352[/C][C]0.152722[/C][/ROW]
[ROW][C]25[/C][C]-0.087423[/C][C]-0.6243[/C][C]0.267599[/C][/ROW]
[ROW][C]26[/C][C]0.002[/C][C]0.0143[/C][C]0.494329[/C][/ROW]
[ROW][C]27[/C][C]-0.117331[/C][C]-0.8379[/C][C]0.202995[/C][/ROW]
[ROW][C]28[/C][C]-0.00789[/C][C]-0.0563[/C][C]0.477643[/C][/ROW]
[ROW][C]29[/C][C]-0.021886[/C][C]-0.1563[/C][C]0.438209[/C][/ROW]
[ROW][C]30[/C][C]-0.057439[/C][C]-0.4102[/C][C]0.34169[/C][/ROW]
[ROW][C]31[/C][C]-0.187766[/C][C]-1.3409[/C][C]0.092945[/C][/ROW]
[ROW][C]32[/C][C]0.012767[/C][C]0.0912[/C][C]0.463855[/C][/ROW]
[ROW][C]33[/C][C]0.051875[/C][C]0.3705[/C][C]0.356288[/C][/ROW]
[ROW][C]34[/C][C]-0.011258[/C][C]-0.0804[/C][C]0.468118[/C][/ROW]
[ROW][C]35[/C][C]0.123717[/C][C]0.8835[/C][C]0.190551[/C][/ROW]
[ROW][C]36[/C][C]-0.000713[/C][C]-0.0051[/C][C]0.49798[/C][/ROW]
[/TABLE]
Source: https://freestatistics.org/blog/index.php?pk=35256&T=2

Globally Unique Identifier (entire table): ba.freestatistics.org/blog/index.php?pk=35256&T=2

As an alternative you can also use a QR Code:  

The GUIDs for individual cells are displayed in the table below:

Partial Autocorrelation Function
Time lag kPACF(k)T-STATP-value
10.1202320.85860.197281
2-0.105655-0.75450.227001
3-0.02008-0.14340.443271
40.0059660.04260.483092
50.2103691.50230.069589
6-0.045047-0.32170.374498
7-0.153793-1.09830.138615
80.1836391.31140.09779
90.2225361.58920.059095
10-0.120355-0.85950.197043
11-0.108127-0.77220.221785
12-0.31349-2.23880.014781
130.001090.00780.496909
140.2506851.79020.039676
15-0.084731-0.60510.273899
160.0712070.50850.306641
170.0162890.11630.453925
18-0.025162-0.17970.429052
19-0.133121-0.95070.173128
20-0.008198-0.05850.476772
210.0215810.15410.439061
22-0.081749-0.58380.280961
230.0534980.3820.352006
24-0.144962-1.03520.152722
25-0.087423-0.62430.267599
260.0020.01430.494329
27-0.117331-0.83790.202995
28-0.00789-0.05630.477643
29-0.021886-0.15630.438209
30-0.057439-0.41020.34169
31-0.187766-1.34090.092945
320.0127670.09120.463855
330.0518750.37050.356288
34-0.011258-0.08040.468118
350.1237170.88350.190551
36-0.000713-0.00510.49798


Parameters (Session):
par1 = 36 ; par2 = 1 ; par3 = 0 ; par4 = 2 ; par5 = 12 ;
Parameters (R input):
par1 = 36 ; par2 = 1 ; par3 = 0 ; par4 = 2 ; par5 = 12 ;
R code (references can be found in the software module):
if (par1 == 'Default') {
par1 = 10*log10(length(x))
} else {
par1 <- as.numeric(par1)
}
par2 <- as.numeric(par2)
par3 <- as.numeric(par3)
par4 <- as.numeric(par4)
par5 <- as.numeric(par5)
if (par2 == 0) {
x <- log(x)
} else {
x <- (x ^ par2 - 1) / par2
}
if (par3 > 0) x <- diff(x,lag=1,difference=par3)
if (par4 > 0) x <- diff(x,lag=par5,difference=par4)
bitmap(file='pic1.png')
racf <- acf(x,par1,main='Autocorrelation',xlab='lags',ylab='ACF')
dev.off()
bitmap(file='pic2.png')
rpacf <- pacf(x,par1,main='Partial Autocorrelation',xlab='lags',ylab='PACF')
dev.off()
(myacf <- c(racf$acf))
(mypacf <- c(rpacf$acf))
lengthx <- length(x)
sqrtn <- sqrt(lengthx)
load(file='createtable')
a<-table.start()
a<-table.row.start(a)
a<-table.element(a,'Autocorrelation Function',4,TRUE)
a<-table.row.end(a)
a<-table.row.start(a)
a<-table.element(a,'Time lag k',header=TRUE)
a<-table.element(a,hyperlink('basics.htm','ACF(k)','click here for more information about the Autocorrelation Function'),header=TRUE)
a<-table.element(a,'T-STAT',header=TRUE)
a<-table.element(a,'P-value',header=TRUE)
a<-table.row.end(a)
for (i in 2:(par1+1)) {
a<-table.row.start(a)
a<-table.element(a,i-1,header=TRUE)
a<-table.element(a,round(myacf[i],6))
mytstat <- myacf[i]*sqrtn
a<-table.element(a,round(mytstat,4))
a<-table.element(a,round(1-pt(abs(mytstat),lengthx),6))
a<-table.row.end(a)
}
a<-table.end(a)
table.save(a,file='mytable.tab')
a<-table.start()
a<-table.row.start(a)
a<-table.element(a,'Partial Autocorrelation Function',4,TRUE)
a<-table.row.end(a)
a<-table.row.start(a)
a<-table.element(a,'Time lag k',header=TRUE)
a<-table.element(a,hyperlink('basics.htm','PACF(k)','click here for more information about the Partial Autocorrelation Function'),header=TRUE)
a<-table.element(a,'T-STAT',header=TRUE)
a<-table.element(a,'P-value',header=TRUE)
a<-table.row.end(a)
for (i in 1:par1) {
a<-table.row.start(a)
a<-table.element(a,i,header=TRUE)
a<-table.element(a,round(mypacf[i],6))
mytstat <- mypacf[i]*sqrtn
a<-table.element(a,round(mytstat,4))
a<-table.element(a,round(1-pt(abs(mytstat),lengthx),6))
a<-table.row.end(a)
}
a<-table.end(a)
table.save(a,file='mytable1.tab')